|
Oracle® Business Intelligence Discoverer Plus User's Guide
10g Release 2 (10.1.2.0.0) Part No. B13915-01 |
|
 Previous |
 Next |
|
Oracle® Business Intelligence Discoverer Plus User's Guide
10g Release 2 (10.1.2.0.0) Part No. B13915-01 |
|
 Previous |
 Next |
Example 1: This example shows how to use the Sort Crosstab dialog to sort a crosstab worksheet horizontally. In this example, you want to sort data on Profit SUM down the column for the 1999 year. In the figure below, Region (on the left axis) is selected in the Item to Sort list. Profit SUM is selected in the Data Point list and 1999 is selected in the Column list.
Example 2: This example shows how to use the Sort Crosstab dialog to sort a crosstab worksheet horizontally. In this example, you want to sort data on Profit SUM along the row for the Central region. In the figure below, Calendar Year (on the top axis) is selected in the Item to Sort list. Profit SUM is selected in the Data Point list and Central is selected in the Row list.
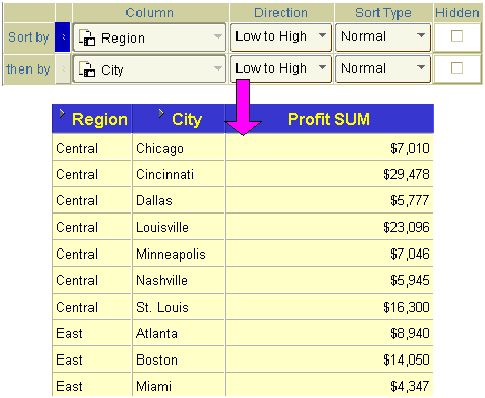
Example 3: This example shows how to use the Sort dialog to sort on one item within another item. In the figure below, you want to sort on City within Region. To specify Region as the primary sort, you place Region in the Sort by row of the sort table. To specify City as the secondary sort, you place City in the Then by row of the sort table. You can add further levels of sorting as required.
Figure 16-7 A table worksheet with two levels of sorting
