|
Oracle® Enterprise Manager Concepts
10g Release 1 (10.1) Part No. B12016-02 |
|
|
|
|
|
Oracle® Enterprise Manager Concepts
10g Release 1 (10.1) Part No. B12016-02 |
|
|
|
|
This chapter describes how you can use Enterprise Manager to manage the crucial components of your middle-tier application servers, which provide you with a platform for deploying your e-business Web applications.
Specifically, this chapter describes how Enterprise Manager can help you manage all aspects of your Application Server installations.
The Oracle Application Server management capabilities of Enterprise Manager can be broken down into the following topics:
Out-of-Box Management of Oracle Application Server Instances
Centralized Management of Oracle Application Server Instances
Oracle Application Server Diagnostics and Historical Analysis
When you install an Oracle Application Server instance, you automatically get the Oracle Application Server Control Console to manage that instance. Each installed Application Server has its own Application Server Control Console.
The Application Server Control Console is the Enterprise Manager Web-based application for managing Oracle Application Server 10g (9.0.4). The Application Server Control Console provides Web-based management tools designed specifically for Application Server.
From the Application Server Control Console, you can monitor and administer a single Oracle Application Server instance, a farm of Oracle Application Server instances, or Oracle Application Server Clusters. You can also deploy applications, monitor real-time performance, manage security, and configure the components of your Application Server.
The Application Server Control relies on various underlying technologies to discover, monitor, and administer the Oracle Application Server environment.
The Application Server Control consists of the Application Server Control Console and its underlying technologies:
Oracle Dynamic Monitoring Service (DMS)
Oracle Process Management Notification (OPMN)
Distributed Configuration Management (DCM)
A local version of the Oracle Management Agent specifically designed to gather monitoring data for the Application Server Control Console.
For additional management functionality, for example, Application Service Level Management, deployments, historical data collections for performance trending alerts, and so on, you can deploy the Grid Control Console to get additional Application Server management.
|
See Also: Oracle9i Application Server Administrator’s Guide |
While Application Server Control Console provides standalone management for an Application Server and its components, you can centrally manage all your Application Servers through one tool rather than through several Application Server Control Consoles by using the Grid Control Console (Figure 1-2). For example, say you have 10 Application Servers deployed on five hosts. By deploying a Management Agent on each host, Enterprise Manager automatically discovers the Application Server on those hosts and automatically begins monitoring them using default monitoring levels, notification rules, and so on.
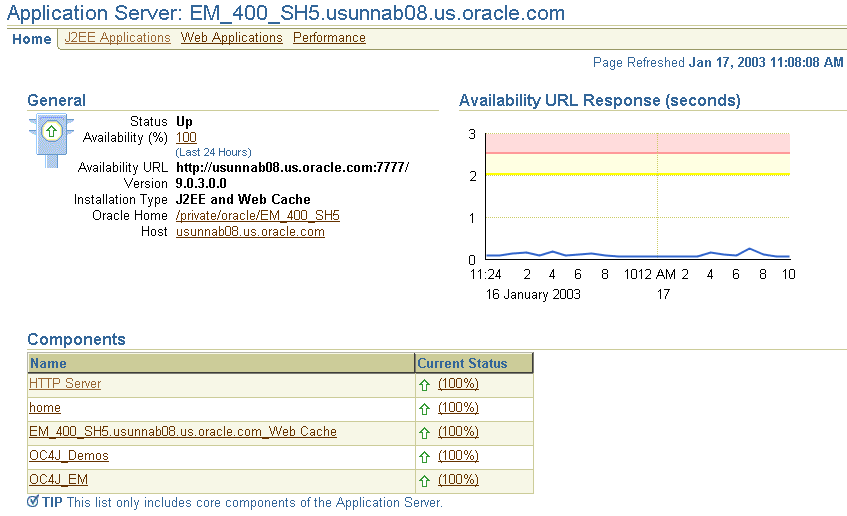
Both the Application Server Control Console and the Grid Control Console have their own Application Server Home page which provides easy access to key information required by your application server administrators. The Application Server Home page on the Grid Control Console (Figure 5-1) provides:
Application server status, responsiveness, and performance data
Resource usage for the application server and its components
A single view of all Java 2 Platform Enterprise Edition (J2EE) applications and web services
Alerts and diagnostic drill-downs so you can identify and resolve problems quickly
Links to Oracle Application Server component home pages
Links to the Oracle Application Server Control Console for administration operations such as starting and stopping components, modifying configurations, and deploying applications
Figure 5-1 Application Server Home Page of Grid Control Console

The Oracle Application Server Control Console provides a full set of features for performing Oracle Application Server administration, with Web-based interfaces for performing operations such as:
Starting and stopping services
Modifying server configuration parameters
Creating new OC4J containers and adding JVMs
Configuring J2EE resources such as Java Database Connectivity (JDBC) data sources and Java Authentication and Authorization Service (JAAS) providers for J2EE application security
Deploying J2EE and Web Services applications
Managing additional application server components such as Oracle Application Server Portal and Oracle Application Server Reports Services
Creating clusters, that are also managed with Oracle Application Server Control Console, that speed up the configuration and deployment of your Web applications
Many of these management operations can also be performed across Oracle Application Server clusters, which are also managed with Enterprise Manager.
|
See Also: Oracle9i Application Server Administrator’s Guide |
Enterprise Manager automatically gathers and evaluates diagnostic information from Oracle Application Server systems distributed across the enterprise. As with all services managed by Enterprise Manager, an extensive array of Oracle Application Server performance metrics are automatically monitored against predefined thresholds. Alerts are generated when metrics exceed these thresholds.
For example, Enterprise Manager can automatically monitor:
The CPU or memory consumption of the application server, including detailed monitoring of individual Java Virtual Machines (JVMs) being run by the server’s Oracle Application Server Containers for J2EE (OC4J) instances
J2EE application responsiveness from the application down through individual servlets and Enterprise JavaBeans (EJBs)
HyperText Transfer Protocol (HTTP) Server session volumes, connection duration, and error rates
Oracle Application Server Web Cache hit rates and volumes
When you receive an Oracle Application Server alert notification, Enterprise Manager makes it easy to investigate the problem. For example, notification of excessive CPU consumption by OC4J may lead to investigation of the applications running in that container. Using the J2EE Applications tab of the Application Server Home page (Figure 5-2), you can quickly identify the highest volume or least responsive application. You can then drill down and diagnose application’s servlets, Java Server Pages (JSPs), or EJBs so you can pinpoint the bottleneck.
|
See Also: "Comparing the Performance of Deployed Applications" in the Enterprise Manager online help |
Figure 5-2 Monitoring the Performance of Your Deployed J2EE Applications

This section describes important management tasks, such as:
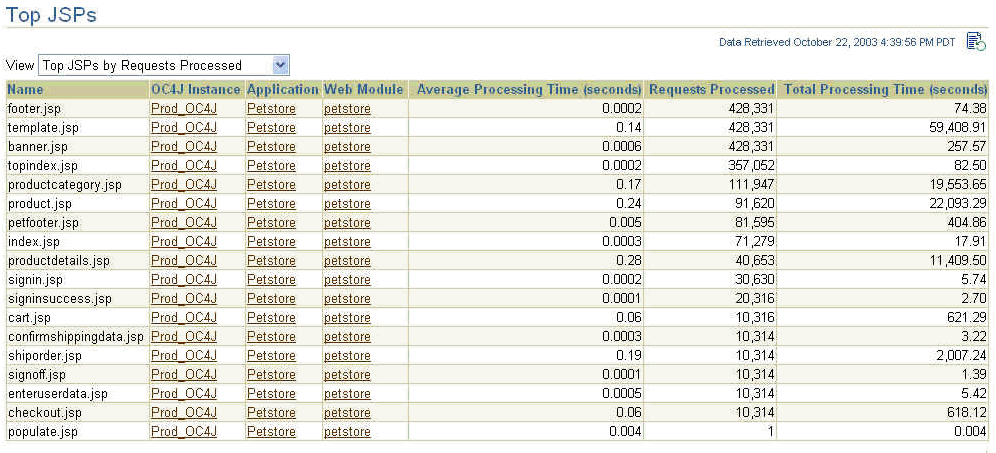
In addition to automated monitoring, Enterprise Manager provides you with easy access to flexible diagnostic data in the form of "top" reports, such as the top servlets or EJBs. These diagnostic reports can be generated based on a variety of criteria. For example, you can identify the top servlets by response time or session activity (Figure 5-3).
Figure 5-3 Displaying the Top JSPs for a J2EE Application

As with all Enterprise Manager diagnostics, the Oracle Application Server diagnostic reports can be based on current or historical data. Oracle Application Server metrics are collected and stored in the Management Repository, so you analyze the data well after the situation has changed. For example, you can use historical data and diagnostic reports to research an application performance problem that occurred days or even weeks ago.
The historical data maintained by Enterprise Manager allows you to track performance trends and compare data across other Oracle Application Server systems. For example, you can investigate the following sequence:
What’s the average request processing time for OC4J server #1 at this moment?
How did OC4J server #1 do over the past twenty-four hours?
How does that performance trend compare to OC4J server #2?
Logical diagnostic processes such as this are easily performed using Enterprise Manager.
|
See Also: "Introduction to Managing Oracle Application Server Containers for J2EE" in the Enterprise Manager online help |