|
Oracle® BPEL Process Analytics Quick Start Guide
10g Release 2 (10.1.2) Part No. B15928-01 |
|
 Previous |
 Next |
|
Oracle® BPEL Process Analytics Quick Start Guide
10g Release 2 (10.1.2) Part No. B15928-01 |
|
 Previous |
 Next |
Oracle BPEL Process Analytics is a feature of Oracle BPEL Process Manager. Oracle BPEL Process Analytics provides dashboards that measure service-level agreement, alert on exceptions, and gives greater business visibility. The Oracle BPEL Process Analytics Console is used to monitor business processes that might span multiple Oracle BPEL Process Manager processes. This console delivers useful information about service-level agreements, process metrics, and exceptions.
A business analyst can define key performance indicators (KPIs) on one or more Oracle BPEL Process Manager processes that implement a single business process and monitor the performance of these KPIs. Oracle BPEL Process Analytics offers the following benefits:
Provides the ability to monitor one or more Oracle BPEL Process Manager processes as a single business process
Provides the ability to define KPIs on the business processes
Enables alignment between business operations and business strategy
Provides a comprehensive view of related events across multiple business processes and allows the analyst to monitor these related events
Provides the ability to notify mangers when KPIs are not performing at the optimal levels
This chapter includes the following topics:
To understand how Oracle BPEL Process Analytics works, consider the Oracle BPEL Process Manager process flow for a loan procurement process, as illustrated in Figure 1-1. In this process flow, a customer requests a loan. The loan procurement company requests a credit rating on the customer. If the returned credit rating is positive, then the application is submitted to two (fictitious) loan services: United Loan Service and Star Loan Service. Each service returns an offer on the loan and the lowest offer is presented to the customer. The customer accepts or rejects the loan offer. The goal of the loan procurement company is to return the best offer for a loan request (or reject the loan request) as quickly as possible.
Business events are captured at five points within the process flow illustrated in Figure 1-1, as follows:
E1: LoanRequest - A customer requests a loan
E2 - LoanRejected - On the basis of the credit rating, the loan service rejects the loan request
E3 - LoanApproved - On the basis of the credit rating, the loan service accepts the loan request
E4 - LoanSelected - A loan for the customer is selected based on lowest APR
E5 - LoanAccepted - The customer accepts the loan
Using Oracle BPEL Process Analytics, events in this process flow, can be captured, analyzed, and then processed and presented in many ways for analysis, including the following:
A chart displaying events, as they occur.
A table displaying the time at which a loan application was sent for processing, the time at which the loan offer was received, or if receipt of an offer is still pending.
Line graphs displaying:
The average time it takes for the credit rating service to return a rating
The average time it takes for each loan service to return an offer
The average time it takes for a decision to be made on which offer to present to the customer
Bar graphs displaying:
The number of loan applications processed by each loan service
The number of loan applications rejected by each loan service
If the analysis shows that the number of loan applications accepted by customers exceeds target goals, for example, then Oracle BPEL Process Analytics can automatically alert a business analyst of the situation, and it can invoke a Web service to take action. The Web service might increase the APR to maximize profits on a loan that has become particularly popular.
The typical steps for using Oracle BPEL Process Analytics for monitoring and analyzing business activities are as follows:
Identify related Oracle BPEL Process Manager processes.
Capture events from the processes using sensors.
Correlate related event instances.
Analyze data.
Display analysis.
Respond to exceptions.
A business process can consist of one or more Oracle BPEL Process Manager processes. The Oracle BPEL Process Manager sensor framework allows users to capture important events within an Oracle BPEL Process Manager process using sensors. Oracle BPEL Process Analytics allows users to capture these events, correlate them and perform analysis on them. The administrator can configure the dashboards to view the analysis, monitor exception conditions, and take automated corrective action on exception conditions.
The following topics provide an overview of each of the steps involved in monitoring and analyzing business processes:
Information about the interfaces used to perform these steps is provided in "Oracle BPEL Process Analytics User Interfaces".
Identify a set of related business processes that need to be monitored as a single entity. One or more Oracle BPEL Process Manager processes are implemented to perform a business activity.
The Oracle BPEL Process Manager sensor framework allows the capture of important events that occur during the lifetime of a Oracle BPEL Process Manager process. Use JDeveloper BPEL Designer to define the sensors on the Oracle BPEL Process Manager process. The output of these sensors is captured as events in Oracle BPEL Process Analytics.
To perform meaningful analysis on the events captured, related event instances must be grouped together. To determine the average amount of time it takes to process a given loan application, for example, each instance of a loan request submission must be linked to its associated acceptance or rejection event.
Composite Events and Groups
Making links between events is referred to as correlating the events. Events that are grouped together in this manner are referred to as composite events.
A composite event can include one or more events, from one event source only. Events are correlated on the basis of a common event attribute (referred to as a correlation attribute), as shown in Figure 1-2.
A composite event group is a collection of composite events. Each composite event in a composite event group can be associated with a different event source. In a composite event group, events are also correlated on the basis of a common event attribute.
Table 1-1 presents an example of a composite event for each of the event sources that Oracle BPEL Process Analytics supports.
Table 1-1 Examples of Composite Events for Each Supported Event Type
Once the events are captured and grouped into composite events, they can be configured for analysis. The grouping and configuration process is referred to as modeling. Oracle BPEL Process Analytics provides wizards to help you create and model composite events into three key objects for analysis: metrics, key performance indicators (KPIs), and dimensions.
A metric is an event attribute value, or a calculation on a set of event attribute values contained within a single composite event instance. The calculation can include addition, subtraction, multiplication, and division.
Using the loan flow process described in "Sample Scenario Using Oracle BPEL Process Analytics", the following metrics might be defined:
The annual percentage rate (APR) of a single instance of a loan offer
The loan request processing time
A business analyst might find a metric useful for monitoring Oracle BPEL Process Analytics event instances to identify the pattern of critical business conditions over time. For example, a business analyst could see if there is a pattern to the rate at which approvals are taking relative to the day of the week or the season.
Briefly, a key performance indicator (KPI) consists of instances of a composite event attribute (or attributes) aggregated over a period of time, to which a mathematical function is applied. While metrics can be used to study general patterns and trends, KPIs enable an analyst to perform in-depth analysis of the event data.
Using the loan flow process described in "Sample Scenario Using Oracle BPEL Process Analytics", the following KPIs might be defined:
The total number of loans requested
The total number of loans approved
The average loan approval time (the average of the loan request time stamp minus the loan request approved time stamp for each of the loans requested)
For a complete discussion of KPIs, see Oracle BPEL Process Analytics User's Guide.
Dimensions are optional constructs that the Oracle BPEL Process Analytics administrator can specify and use in a composite event definition to allow KPI values to be filtered by dimensions. A time dimension is defined by default.
For example, suppose the Oracle BPEL Process Analytics administrator defines and specifies loan provider and car model dimensions and defines a composite event using those dimensions. If a KPI is defined on that composite event, to track the number of loans approved, then a car loan processing manager can monitor the number of loans approved based on time, loan provider, and car model. Similarly, if a regional sales manager is interested in sales only in a given region, then the administrator can define a KPI on a composite event with a region dimension. When viewing the KPI, the regional sales manager can constrain the results to just the region of interest.
See Figure 1-3 and Figure 1-4 for two examples of how the types of KPIs described in this section can be presented to the business analyst, in a section of the Oracle BPEL Process Analytics Console called the Dashboard.
Once an Oracle BPEL Process Analytics administrator models the data, that administrator can specify how that data is presented in the Oracle BPEL Process Analytics Dashboard. The Dashboard is the section of the Oracle BPEL Process Analytics Console for end users, typically business analysts. Modeled data can be presented in a variety of charts and tables to provide information about business activity, such as the following:
A pie chart, such as shown in Figure 1-3, can show what percentage of loan requests were made, by car make and model, today.
A bar graph, such as shown in Figure 1-4, can show the number of actual loan requests compared to budgeted values (also known as target values) for several days.
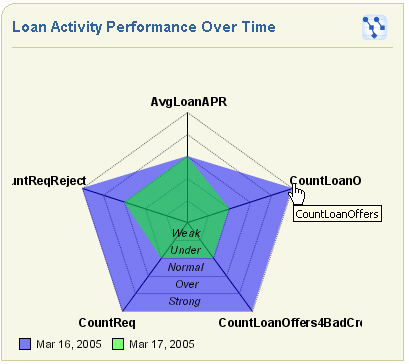
A radar chart, such as shown in Figure 1-5, can show how the number of loan requests and loan offers, and so on, are tracking against target values.
Note that some labels within a radar chart can be truncated. In this Figure 1-5, CountLoanOffers is truncated to CountLoanO and CountRecReject is truncated to untReqReject, and CountLoanOffers4BadCredit is truncated to CountLoanOffers4BadCr. Figure 1-5 shows that when the mouse is placed over a truncated label, a pop-up window displays the full name.
The Real-Time Viewer, such as shown in Figure 1-6, presents events within a composite event instance as they occur in real time.
These are just a few of the charts that can be used to present business data. For more information about the types of charts that can be presented and how to read them, see Oracle BPEL Process Analytics User's Guide.
Figure 1-5 Sample Radar Chart to Track Performance Against Target Values

The point of capturing and modeling events is to enable a business analyst to identify and respond to critical business conditions. This is accomplished using one or all of the following methods:
The business analyst can review the real-time data as it is presented in the Dashboard, and monitor it for critical business conditions
For example, a business analyst might review the prediction for a KPI, such as shown in Figure 1-7. This detail uses statistical analysis to predict a KPI value. By viewing this detail, the business analyst can either anticipate problems and take corrective action before problems arise, or can anticipate positive results and investigate the circumstances so that the positive results can be sustained.
A business analyst could also review the cause and effect table for a given KPI, such as shown in Figure 1-8. This table presents the KPIs which influence (cause) or are influenced by (effect) a given KPI. By examining these KPIs, the business analyst can further determine what might be causing a critical business condition.
For a complete description of the KPI Prediction table and the KPI Cause/Effect table, see Oracle BPEL Process Analytics User's Guide.
An administrator can set up notifications, called explicit alerts, that are sent to the business analyst if a KPI or metric exceeds a predetermined threshold value.
An explicit alert can be sent as an e-mail message, a phone message, a fax, a Short Message Service (SMS) message, a pager message, or as an Internet instant message.
For a complete description of alerts and how they are defined, see Oracle BPEL Process Analytics User's Guide.
If the administrator configures it into the Dashboard, the user can review the Alert View table, such as shown in Figure 1-9, that lists explicit alerts.
The Dashboard user can click a link in the alert table to get detailed information about that alert.
For a complete description of alert tables, see Oracle BPEL Process Analytics User's Guide.
After a critical business condition is identified, it can be addressed manually or programmatically, as follows:
Programmatically
For events that trigger explicit alerts, a Web service can be configured such that it is called to respond to the condition that caused the alert to be triggered. In the case of the loan flow process, for example, an alert could be defined such that a Web service is called to decrease the APR for car loans if the target number of car loans was not accepted for the preceding month. See Oracle BPEL Process Analytics User's Guide for more information about using Web services.
Manually
The business analyst can use the variety of charts and graphs within the Dashboard to help determine the cause of, or anticipate, a problem and take action manually.
Upon receiving an explicit alert through an e-mail message, a phone message, or whatever method is used for explicit alert delivery, the recipient can take appropriate action.
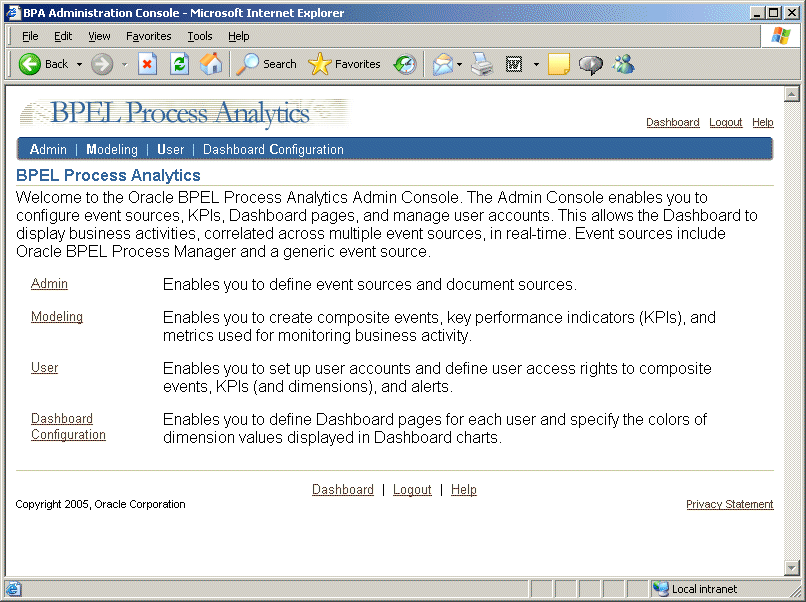
Oracle BPEL Process Analytics provides a Console that is divided into three main sections: an Admin Console, a Dashboard Configuration Console, and a Dashboard. Access to these sections of the Console is governed by the privileges of the account holder.
In addition, the Oracle Enterprise Manager Application Server Control Console enables a system administrator to configure, start, and stop Oracle BPEL Process Analytics, and set Oracle BPEL Process Analytics properties. See Oracle BPEL Process Analytics User's Guide for more information.
The following topics provide a brief introduction to the parts of the Oracle BPEL Process Analytics Console:
The Admin Console, accessible by accounts granted the Oracle BPEL Process Analytics Admin User privilege, provides wizards and other tools that enable an administrator to:
Specify connection parameters for the sources from which events will be captured
Create composite events.
Model KPIs and metrics
Set up alerts to send a notification to one or more users to inform them that critical measurements are not meeting expectations
Configure data for presentation to end users in the Dashboard
Create user accounts and grant them privileges to view the event source data
See Oracle BPEL Process Analytics User's Guide for more information about the tasks the administrator performs using the Admin Console.
Figure 1-10 Oracle BPEL Process Analytics Admin Console Welcome Page

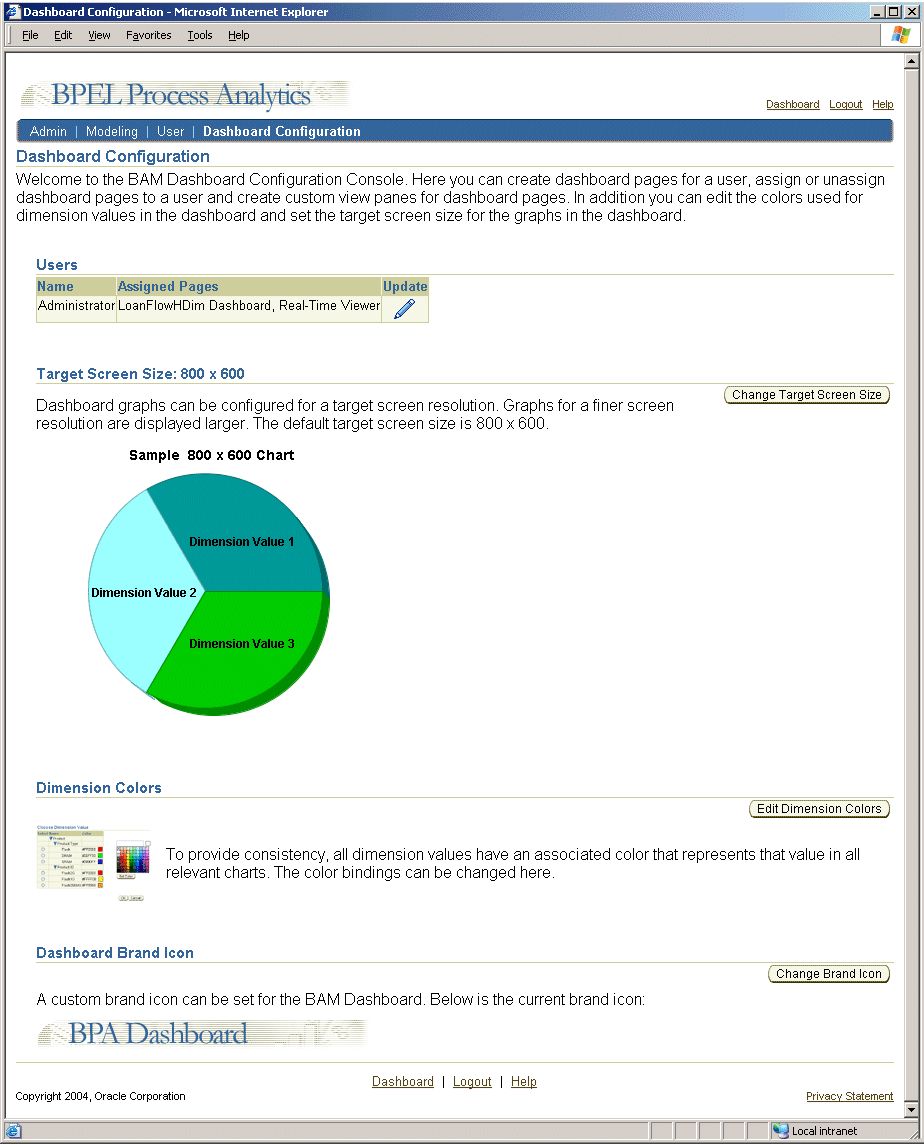
The Dashboard Configuration Console provides wizards that enable a user with Oracle BPEL Process Analytics admin privileges to specify how data modeled using the Admin Console should be displayed in the Dashboard. Tasks accomplished through the Dashboard Configuration Console include:
Specifying the types of charts and tables to present to Dashboard users
Creating Dashboard pages and specifying their layout
Granting users access to Dashboard pages
Figure 1-11 shows a sample page in the Dashboard Configuration Console. See Oracle BPEL Process Analytics User's Guide for a detailed description of the tasks the administrator performs using the Dashboard Configuration Console.
Figure 1-11 Sample Dashboard Configuration Console Page

The Dashboard is the interface through which Oracle BPEL Process Analytics end users view and analyze modeled data. These users are typically business analysts or high-level business managers.
Using the Dashboard, a user views the data collected by Oracle BPEL Process Analytics and modeled by the administrator. The Dashboard interface presents the events and performance measurements, in real time, within tables and charts, for the business analyst to assess.
Figure 1-12 shows a sample Dashboard page. See Oracle BPEL Process Analytics User's Guide for a detailed description of the tasks the business administrator performs using the Dashboard.