| Oracle® Enterprise Manager Grid Control Quick Start Guide 10g Release 2 (10.2) Part Number B28678-03 |
|
|
PDF · Mobi · ePub |
| Oracle® Enterprise Manager Grid Control Quick Start Guide 10g Release 2 (10.2) Part Number B28678-03 |
|
|
PDF · Mobi · ePub |
Enterprise Manager Grid Control comes with a comprehensive set of performance and health metrics that enables automated monitoring of key components in your environment, such as applications, application servers, databases, as well as the back-end components on which they rely (hosts, operating systems, storage, and so on).
When a metric reaches the predefined warning or critical threshold, Enterprise Manager generates an alert, which shows up in the monitoring pages, as well as in the notifications that you define. In this way, you can monitor services, systems, groups, and any other target that you want to manage.
This chapter covers system monitoring in the following sections:
Oracle Enterprise Manager provides predefined metric thresholds. While these values are acceptable for most monitoring conditions, your environment may require that you customize threshold values to more accurately reflect the operational norms of your environment. Setting accurate threshold values, however, may be based on rate or throughput for certain categories of metrics, such as performance metrics.
You can use monitoring templates, metric snapshots, and metric baselines to customize your metric threshold values to best reflect the health of the environment.
Linda is a manager in charge of a team of DBAs and System Administrators who maintain the system environment. Like many organizations, Linda maintains different environments, such as test and production. Linda would like to set up different monitoring levels for each of these environments. For Linda, the test environment is much easier to monitor because it does not use production systems.
Using Enterprise Manager's customizable monitoring features, Linda is able to use ready-to-use monitoring settings for her test environment, and set up custom thresholds for a standard set of metrics for her testing and production environments. Linda can also use her existing scripts, or user-defined metrics, to monitor her environments.
This section describes how to use Enterprise Manager to set up ready-to-use monitoring, use monitoring templates, understand metrics and thresholds, set up corrective actions, and establish user-defined metrics.
Enterprise Manager's Management Agents automatically start monitoring their host systems as soon as they are deployed. Enterprise Manager provides auto-discovery scripts that enable these Agents to automatically discover all Oracle components and start monitoring them using a comprehensive set of metrics at Oracle-recommended thresholds. Thus, network components are monitored out-of-the-box. This monitoring functionality includes other components of the Oracle ecosystem such as NetApp Filer, BIG-IP load balancers, Checkpoint Firewall, and IBM WebSphere and BEA WebLogic application servers. Metrics from all monitored components are stored and aggregated in the Management Repository, providing administrators with an extensive source of diagnostic information and trend analysis data. When thresholds are violated, notifications are sent to administrators for rapid resolution.
Monitoring templates simplify the task of standardizing monitoring settings across sets of systems by allowing you to specify the monitoring settings and policies once, and then apply them to your monitored targets. This makes it easy for you to apply standard monitoring settings to specific classes of targets consistently, throughout your enterprise.
For example, Linda can define one monitoring template for quality assurance databases and another monitoring template for production databases.
To create a monitoring template:
Click Setup in the Grid Control console.
Select Monitoring Templates from the panel to the left.
The Monitoring Templates page appears. Existing monitoring templates are listed on the page. You can apply, view, edit, or delete these templates. You can also create a fresh template or one that is based on an existing template.
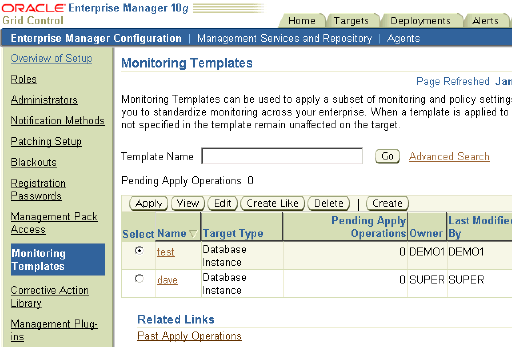
Click Create to create a new template.
This brings up a wizard where you can specify details such as the target on which to apply the template, select metric thresholds and policies, and also modify them, if need be.
Click Continue.
Click OK.
The new monitoring template appears in the list on the Monitoring Templates page. Having created a monitoring template for a database, Linda can select it and apply it as it is to other databases or after tweaking it suitably.
For another example of how to use monitoring templates, see "Applying Policies Consistently Across Targets".
A metric snapshot is a named collection of target performance metrics that have been collected at a specific point in time. A metric snapshot can be used as an aid in calculating metric threshold values based on the target's past performance.
For example, Linda can create a metric snapshot for a target when she notices that its performance varies significantly from day to day and set thresholds accordingly, so that appropriate notifications can be generated.
From any target home page such as the Host home page or the Oracle Database home page, click Metric and Policy Settings.
In the Metric and Policy Settings page that appears, click Metric Snapshots under Metric Thresholds Links.
The Metric Snapshots page appears, listing snapshots, if any have been created for the target. You can select a snapshot and view it, edit it, copy thresholds from it, or delete it. You can also create a new snapshot from this page.
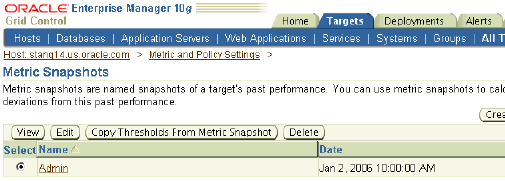
Click Create.
The Create Metric Snapshot page appears. On this page, you can specify a date on which performance was acceptable for the target. The metric data of this date will be used to calculate thresholds.
Other values that you may specify are:
Hour of Day: the metric snapshot value is calculated as the average value over the hour preceding the hour you specify here.
Warning Percentage: the percentage to be used as the metric Low threshold value.
Critical Percentage: the percentage to be used as the metric High threshold value.
Click Go.
The values are populated in the Metric data table. You can select some or all of the metrics, modify their values, adjust threshold values, change the date, and so on, until you get a snapshot that you want to save.
Click OK.
The metric snapshot is saved and listed in the Metric Snapshots page. Linda can see such a snapshot and set threshold values for various metrics accordingly. Notifications can be sent out based on this.
Metric baselines are statistical characterizations of system performance over well-defined time periods. Metric baselines can be used with databases or services to implement adaptive alert thresholds for certain performance metrics as well as provide normalized views of system performance. Adaptive alert thresholds are used to detect unusual performance events. Baseline normalized views of metric behavior help administrators explain and understand such events.
For example, Linda notices that her database I/O runs at X% in the morning and X+5% from 10 a.m. to 2 p.m. Traditional thresholds would have to stay at X+5% and would not catch the lower behavior in the morning. She can set up a static metric baseline for this.
To create a static metric baseline:
From the Targets page, click either Databases or Services.
Select an operating 10.2 database or service.
Click Metric Baselines under Related Links.
The Metric Baselines page appears. It offers you options to select an active baseline, disable metric baselines, and register metrics. This page also provides you links to pages that enable you to view baseline normalized metrics, and create a new static metric baseline or manage existing baselines. Enterprise Manager provides charts that graphically display the values of observed performance and workload metrics normalized against the baseline. Using these charts, statistically significant values are easily seen as blips in the charts. These charts allow administrators to easily perform time-correlation of events. For example, performance events can be related to significantly increased demand or significantly unusual workload.
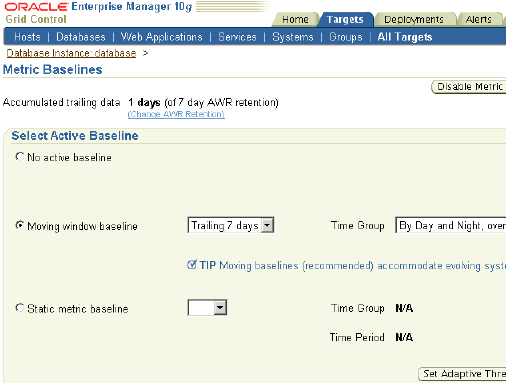
Select the Static metric baseline option.
Click Manage Static Metric Baselines under Related Links.
Click Create on the page that appears.
The Create Static Metric Baseline page appears.
Specify a name, a time period and grouping, and click OK.
The static metric baseline created appears listed in the Metric Baselines page. Linda can then set up adaptive alert thresholds for certain performance metrics as well as view baseline normalized metrics.
User-defined metrics allow you to extend the reach of Enterprise Manager's monitoring to conditions specific to particular host or database environments through custom scripts or SQL queries and function calls. You can continue to use even legacy custom scripts after deploying Enterprise Manager.
For example, Linda might have a Perl script that she wants to use to monitor a specific condition. She can associate this script with a user-defined metric, which will then work like any other metric.
To set up user-defined metrics:
In the Related Links section of any Host or Database target homepage, click User-Defined Metrics.
The User-Defined Metrics summary page appears displaying a list of existing user-defined metrics. From this page, you can edit, view, or delete user-defined metrics. You can also create a new metric afresh or one based on existing metrics.
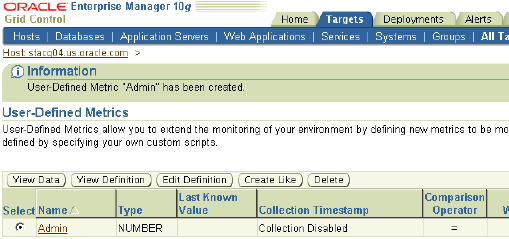
Click Create.
The Create User-Defined Metric page appears. On this page, you can specify a SQL command or a custom script for this metric. The script must contain code to check the status of the monitored object, to evaluate the results, and to return script results to Enterprise Manager. You can set thresholds against which to compare the value returned by your script so that alerts and notifications may be sent accordingly. You can also specify a schedule for the metric to start collecting data.
Click OK.
The User-Defined Metric summary page appears with the new user-defined metric appended to the list.
Similarly, Linda can create metrics from her library of custom monitoring scripts and thereby optimize the monitoring features of Enterprise Manager. Likewise, she can easily integrate existing SQL queries or function calls currently used to monitor database conditions into Enterprise Manager's monitoring framework.
When a metric threshold value is exceeded, an alert is generated. An alert indicates that either a warning or critical threshold for a monitored metric has been exceeded. An alert also includes information such as the name of the target, the threshold violated, and so on.
When an alert is generated, you can have notifications sent to the appropriate administrators. Enterprise Manager supports notifications through e-mail (including e-mail-to-page systems), SNMP traps, or by running custom scripts. You can also define automatic response actions for particular alerts by setting up corrective actions.
When bringing down a target for maintenance, you can use the Blackout feature to avoid alerts on those targets.
As a super administrator, Linda would like to keep members in her team notified about various thresholds for the health of various targets. Instead of sending out these notifications manually, she can set up notification rules so that the DBAs on her team receive appropriate alerts. She can then set up a corresponding notification method to notify system administrators for critical alerts and identify which targets need to be assigned notification methods for passing alert information to third-party tools, like HP OpenView.
For example, all test system alerts should be sent to the DBA owners. If any production systems go down, then those alerts also need to be sent to the system administrators who use a third-party tool that is tied to their ticketing system.
There are certain alerts that are fairly simple to fix with a predefined corrective action. For instance, when a listener goes down, Linda can run a script to bring it back up. By using corrective actions, she can set up automated responses to particular alerts, thus reducing the time it takes to respond to down targets or poor performance.
Linda also knows that her team brings down the testing databases at midnight on the last Friday of every month for maintenance. Linda can set up blackout periods to correspond with this planned down-time so that erroneous alerts are not triggered for these down targets.
This section describes in detail how to use Enterprise Manager to set up custom notifications and define corrective actions.
Enterprise Manager supports various notification mechanisms through notification methods. The notifications mechanisms can also be integrated with third-party system tools, systems, and applications that typically constitute the management framework of an enterprise. A notification method is used to specify the particulars associated with a specific notification mechanism, for example, which SMTP gateway(s) to use for e-mail, which OS script to run to log trouble-tickets, and so on. Super Administrators perform a one-time setup of the various types of notification methods available for use. Once these are defined, other administrators can create notification rules that specify the set of criteria that determines when a notification should be sent and how it should be sent. The criteria defined in notification rules include the targets, metrics, and severity states (clear, warning, or critical) and the notification method that should be used when an alert occurs that matches the criteria.
For example, Linda can define a notification rule that specifies that e-mail should be sent to her when CPU utilization on any host target is at critical severity, or another notification rule that creates a trouble-ticket through OpenView or Tivoli when any database is down.
To create a notification rule:
Click Preferences in the Grid Control console.
Click Rules under Notification in the panel to the left.
The Notification Rules page appears. Enterprise Manager Grid Control provides Oracle-recommended ready-to-use SYSMAN rules. These as well as any existing notification rules are listed on this page. From this page, you can edit, view, or delete notification rules, create a new rule, create a rule based on an existing one, or assign methods to multiple selected rules.
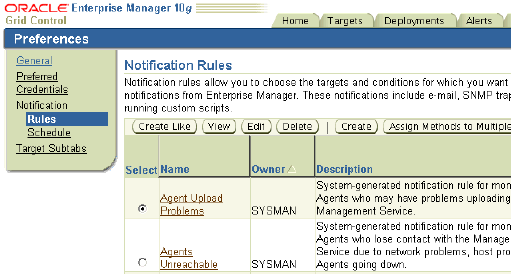
Click Create.
The Create Notification Rule page appears. On this page, you can specify a target type on which to apply the rule, the availability states and jobs for which you want to receive notifications, the metrics and policies to be associated with the rule, and the notification method for the rule.
If advanced notification methods, such as SNMP traps, custom scripts, or PL/SQL procedures, have been defined in the Scripts and SNMP Traps section on the Notification Methods page, they appear here and can be selected.
If you want other administrators to be able to use this rule, select the Make Public checkbox.
Click OK.
The new notification rule is included in the list on the Notification Rules page. Once Linda defines such a rule, she can make it public, so that other administrators can see it and use it if they want to. Alternatively, Linda can also assign notification rules to other administrators such that they receive notifications for alerts as defined in the rule.
Corrective actions allow you to specify automated responses to alerts. Corrective actions ensure that routine responses to alerts are automatically executed, thereby saving administrator time and ensuring that problems are dealt with before they noticeably impact users. For example, if Enterprise Manager detects that a component, such as the SQL*Net listener, is down, a corrective action can be specified to automatically start it back up. A corrective action is thus any task that you specify that will be executed when a metric triggers a warning or critical alert severity. By default, the corrective action runs on the target on which the alert is triggered. Administrators can also receive notifications for the success or failure of corrective actions.
Linda finds that conditions triggering some alerts and policy violations can be remedied without manual intervention. She can associate corrective actions to such alerts.
To set up a corrective action:
1n the Related Links section of a target home page, click Metric and Policy Settings.
The Metric and Policy Settings page appears. It has two tabs: Metric Thresholds and Policies. The Metric Thresholds page lists metrics associated with the target whereas the Policies page lists the policies associated with the target. You can add a corrective action for a metric from the Metric Thresholds page and for a policy from the Policies page.
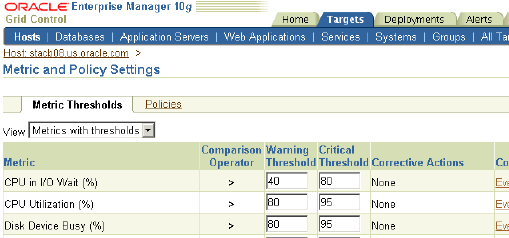
Click the pencil icon for a specific metric or a policy to edit it.
The Edit Advanced Settings page appears for a metric. The Edit Policy Rule Settings page appears for a policy.
In the Corrective Actions section on either of these pages, click Add.
For a metric, if you click Add next to Warning, the corrective action is set for Warning, but not Critical, alerts on the metric.
On the Add Corrective Action page, select the task type and click Continue. The task type helps you specify if you want to create a new corrective action, reuse one already defined on this target, or apply one from your library.
The Create Corrective Action page appears. On this page, you can specify the parameters that you want to associate with the corrective action. You can also specify specific credentials to be applied to each target when the corrective action runs.
Click Continue.
The corrective action is created and set for the selected metric or policy. This frees up valuable time that Linda can spend on other administrative tasks.
Oracle By Example (OBE) has a series on the Oracle Enterprise Manager Grid Control Quick Start Guide.
The System Monitoring OBE covers the tasks in this chapter with annotated screen shots. It is located at http://www.oracle.com/technology/obe/obe10gEMR2/Quick_Start/enterprise_manager_configuration/enterprise_configuration_and_policies.htm