| Oracle® Enterprise Manager Grid Control Quick Start Guide 10g Release 2 (10.2) Part Number B28678-03 |
|
|
PDF · Mobi · ePub |
| Oracle® Enterprise Manager Grid Control Quick Start Guide 10g Release 2 (10.2) Part Number B28678-03 |
|
|
PDF · Mobi · ePub |
In an enterprise, a service is an entity that provides a useful function to the end-users, for example, e-mail, ERP, CRM applications, online banking, online store, online stock trading, and so on. Typically, when any of these services is being used, some common issues faced by users are the availability of a service, completion of critical activities, and performance of the service. You can solve these issues by defining one or more service models that represent the business functions or applications that run in your enterprise. Monitoring a service helps you ensure that your operational goals and Service-Level Agreements (SLAs) are met.
The critical and complex nature of today's business applications has made it very important for IT organizations to monitor and manage application service levels at high standards of availability. Because these services form an important type of business delivery, monitoring these services and quickly correcting problems before they can have a detrimental impact on business operations is crucial in any enterprise. Enterprise Manager Grid Control provides a comprehensive service modeling and monitoring solution that helps you effectively manage services from the overview level down to the individual component level.
This chapter covers service management in the following sections:
A system is a logical grouping of targets that collectively host one or more services. The targets within a system can have relationships or associations with each other. A system can support one or more services.In Enterprise Manager Grid Control, systems constitute a target type. For example, to monitor an e-mail application in Enterprise Manager, you would first create a system, such as Mail System, that consists of the database, listener, application server, and host targets on which the e-mail application runs. You would then create a service target to represent the e-mail application and specify that it runs on the Mail System target.
Linda needs to understand all the components (technology stack) of the application service and their respective relationships in order to maintain SLAs. She can do this by creating systems and associating services with them.
Enterprise Manager systems enable administrators to logically organize distributed targets for efficient and effective management and monitoring.
This topic presents the procedure that Linda can use to create systems and efficiently work with services by associating them with systems.
To create a system:
From the Targets page, select the Systems secondary tab.
Click Add.
The Create System wizard appears.
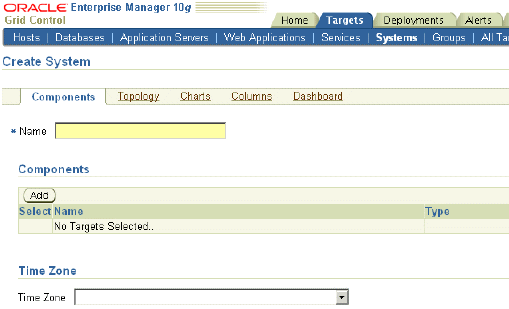
Specify a time zone and components for the system, the associations between the components, the charts that you want displayed, the columns of data, and the format in which it will be displayed on the dashboard.
Click OK.
The Systems page appears. The list of systems includes the system you just created. You can click the name of the system to bring up its home page. You can see the dashboard of the system by clicking Launch Dashboard.
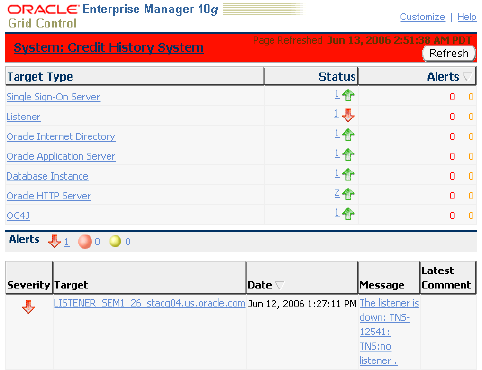
Linda can similarly create systems for all the environments that she needs to work on.
Grid Control lets you define one or more services that represent the business functions or applications that run in your enterprise. Some examples of services include CRM applications, online banking, and e-mail services. Some simpler forms of services are business functions that are supported by protocols such as DNS, LDAP, POP, or SMTP.
Some types of service models that you can define are: Generic Service, Web Application, and Aggregate Service. A Generic Service is the simple service model you can create in Enterprise Manager. You can define one or more service models by defining service tests that represent a critical business function. An Aggregate Service is a service combined logically with one or more other services. The availability, performance, and usage of an Aggregate Service are determined by the availability, performance, and usage of its constituent services. A Web application is a special type of service that models a Web-based application or a Web site. A Web application target consolidates all the components of your Web application and determines the availability, performance and usage of the application. You can also monitor these services. SLAs are used to evaluate service availability, performance, and usage. By constantly monitoring the service levels, IT organizations can identify problems and their potential impact, diagnose root causes of service failure, and fix these in compliance with the SLAs. Monitoring a service helps you ensure that your operational goals and SLAs are met.
Some of the concepts that you need to understand while working with services are discussed here.
Availability: The availability of a service is a measure of the end users' ability to access the service at a given point in time, and might differ from service to service. Availability is based on the successful execution of service tests. The availability of a service can also be based on the underlying system that hosts the service. The service is considered available as long as all or at least a single transaction from the key beacon finishes.
Service Tests: A service can have one or more tests associated with it. These tests are used to monitor the service remotely. Transactions are service tests that are used to test the Web application performance and availability. Important business activities for the Web application are recorded as transactions, which are used to test availability and performance of a Web application. A transaction is considered available if it can be successfully executed by at least one beacon.
A list of some service tests and what they determine follows:
DNS - Availability and performance of a DNS (domain name system) service
Custom Script - Availability and performance of a service by using a custom script or executable
FTP - Availability and performance of an FTP (File Transfer Protocol) service
Web Transaction - Availability and performance of a Web application
HTTP Ping - Availability and performance of a Web URL
Host Ping - Responsiveness of a network host through ICMP (Internet Control Message Protocol)
IMAP - Availability and performance of an IMAP (Internet Message Access Protocol) service
DB SQL Timing - Availability and performance of a JDBC (Java Database Connectivity) connection to a database
LDAP - Availability and performance of an LDAP (Lightweight Directory Access Protocol) service
NNTP - Availability and performance of an NNTP (Network News Transfer Protocol) newsgroup service
Oracle SQL Timing - Availability and performance of a connection to an Oracle database
POP - Availability and performance of a POP (Post Office Protocol) service
Port Checker - Ability of a network client to make connections to a set of ports on a given host
SMTP - Availability and performance of an SMTP (Simple Mail Transfer Protocol) service
TNS Ping - Responsiveness of a database through the TNS (Transparent Network Substrate) protocol
SOAP - Availability and response time of a Web service
Performance and Usage Metrics: You can define metrics to measure the performance and usage of the service. Performance indicates the response time of the service as experienced by the end user. Usage metrics are based on the user demand or load on the system. Performance metrics are collected for service tests when the service tests are run by beacons. A beacon is a function within the Management Agent that executes tests at regular intervals. You can calculate the minimum, maximum, and average response data collected by two or more beacons. You can also collect performance metrics for system components, and then calculate the minimum, maximum, and average values across all components. Usage metrics are collected based on the usage of the system components on which the service is hosted. You can monitor the usage of a specific component or statistically calculate the minimum, maximum, and average values from a set of components. You can also set thresholds on these metrics and receive notifications and alerts.
Service-Level Agreements (SLAs): Service-level parameters are used to measure the quality of the service. These parameters are usually based on actual SLAs or on operational objectives. The Service-Level Management feature enables you to monitor your enterprise against your SLAs to verify that you are meeting your needs for availability and performance within the business hours of the service. For SLAs, you may want to specify the levels according to operational or contractual objectives. By monitoring against service levels, you can ensure the quality and compliance of your business processes and applications.
Though Linda is a DBA manager, her team is responsible for meeting their application's Service Level Agreement (SLA). Her SLA covers application availability and performance from four major development centers. She wants to define a service model and monitor these business applications from within Grid Control. Before she can do that, she must define a system (the tech stack that supports the service) and then define its availability, performance and usage parameters, and service-level rules.
You can define a service by creating one or more service tests that simulate common end-user functionality. Using these service tests, you can measure the performance and availability of critical business functions, receive alerts when there is a problem, identify common issues, and diagnose causes of failures. This topic describes the procedure that Linda can follow to define and monitor a service.
A service, like other targets, is discovered when you install the Oracle Agent software on the host where it is resides.
To manually define a service:
From the Targets page, select the Services secondary tab.
If your service is not listed on the page, select the type of service from the Add list and click Go.
The relevant wizard appears. For example, if you select the Generic Service type, the Create Generic Service wizard appears.
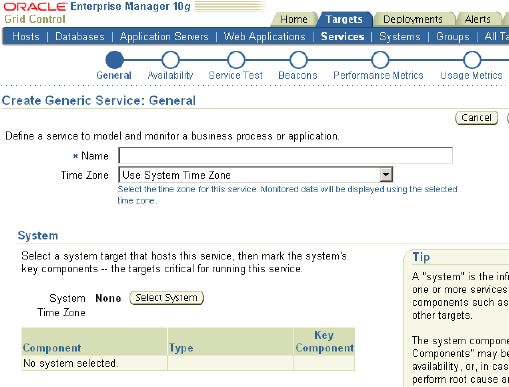
On the General page, specify the time zone and a name for the service.
If you would like to associate an existing system with this service, click Select System. If you have not yet defined the system, you will need to create it before associating it with the service. Associating a system with a service is not mandatory, but it is recommended. Features like Root Cause Analysis depend on key system components being correctly defined.
On the Availability page, specify the availability type for the service.
On the Service Test page, select a service test to monitor the availability of this service.
Based on the test type you select, you need to specify relevant test parameters. A service can have one or more tests associated with it. These tests are used to monitor the service remotely, and to determine the availability and performance of the service. There are various protocols you can use while defining a service test.
On the Beacons page, add beacon locations from which the service will be monitored, and designate at least one beacon as key.
A service is considered available if the test executes successfully on at least one key beacon. Beacons marked as key are used to determine the availability of the service.
On the Performance Metrics page, specify if you want to define metrics based on the service test or on the system, and then define the metrics that will be used to measure the performance of your service.
Performance metrics help you assess the performance of the service for each of the remote beacons. In general, the local beacon should have a very efficient and consistent response time because it is local to the Web application host. Remote beacons provide data to reflect the response time experienced by the end users of your application.
On the Usage Metrics page, define usage metrics based on the metrics of one or more system components. Usage metrics can be defined only for services that are associated with a system.
Review your selections and click Finish.
Linda may define other kinds of services similarly.
A service level is a measure of service quality and is defined as the percentage of time during business hours that a service meets specified availability and performance criteria. It is defined by a service-level rule, which is created automatically for every service.
This topic describes the procedure that Linda can follow to edit a service-level rule that has been automatically defined for a service that she has created.
To edit a service-level rule:
From the Targets page, select the Services secondary tab.
Select the service for which you want to edit the service-level rule.
In the service home page, click Edit Service Level Rule in the Related Links section.
The Edit Service Level Rule page appears. Default values are used for some rule parameters. However, you must edit the service-level rule for each service to accurately define the assessment criteria that are appropriate for your service.
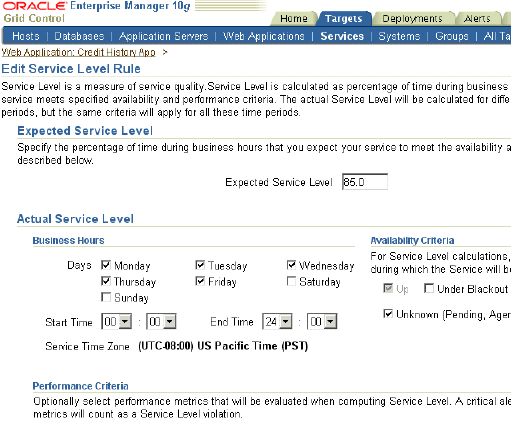
Specify the percentage of time during business hours that you expect your service to meet the availability and performance criteria.
By default, a service is expected to meet the specified criteria 85% of the time during defined business hours.
Specify the following parameters for the actual service level:
Business Hours: Times during which the service must function without availability or performance issues.
Availability Criteria: Availability states for which the service is considered up. You can choose Under Blackout or Unknown as factors not impacting service availability. Selecting Under Blackout enables you to specify service blackout time (planned activity that renders the service as technically unavailable) as available service time. Selecting Unknown enables you to specify the time for which a service is unmonitored because the Management Agent is unavailable.
Performance Criteria: Performance metrics affecting the service level. The service level is affected when a critical alert is triggered for the specified performance metric.
Click OK.
Monitoring a service helps you ensure that your operational goals and SLAs are met. By analyzing data on response time recorded when users access your Web application service, you can track end-user experience across all the URLs within a Web application and locate performance bottlenecks that directly affect your end users. To monitor a service, you need to define service tests that simulate activity or functionality that is commonly accessed by end users of the service, designate the geographical locations from which these service tests will be executed, run the service tests on Enterprise Manager beacons, and then analyze results using a variety of monitoring mechanisms. Some of these are briefly discussed in the following paragraphs.
Using the services dashboard, administrators can determine whether service levels are compliant with business expectations and goals. The services dashboard enables administrators to browse through all service-level information from a central location. An enterprise might want to put all their services into a single dashboard so that it is easy to interpret the status. The dashboard illustrates the availability status of each service, performance and usage data, as well as service-level statistics. You can easily drill down to the root cause of the problem or determine the impact of a failed component on the service itself.

Services can be very complex. Having a service topology view can make it easier to view the dependencies between the services and their components. Upon service failure, the potential causes of failure, as identified by Root Cause Analysis, are highlighted in the topology view. In the topology viewer, you can view dependent relationships between services and systems. A service topology is most valuable against an aggregate service.
Enterprise Manager provides ready-to-use reports that are useful for monitoring services and Web applications. You can also set the publishing options for reports so that they are sent out through e-mail at a specified period of time. Some of the reports that can be generated include Web Application Alerts, Web Application Transaction Performance Details, and Service Status Summary.
Using Grid Control, you can monitor a service and resolve problems before users are impacted. Each service definition has performance and usage metrics that have corresponding critical and warning thresholds. When a threshold is reached, Grid Control displays an alert. There is a standard set of notification rules that specifies the alert conditions for which notifications should be sent to the appropriate administrators. Apart from these standard sets of rules, you can define and set up schedules so that administrators are notified when the specified alert conditions are met.
Grid Control offers you several tools to help diagnose service problems and determine the potential causes. The Root Cause Analysis (RCA) feature in Grid Control provides you with the ability to analyze service failures by filtering the availability, performance, and configuration data of the system components used by the affected service. This helps you eliminate problems that may appear to be causes of the service failure, but that are only side effects or symptoms of the actual root cause of the problem.
You can also access the RCA information from the topology viewer, which shows a graphical representation of the hierarchical levels displaying relationships between components. Lines between the services and system components represent the associated failure. Comprehensive diagnostic tools enable you to quickly drill down into the Oracle Application Server stack and monitor response times in various application server and database components. RCA automates an otherwise difficult manual task by providing you with the ability to traverse a large, dependent topology and quickly identify problem areas, and notifying you of specific possible causes of service failure.
For Web application services, when the performance is slow, you can trace problematic transactions as required using Interactive Transaction Tracing. You can record the transaction using an intuitive playback recorder that automatically records a series of user actions and navigation paths. You can play back transactions interactively, and perform an in-depth analysis of the response times across all tiers of the Web application for quick diagnosis.
The Interactive Transaction Tracing facility complements the Transaction Performance Monitoring and End-User Performance Monitoring features by helping you diagnose the cause of a performance problem. Once a problem is resolved, you can also run Interactive Transaction Tracing to verify that the problem has been satisfactorily repaired.
The Request Performance Diagnostics feature of Grid Control is instrumental to the application server and back-end problem diagnosis process. It provides in-depth historical details on the J2EE and database performance of all URL requests. By examining the detailed J2EE and database breakdown and analyzing the processing time of a request, you can determine whether the problem lies within a servlet, JSP, EJB method, or specific SQL statement. Using this information, you can easily isolate the cause of the problem and take necessary action to quickly repair the appropriate components of your Web application.
Linda needs to be able to trace a problem with one of her services down to the specific component in the technology stack. She can use RCA to be able to focus on the problem component.
RCA evaluates a key component's availability status to determine whether or not it is a cause of service failure. You can specify additional conditions, or component tests, for RCA to consider. When a service fails, RCA returns a list of potential causes on the service home page. Potential root causes include failed subservices and failed key system components. In this topic, Linda can learn how to perform RCA on a failed service.
To run an RCA:
From the Targets page, select the Services secondary tab.
Select the service on which you want to run the RCA.
The service home page opens.
Click Monitoring Configuration and then Root Cause Analysis Configuration.
If the current mode is set to Manual, click Set Mode Automatic to enable RCA when the state of the service and its components change.
When you initiate RCA manually, RCA does not store the results for you, thus providing no history for later reference.
Click the link in the Component Tests column of the table for the key component you want to test, and add appropriate tests for the components.
After a while, go back to the service home page and look under the Possible Causes of Service Failure heading. If you see an RCA Details link, click it to see the Root Cause Analysis Details page.
Click a message in the Causes of Failure table to display the alert details for the specific cause.
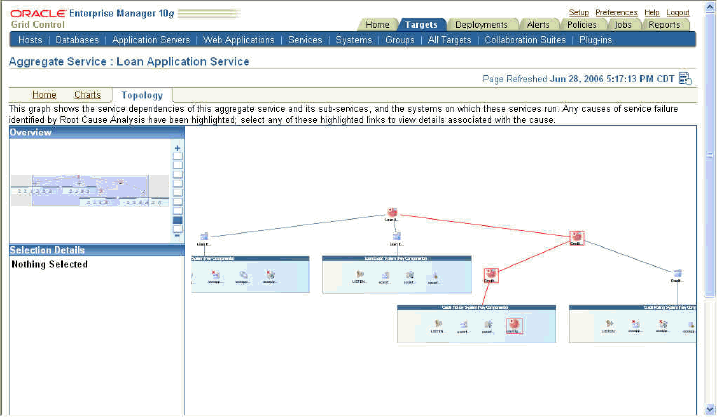
You can also view the RCA feature using the service topology viewer that enables you to see a graphical representation of the service and its relationship to other services, systems and infrastructure components, with the causes identified by RCA highlighted in the display.
Note:
The topology viewer is supported only on Internet Explorer 5.5 and higher on Microsoft Windows, using Adobe SVG Viewer 3.0. Other browsers and Adobe SVG Viewer 6.0 are not supported.Linda can thus use the topology viewer and RCA to isolate the component causing the service to fail.
Oracle By Example (OBE) has a series on the Oracle Enterprise Manager Grid Control Quick Start Guide.
The Service Level Management OBE covers the tasks in this chapter with annotated screen shots. It is located at
http://www.oracle.com/technology/obe/obe10gEMR2/Quick_Start/system_services/system_services.htm