6 Managing Synchronization
The Mobile Server administrator uses the Data Synchronization Manager to manage synchronization tasks. This chapter includes:
-
Section 6.4, "How Do You Encrypt All Databases for the Initial Sync?"
-
Section 6.6, "Browsing the Repository for Synchronization Details"
6.1 How Does the Synchronization Process Work?
The Mobile Server uses synchronization to replicate data between the Mobile clients with their client Oracle Lite databases (including those for Web-to-Go, Win32, Palm, and Windows CE platforms) and the application tables, which are stored on a back-end Oracle database.
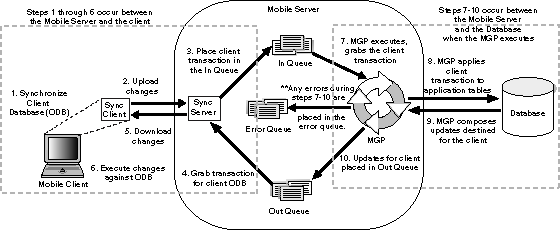
When most people think of synchronizing data, they think of their Palm Pilot. When you hit the synchronization button for the Palm Pilot, any changes are added to the database of information on the Windows machine immediately. This is not the case for Oracle Database Lite, which is used for multiple clients. In order to accomodate multiple users, the application tables on the back-end database cannot be locked by a single user. Thus, the synchronization process involves using queues to manage the information between the Mobile clients and the application tables in the database (demonstrated by Figure 6-1), as follows:
-
User initiates a synchronization from the Mobile client. Note that the Mobile client may be a Windows platform client or a PDA.
-
Mobile client software gathers all of the client changes into a transaction and the Sync Client uploads the transaction to the Sync Server on the Mobile Server.
-
Sync Server places the transaction into the In-Queue.
Note:
When packaging your application, you can specify if the transaction is to be applied at the same time as the synchronization. If you set this option, then the transaction is immediately applied to the application tables. However, note that this may not be scaleable and you should only do this if the application of the transaction immediately is important and you have enough resources to handle the load. -
Sync Server gathers all transactions destined for the Mobile client from the Out-Queue.
-
Sync Server transfers these transactions down to the Sync Client.
-
Mobile client downloads and applies all changes for client Oracle Lite database.
-
All transactions compiled from all Mobile clients are gathered by the MGP out of the In-Queue.
-
The MGP applies all transactions for the Mobile clients to their respective application tables.
-
Any updates destined for any Mobile client is composed into a transaction by the the MGP process.
-
MGP places outgoing transactions for Mobile clients into the Out-Queue, waiting for the next client synchronization for the Sync Server to gather the updates to the client.
As Figure 6-1 demonstrates, synchronization is broken up into two phases: the Mobile client using the Sync Client/Server to upload and download changes and the MGP process interacting with the queues and the application tables to apply and compose transactions. These phases are displayed separately in the Data Synchronization section of the Mobile Manager.
On the Mobile Server home page, you can navigate to the Data Synchronization home page by clicking Data Synchronization, which is located under the Components section.
6.2 Managing the Sync Server
The Sync Server is an HTTP servlet that listens to client synchronization requests. As demonstrated by Figure 6-1, during every synchronization session, the Sync Server uploads client transactions from the client Oracle Lite database and places them within the In-Queues. The Sync Server then downloads any server-side transactions from the Out-Queues to the client Oracle Lite database.
From the Data Synchronization home page, you can manage Sync Server tasks—such as the following:
6.2.1 Starting/Stopping the Sync Server
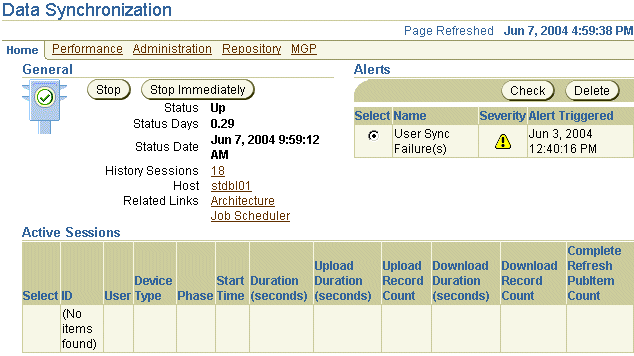
To start the Sync Server, navigate to the Data Synchronization home page. The Sync Server default status is Up, as displayed in Figure 6-2.
To gracefully shut down the Sync Server, click Stop. The Sync Server stops after all current sessions have completed synchronization. To immediately stop the Sync Server, click Stop Immediately, which kills current sync sessions immediately. Use for emergency situations.
6.2.2 Checking Synchronization Alerts
Both the Sync Server and MGP register alerts if a problem occurs within any part of the synchronization phases. There are two types of alerts, as follows:
-
Critical alerts—For the Sync Server, clients cannot synchronize if the Sync Server encounters an exception (also known as a critical alert); thus, the errors must be resolved by the administrator. Once resolved, the administrator re-starts the Sync Server.
-
Warning alerts—These alerts are registered when an individual synchronization session fails. The administrator checks the Sync session details in the Sync Session History and determines the reasons for the failure. If necessary, the administrator may need to involve a DBA, if the reason is database-related.
Each alert provides the alert name, degree of severity, time when the alert was triggered, and time when the alert was last checked by a DBA.
Table 6-1 lists sample alerts. Note that the type designates whether the alert originates from the Sync Server or the MGP.
6.2.3 Managing Sync Sessions
For all users, the sessions that are currently in the process of a synchronization are displayed in the Active Sessions table at the bottom of the Data Synchronization Home Page. Synchronization involves uploading or downloading updates between the the Sync Client and Sync Server.
You can terminate any active session on the Data Synchronization Home page by performing the following steps:
-
Select the active session that you wish to terminate and click Kill.
-
Click Yes.
-
Click OK for the confirmation message.
The Active Sessions table on the Data Synchronization home page also displays session details. Select the active session that you wish to view and click Details to see the publication items that have been uploaded or downloaded, waiting publication items, records and timing information, and the session trace file.
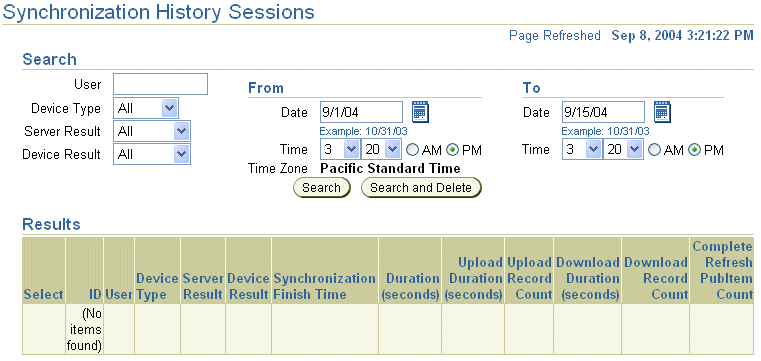
If you want to view all details about completed synchronization sessions, navigate to the Synchronization History Sessions screen. To navigate to this screen, either click the number hyperlink next to History Sessions on the home page or navigate through the Performance tab. The total number of registered sessions is designated by the number next to History Sessions.
Figure 6-3 shows the Synchronization History Sessions page.
All session history is not displayed until you search for the appropriate records. If you want all records within a specified date, then the only thing that you need to provide is the From and To date range and click Search. Be careful to only click Search and Delete if you want these records removed. You can further narrow the search by specifying one or more of the following:
-
The name of the user from which all synchronizations originated
-
The device platform type to see all synchronizations from just these platforms.
-
Only those synchronizations that were successful or failures from the server-side.
-
Only those synchronizations that were successful or failures from the device-side.
The Session History page displays matched sessions in the Results section. Once displayed, you can sort by most of the headers to either sort top to bottom or bottom to top. For example, to sort sync sessions by user, click the User header title.
To delete a session, select the session that you want to delete and click Delete. To view the details of a session, select the session and click Details. The Sync History Session page displays session details, such as publication items that are uploaded or downloaded, records and timing information, and the session trace file. The View and Download links are automatically enabled for viewing or downloading trace files that are available for the chosen session.
6.2.4 Displaying Operating System (OS) and Java Virtual Machine (JVM) Information
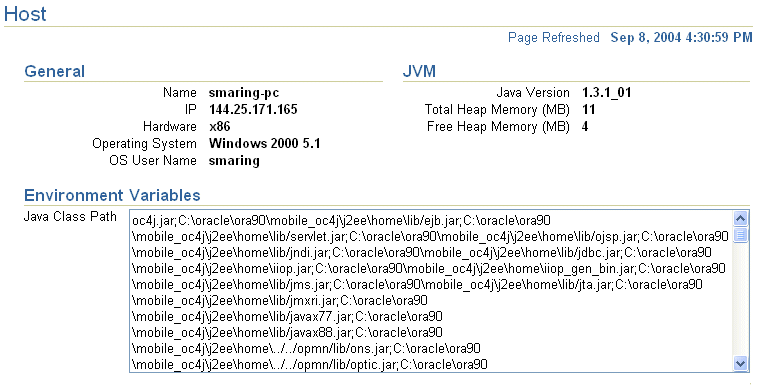
You can see the operating system and JVM versions that are installed on the host where the Mobile Server resides by clicking the Host hyperlink that is displayed against the Host on the Data Synchronization home page. As displayed in Figure 6-4, the Host page displays host information, such as host name, IP address, OS type, and OS user name. The JVM section displays the Java CLASSPATH, Java version, and heap memory size.
6.3 Configuring Data Synchronization
There are two types of configuration parameters for Data Synchronization:
-
Shared—Shared parameters affect all Mobile Server instances in the farm. The administrator can have multiple Mobile Server instances in a single farm that uses the same Mobile repository. To modify these parameters, navigate to the Administration screen and click Shared Parameters.
-
Instance—Instance parameters only affect a single Mobile Server instance; that is, the Mobile Server that you are currently viewing. These parameters are stored in the
WEBTOGO.ORAfile; thus, once modified, you may need to restart the Mobile Server. Check the Need Restart column to verify if a restart is necessary. To modify these parameters, navigate to the Administration screen and click Instance Parameters. See Appendix B, "Configuration Parameters for the WEBTOGO.ORA File" for a description of each of these parameters.It is never recommended to modify the
webtogo.orafile directly; instead, use the Mobile Manager to modify any of thewebtogo.orafile parameters.
To view the parameter description and additional information, click Show. You can modify any of the values in the New Value field and click Apply. Some of the Instance parameter values do not take effect until the Mobile Server is restarted.
6.4 How Do You Encrypt All Databases for the Initial Sync?
In the default server configuration, Mobile clients do not automatically encrypt the snapshot ODB files after you complete the initial sync. However, you can modify your configuration to automatically encrypt all snapshot ODB files with the synchronization user password after the initial sync completes. The following sections demonstrate how to configure for this option either on the client or on the server:
-
Section 6.4.1, "Configuring on the Local Client for Automatic Encryption of Local Snapshots"
-
Section 6.4.2, "Configuring on the Server for Automatic Encryption of Local Snapshots"
6.4.1 Configuring on the Local Client for Automatic Encryption of Local Snapshots
On the local client, you can configure for automatic encryption of the snapshot ODB files after initial synchronization by modifying the POLITE.INI/POLITE.TXT file with the following parameter:
[SYNC]
ENCRYPT_DB=1
After the first encryption, you may want to modify the parameter to a 2, to eliminate the encryption (and performance issue) after every synchronization. For more information on modifying the ENCRYPT_DB parameter in the POLITE.INI/POLITE.TXT file, see Section H.3.2.13, "ENCRYPT_DB".
6.4.2 Configuring on the Server for Automatic Encryption of Local Snapshots
On the server, you can configure for automatic encryption of the snapshot ODB files after initial synchronization by performing the following:
-
Logon to the Mobile Server as an Administrator and launch the Mobile Manager tool.
-
Click on Mobile Devices, followed by Administration.
-
Click on Command Management.
-
Click Create Command.
-
Create the following new Command:
Name: EncryptDB
Command: updt_conf.otl
Description: Encrypt Database
-
Edit the newly created command
EncryptDB, as follows:Command: updt_conf?app=polite/sync&key=ENCRYPT_DB&val=1
-
Apply the changes.
-
Edit the
DeviceInfoCommand. Insert the new CommandEncryptDBand click OK.
For more information on sending commands to the Mobile device, see Section 8.6, "Sending Commands to Your Mobile Devices".
6.5 Managing Trace Settings and Trace Files
You can configure the type of tracing that occurs for Data Synchronization components. For more information, see Section 16.1.2, "Data Synchronization Tracing".
6.6 Browsing the Repository for Synchronization Details
The Repository screen describes how to look up user information, publications, publication items, and the In-Queue, Out-Queue, and Error queues that facilitate synchronization. This section contains the following topics:
6.6.1 Viewing User Information
All users that have been added by the administrator (see Section 5.1, "Managing Users and Groups") are contained within the Mobile repository. With this Users screen, you can view everything that is attached to this user, such as application subscriptions, publication items, parameters, SQL scripts, Java resources, sequences, and performance analysis.
-
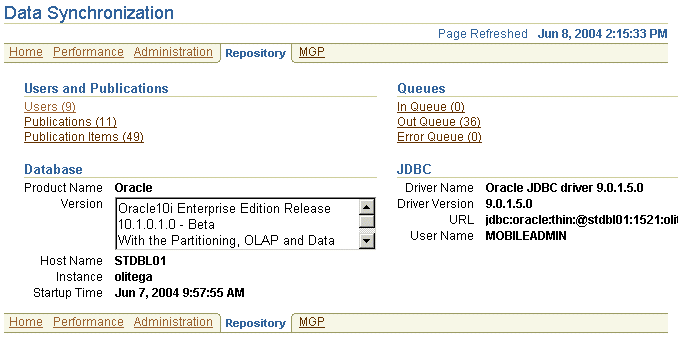
To view information about existing users in the repository, click the Repository tab on the Data Synchronization home page.
As displayed in Figure 6-5, the Repository tab appears.
-
Click Users, which brings up a list of all users currently in the repository. The number next to Users details the number of users currently in the repository.
-
Choose the user in which you are interested and click Subscriptions. The Subscriptions page displays the existing publications for the user. A subscription is the combination of the publication, its publications items, and the user to which it is attached.
On the subscriptions screen, choose any publication and then click any of the buttons above it to see all of the publication items, parameters, SQL scripts, Java resources, and sequences. In addition, if you click the Consperf performance analysis button, you can generate performance analysis for the publication items. See Section 6.7.3, "Analyzing Performance of Publications With the Consperf Utility" for more information on Consperf performance analysis.
You can add subscriptions to the user by granting the user access to the application that contains the publication. See Section 5.2.1, "Grant or Revoke Application Access to Users" on how to grant access to applications. To add a publication to an application, use the Mobile Development Workbench.
6.6.2 Viewing Publications
To view all publications that have been published against the Mobile Server, click Publications under the Users and Publications section. The number next to Publications are the number of publications currently in the repository, which were uploaded to the repository when the application was published. You can view these publications individually using this link. Clicking Publications brings up a screen that contains a list of all of the publications. If there are too many to fit on a page, you can search for a specific publication. Similar to the Users screen, you can select a publication and then view the publication items, parameters, SQL scripts, Java resources, sequences, and users that are attached to this publication.
When you add publication items to each publication, you specify certain properties for each publication item within the publication, such as the order weight of when this item is executed in relation to the other publication items in the subscription, who wins when a conflict occurs, and options for disabling DML. You can view some of these properties when you select the publication and click Publication Items. For more information on these properties, see Section 3.5.9 "Adding Publication Items to a Publication" in the Oracle Database Lite Developer's Guide.
You can only view publications in this screen. To modify your publication, use the Mobile Development Workbench. For more information, see the MDW chapter in the Oracle Database Lite Developer's Guide.
6.6.3 Viewing Publication Items
To view publication items, click Publication Items under the Users and Publications section. The number next to Publication Items details the number of publication items stored in the repository. These items were uploaded to the repository when the application was published.
Click Show to view the publication item properties.
You can only view publication items in this screen. To modify you publication and its publication item, use the Mobile Development Workbench. For more information, see the MDW chapter in the Oracle Database Lite Developer's Guide.
6.6.4 Viewing Synchronization Queues
You can view what is currently in the synchronization queues. To view transactions that are listed in queues, click the required hyperlink under the Queues section. For example, to view transactions that are listed in the Out-Queue, click Out Queue. The number next to each queue shows the number of transactions contained within that queue.
The In-Queue and Error Queue are organized by transactions.
6.6.4.1 Viewing Transactions in the In-Queue
You can view the current transactions that exist in the In-Queue. If you are wondering if your changes have been applied to the application tables, you can verify if they are still in the In-Queue or have already been processed by the MGP. If you see your transactions held in the In-Queue longer than you wish, then modify the timing on how often the MGP executes in the Job Scheduler. See Section 7.3, "Manage Scheduled Jobs Using the Mobile Manager" for more information on the Job Scheduler.
6.6.4.2 Viewing Subscriptions in the Out-Queue
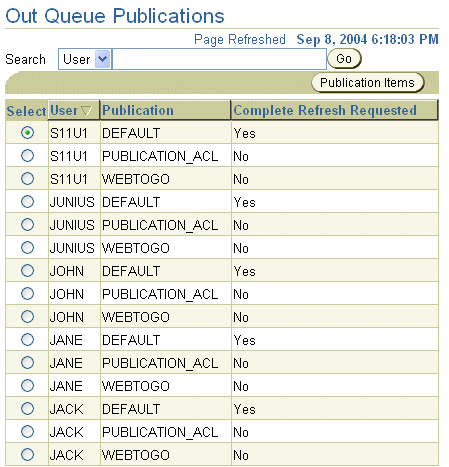
The Out-Queue contains the transactions that are destined for the Mobile client. The transactions are organized by subscriptions, which is a combination of the user and each publication for the user. Also, you can see if a complete refresh is requested. Figure 6-6 displays the Out-Queue Publications page.
You can view the details of each subscription by performing the following:
-
Select the subscription to view with the Select button next to the user name/publication in which you are interested.
-
Click Publication Items, which brings up Figure 6-6.
The Publications Items screen describes how many records is in the publication and whether it uses a fast or complete refresh mode.
Figure 6-7 Publication Items in the Out-Queue Subscription
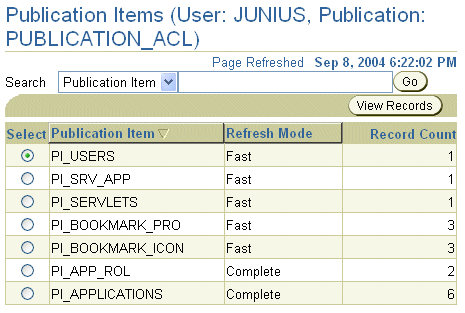
Description of the illustration outq_pubitem.gif
-
View the records of the publication item by clicking the Select button and then click View Records.
-
Click Show on each record to see the record data.
6.6.4.3 Viewing Transactions in the Error Queue
The purpose of the error queue is to store transactions that fail due to conflicts and other unforseen problems—such as database issues. If there is an error on the apply phase of the synchronization process, then the error is posted to this error queue. Some of the transactions placed into the error queue show unresolved error conditions, where the administrator must perform a function to resolve the problem before re-executing the transaction. These conflicts are defined with ERROR. However, other conflicts are resolved by the Mobile Server, such as by the conflict resolution rules of "server wins" or "client wins". With these, a transaction is still logged to the error queue to inform the administrator of how the conflict was resolved. It is up to the administrator to modify the outcome of the conflict. These messages are defined with CONFLICT DETECTED.
If the administrator resolves the error condition that caused the problem, then the administrator may attempt to re-apply the transaction or purge the error queues. To view the Mobile Server error queues in the database, the error queue is C$EQ and the data is stored in CEQ$<base_table_name>.
A Mobile Server synchronization conflict occurs if:
-
The client and the server update the same row. This error is resolved by the Mobile Server by the conflict rules, but is logged in the error queue for you to see the result. You can choose to modify the result.
-
The client and server create rows with the same primary key values. This error is resolved by the Mobile Server, but is logged in the error queue for you to see the result. You can choose to modify the result.
-
The client deletes the same row that the server updates. This error is resolved by the Mobile Server, but is logged in the error queue for you to see the result. You can choose to modify the result.
-
The server deletes the same row that the client updates. This error is unresolved by the Mobile Server. The administrator must decide how this is resolved.
-
Client is out of sync. This error is unresolved by the Mobile Server. The administrator must decide how this is resolved.
-
Client records violate server database constraints. This error is unresolved by the Mobile Server. The administrator must decide how this is resolved by either modifying the database constraints and re-executing the transaction, or by modifying how the client is able to update records to conform to the constraints.
-
An error occurs when reapplying a backup. See Section 15.3, "Oracle Database Lite Backup Coordination Between Client and Server" for instructions on recovering from a backup.
-
An error occurs with the back-end database, such as a constraint violation or storage issue.
If you decide to reapply the records in the transaction to the application tables, you must perform the following:
-
Correct the reason why the error occurred in the first place.
-
You can only re-execute the transaction if the DML operation is Insert, Update, or Delete. If the DML operation is in the Error state, then modify the DML operation from Error to Update. The DBA must modify the record in the error queue for the base table, named
CEQ$<base_table_name>, changing the DML operation from Error (E) to Update (U), Insert (I) or Delete (D). -
If the conflict resolution is set to "server wins," then you may lose the client modifications. Thus, if you set the conflict resolution to "client wins," then you force these changes to overwrite the server.
-
Once the DML operation is Insert, Update, or Delete, re-execute the command.
-
Navigate to the Error Queue screen in the Mobile Manager.
-
Click on the modified record.
-
Click Execute.
-
|
Note: For more information on the error queue and how to reapply the records using an API, see Section 3.8.3 Resolving Conflicts Using the Error Queue in the Oracle Database Lite Developer's Guide. |
6.7 Monitoring and Analyzing Performance
The following sections describe how to monitor and analyze Data Synchronization performance.
-
Section 6.7.3, "Analyzing Performance of Publications With the Consperf Utility"
-
Section 6.7.4, "Monitoring Synchronization Using SQL Scripts"
-
Section 6.7.5, "Synchronization Performance Affected by WebCache"
6.7.1 Viewing Sync Server Statistics
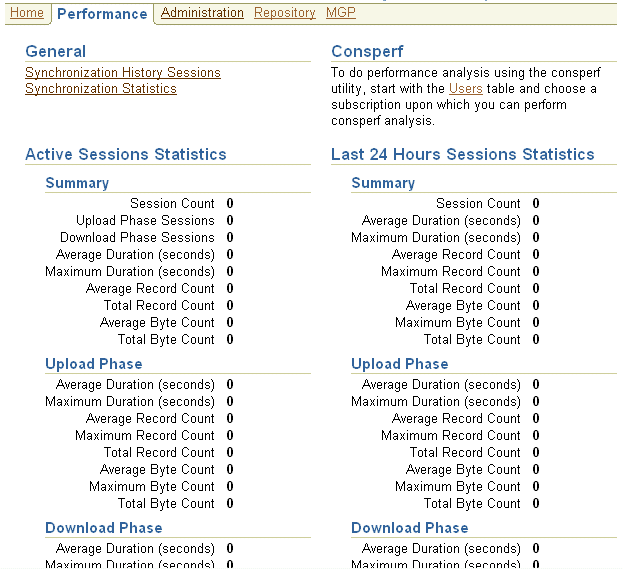
The Performance tab displays the Sync Server statistics of the current session and statistics of history sessions that have occurred in the last 24 hours.
To view Sync Statistics, click the Performance tab. As displayed in Figure 6-8, you can see the active Sync Server statistics from the currently active sessions and compare it to overall statistics gathered from all sessions in the past 24 hours. This includes an overall section, the upload phase, and the download phase.
To view statistics from other dates, click the Synchronization Statistics link in the General section of this page. The Synchronization Statistics page contains search criteria such as user name, device type, and duration. Specify your criteria in the Search section and click Go. The Sync Statistics page displays results such as summary, upload phase, and download phase details.
6.7.2 Viewing MGP Cycles and Statistics
By navigating to the MGP tab off of the Data Synchronization screen, the Mobile Server administrator can view the current status of the MGP cycle (see Figure 6-9). The columns are separated so that you can see how, in the last 24 hours, the MGP has performed overall, as well as for each individual phase: apply, compose and process.
When you click on MGP Current Cycle, you can see what the MGP process is currently doing. For instance, you can check if the apply or compose cycle is running when the MGP cycle is in progress. If you have set the MGP_HISTORY instance parameter, (see Section 6.3, "Configuring Data Synchronization"), then upon completion of the apply or compose cycle, the cycle details are stored in Cycle History.
Since the front page only shows the last 24 hours, you can view farther back by clicking on the MGP Apply/Compose Cycle Statistics. You can set a date range to search and can even specify whether to search based upon the following:
-
Apply Only or Apply/Compose
-
Success, Failure, or Conflict results
When you click MGP Apply/Compose cycles, you can search for a range of historical records of these cycles and then view the details of each cycle.
6.7.3 Analyzing Performance of Publications With the Consperf Utility
The Consperf utility profiles your subscriptions and may modify how the publication item is executed if the utility determines that there is a more performant option. The Consperf tool evaluates how the SQL within the publication item interacts with our Data Synchronization query templates. The first synchronization is always a complete refresh, which is a direct invocation of the query. On subsequent synchronizations, the query templates determine incremental refreshes. This improves your performance from not having to perform a complete refresh each time you synchronize. However, the interaction of our query templates and your SQL may not be optimal, which is discovered by the Consperf tool. We either modify the query template or type of logical delete or insert for you or you can adjust your SQL to be more performant in regards to our templates.
In addition, application developers and administrators use this utility to analyze the performance of subscriptions and identify potential bottlenecks during synchronization.
This tool generates the following two primary analysis reports:
-
Timing statistics for publication items
-
Explain plans for publications
The Consperf tool automatically tunes subscription properties, if the default templates do not supply the highest performing option. You can select a client and choose the desired subscription for performance analysis. Users can change parameter values before analyzing performance. The analysis results, which are timing and execution plan reports, are stored on the server and can be accessed by viewing the same user and subscription.
You can execute the Consperf utility through one of the following locations:
-
Click the Users link under the Consperf section on the Performance tab.
-
Click the Users link from the Repository screen.
Then, perform the following:
-
Select the User that you want to execute the Consperf tool against and click Subscriptions.
-
From the subscriptions screen, choose the publication and click Consperf performance analysis. This starts the Consperf analysis.
-
Click Set consperf parameters and launch the consperf thread, which brings you to a screen where you can configure parameters that effect how the performance analysis is executed. See Section 6.7.3.1, "Deciphering the Performance Evaluation Files" for more information on these parameters and how they effect the performance evaluation output.
-
Once you have set the configuration for how you want your performance analysis to occur, click OK. The Consperf tool executes and prepares the reports for you, based on your configuration. You are returned to the first Consperf page with the reports listed as hyperlinks under the Last Consperf Run Results section as View Timing File or View Execution Plan File.
6.7.3.1 Deciphering the Performance Evaluation Files
There are two performance evaluatons that come out of the Consperf utility:
-
Timing File
-
Execution Plan File
Timing File
The timing file contains the analysis of how the publication item performs with the data synchronization defaults against how it could perform if other options were chosen. The output of this file shows you the conclusions of the analysis and how the data synchronization defaults could be modified to perform better with your particular publication items.
The first section of the timing file provides you information on the configuration with which this analysis was executed. Thus, if you modify the configuration for other analysis, you can go back and compare each file to each other to easily see the differences in the output.
|
Note: The results of this analysis may cause the data synchronization engine to modify the type of query template or logical delete/insert/update used with your publication item. To change it back to the defaults, you will have to rerun Consperf withCLEARTUNE set to YES. See Table 6-3 for a full description of parameter settings. |
The following example shows the publication that is examined is the T_SAMPLE11 publication. The version of the Oracle Database Lite is 10.0.0.0.0. The user is S11U1. And the configuration is set to time out if the query takes longer that 1000 milliseconds and change the defaults if the difference between the default and the other templates are greater than 20 seconds (20000 milliseconds). The command that authorizes the changes is when AUTOTUNE is set to true. If set to false, the analysis is provided, but nothing is modified.
VERSION = 10.0.0.0.0
OPTMIZER_MODE = null
APPLICATION = null
PUBLICATION = T_SAMPLE11
CLIENTID = S11U1
TIMEOUT = 1000 ms
TOLERANCE = 20000 ms
ITERATIONS = 2
AUTOTUNE_SUPPORT = true
The next part of the Timing File lists the time in milliseconds each template type takes to complete with each publication item in the publication. There are three templates that data synchronization can use to "wrap" your SQL query. The default query template is SYNC_1. Since the tolerance is set to 20 seconds, then if either template SYNC_2 or SYNC_3 perform at least 20 seconds bettern than SYNC_1, then the template type will be modified for your publication item. You can set the TOLERANCE level to fewer seconds in the Consperf configuration. See Table 6-3 for a description of TOLERANCE.
Publication Item Name | NS | BS | SYNC_1 | SYNC_2 | SYNC_3 | AS | Total
 -----------------------------------------------------------------------
P_SAMPLE11-D          | <3> | <0> | <6>  | 10     | -1000  | <0> | 9
P_SAMPLE11-M          | <3> | <0> | <5>  | 8      | -1000  | <0> | 8
-
There are two publication items in the subscription.
-
NS stands for Null Sync. Your application may be issuing a null synchronization. If so, this shows the time in milliseconds that it took to complete. The null synchronization is a tool to see if it is the data that is causing the performance hit or the application itself.
-
BS stands for Before Synchronization; AS stands for After Synchronization. You can provide callouts that are executed either before or after each synchronization for this application. This shows the time in milliseconds it takes to perform each task. In this example, there is no before or after synchronization callouts.
-
SYNC_1is the default template. In combination with the publication items, it still is executing the fastest as compared to the other two options:SYNC_2andSYNC_3with 6 and 5 milliseconds for each publication item respectively. Thus, these publication items will continue to useSYNC_1template. Note thatSYNC_3has -1000 as its time. That either means that the template was not appropriate to execute or that it timed out.-
SYNC_1uses an outer-join for inserts, updates, and deletes -
SYNC_2is a simple insert and update -
SYNC_3uses the base view for insert and update. The base view is the first table in the select statement, as it is the primary key used to search for all records in the query.
-
-
The total is the total number of milliseconds to execute the entire publication item.
The second section is how the MGP performs with the templates it uses for deletes and inserts. It evaluates the default against other options, as follows:
-
Logical delete options:
-
MGP template for logical deletes using EXISTS: default for logical delete
-
MGP template for logical deletes using correlated IN
-
MGP template for logical deletes using HASH_AJ
-
MGP template for logical deletes using IN
-
-
Logical insert options:
-
MGP template for logical inserts using EXISTS: default for logical insert
-
MGP template for logical inserts using correlated IN
-
MGP template for logical inserts using IN
-
-
Logical update options
-
MGP template for logical updates using correlated IN: default for logical updates
-
MGP template for logical updates using EXISTS
-
MGP template for logical updates using IN
-
-
MGP template for logical updates with multiple table dependencies
For example, the following evaluates how each publication item performs with its logical deletes:
MGP Output...
Pub Item Name | LDEL_1 | LDEL_2 | LDEL_3 | LDEL_4
P_SAMPLE11-D  | <5>    | 3      | 3      | 3
P_SAMPLE11-M  | <5>    | 3      | 5      | 4
The LDEL_1 is the default and even though LDEL_2 , 3 and 4 are faster, they are not 20 seconds faster, which is the tolerance level. So, the default for deletes is kept the same. If the difference in speed had been greater than the tolerance level, the Consperf utility would have modified the logical delete method in the repository for the publication item in future—if the autotune parameter was set to yes.
The last section, Subscription Properties, describes the following:
-
Profiled: Has autotune been turned on and Consperf executed previously on this subscription?
-
Base View: True if this publication item uses more than one table.
-
How many records are in the subscription.
-
How many records are dirty?
-
How many records have been flagged as dirty to simulate an actual run? Up to the number of records in the subscription or MAXLOG will be flagged as dirty, whichever is least.
Configuration for Data Synchronization
Table 6-2 Consperf Parameters for Both Synchronization and MGP Processing
| Parameter | Default Value | Allowed Values | Description |
|---|---|---|---|
| PUBITEMLIST | <ALL> | Pub1, Pub2, and so on. | Specifies comma-separated list of publication items to process. The default is all publication items in the publication. |
| SKIPPUBITEMLIST | <NONE> | Pub1, Pub2, and so on. | Specifies comma-separated list of publication items to skip. |
| OPTIMIZER | <DB> | Can set to RULE or CHOOSE; otherwise sets to what database is set to. | Specifies the optimizer mode to use within Oracle. The default is the current DB setting. |
| ORDERBYPUBITEM | NO | Yes or No | Orders all output by publication item name. |
Table 6-3 Consperf Parameters for Synchronization Timing Performance
| Parameter | Default Value | Allowed Values | Description |
|---|---|---|---|
| TIMEOUT | 10 seconds | Integer for seconds | Specifies the query timeout value in seconds. This is the amount of time Consperf will wait before it cancels a query. |
| UPDATECOUNT | 5 | Integer for number of records | Specifies the number of records to mark as dirty during synchronization. |
| MAXLOG | 5000 | Integer for number of records | Specifies the number of records to put in the log table. Simulates the transaction log |
| AUTOTUNE | NO | Yes or No | Enables auto-tune. |
| CLEARTUNE | NO | Yes or No | Clears existing auto-tune results. |
| TOLERANCE | 20 seconds | Integer for seconds | A template must be faster by this number of seconds before it replaces the default template. |
The exeuction plan file shows how your publication items interact with the different logical delete, insert, and update templates. From this report, you can evaluate your SQL to see if you want to modify it in any way to speed up your query. Set the optimizer parameter to designate how the database is organized. If you set this parameter to a setting that the database is not set to, it still acts as if the database is set to this way to show you how it would execute. See Table 6-4 for all configuration parameters that relate to this search.
Table 6-4 Consperf Parameters for Execution Performance Plan
| Parameter | Default Value | Allowed Values | Description |
|---|---|---|---|
| GATHERSTATS | NO | Yes or No | Gathers optimizer statistics on all mobile server objects. MGP compose MUST be disabled while Consperf analyzes objects. Consperf blocks this automatically, but the safest approach is to manually stop the MGP process before running Consperf with the GATHERSTATS option. If Consperf fails while gathering statistics, users must re-run CLEARSTATS before starting the MGP process again. |
| CLEARSTATS | NO | Yes or No | Removes optimizer statistics on mobile server objects. |
| SQLTRACE | NO | Yes or No | Enables Oracle sql trace. TKPROF can be used to analyze the resulting trace file. |
6.7.4 Monitoring Synchronization Using SQL Scripts
If, instead of viewing MGP statistics within the Mobile Manager, you would rather execute SQL scripts to monitor Mobile application status during synchronization, you may use any of the following SQL scripts to retrieve the desired information.
-
Section 6.7.4.3, "Completely Refreshed Publication Items for all Clients"
-
Section 6.7.4.4, "Publications Flagged for Complete Refresh for All Clients"
-
Section 6.7.4.5, "Clients and Publication where Subscription Parameters are Not Set"
-
Section 6.7.4.6, "Record Counts for Map-based Publication Item by Client"
-
Section 6.7.4.7, "Record Count for Map-based Publication Items by Store"
-
Section 6.7.4.8, "All Client Sequence Partitions and Sequence Values"
6.7.4.1 Synchronization Times for All Clients
Using the following script, you can check the latest successful synchronization times for all clients by retrieving such information from the all_clients table.
select client, lastrefresh_starttime, lastrefresh_endtimefrom cv$all_clientsorder by client/
6.7.4.2 Failed Transactions for all Clients
Using the following script, you can retrieve a list of failed transactions for all clients from the all_errors table.
select client, transaction_id, item_name, message_textfrom cv$all_errorswhere message_text is not nullorder by client,transaction_id/
6.7.4.3 Completely Refreshed Publication Items for all Clients
Using the following SQL script, you can retrieve a list of all publication items for all clients which were completely refreshed during the last synchronization process.
select clientid, publication_itemfrom c$complete_refresh_logorder by clientid, publication_item/
6.7.4.4 Publications Flagged for Complete Refresh for All Clients
Using the following SQL script, you can retrieve a list of publications for all clients that are flagged for a complete refresh during the next synchronization process.
select clientid, template as publicationfrom c$all_subscriptionswhere crr = 'Y'/
6.7.4.5 Clients and Publication where Subscription Parameters are Not Set
Using the following SQL script, you can retrieve a list of clients and their publications where the subscription parameters have not been set.
select client, name as publication, param_name, param_valuefrom cv$all_subscription_paramswhere param_value is nullorder by client, name/
6.7.4.6 Record Counts for Map-based Publication Item by Client
Using the following script, you can retrieve record counts for all clients in queues for map-based publication items, that are grouped by clients.
select clid$$cs as client, count(*) as "RECORD COUNT"from c$in_messagesgroup by clid$$cs/
6.7.4.7 Record Count for Map-based Publication Items by Store
Using the following SQL script, you can retrieve record counts for all client in-queues for map-based publication items, that are grouped by store.
select clid$$cs as client, tranid$$ as transaction_id, store as item_name,count(*) as "RECORD COUNT"from c$in_messagesgroup by clid$$cs, tranid$$, store/
6.7.4.8 All Client Sequence Partitions and Sequence Values
Using the following SQL script, you can retrieve a list of all client sequence partitions and current sequence values.
select clientid, name, curr_val, incrfrom c$all_sequence_partitionsorder by clientid, name/
6.7.5 Synchronization Performance Affected by WebCache
The amount of time it takes to complete a synchronization for a Web-to-Go client is significantly increased when WebCache is installed. See Section 13.5, "Synchronization Performance Affected by WebCache" for more information.
