|
Oracle® Sensor Edge Server Guide
10g Release 3 (10.1.3) B25142-01 |
|
 Previous |
 Next |
|
Oracle® Sensor Edge Server Guide
10g Release 3 (10.1.3) B25142-01 |
|
 Previous |
 Next |
This chapter, through the following sections, describes how to manage and monitor an Oracle Sensor Edge Server instance using the Sensor Edge Server Console (the SES Console).
"Monitoring the Performance of the Oracle Sensor Edge Server Instance"
"Setting the General Information for the Oracle Sensor Edge Server Instance"
"Setting the Dispatcher for the Oracle Sensor Edge Server Instance"
"Setting the Devices and Filters Used by the Oracle Sensor Edge Server"
"Starting and Stopping the Oracle Sensor Edge Server Instance"
"Adding Extensions to the Oracle Sensor Edge Server Instance"
The Oracle Sensor Edge Server enables enterprises to incorporate information from sensors into their I.T. infrastructure and business applications by receiving event data from sensor devices or applications and then normalizing this data by putting it in a common data format and then stripping it of extraneous information using filters. The event data, which is now a normalized event message, is then sent to edge clients using a dispatcher. Depending on the configuration of the Oracle Sensor Edge Server's dispatcher, an Oracle Sensor Edge Server client receives event messages through Web Services, HTTP, EPC PML, ALE Web Services, or database streams. The payload of the message is always an event.
The SES Console enables you to manage and monitor the Oracle Sensor Edge Server instance. Table 3-1 describes the tabs of the SES Console and the tasks that they enable.
Table 3-1 Tasks Enabled by the SES Console
| Tab | Tasks |
|---|---|
|
Main |
Tasks include: |
|
Monitor Events |
|
|
View Log |
|
|
Event Reports |
Tasks include: |
After you log into the SES Console using the OC4J administrator name and password, The console defaults to the Configuration tab, which displays the Main page. This page provides an overall view of the current Oracle Sensor Edge Server instance usage, its basic configuration and its current dispatcher. You can edit the basic configuration, such as the Server and Site Name parameters from this page, as well as select another dispatcher method. For more information on the basic configuration for an Oracle Edge Sensor Server Instance, see "Setting the General Information for the Oracle Sensor Edge Server Instance".
See "Setting the General Information for the Oracle Sensor Edge Server Instance" for more information on the basic configuration of the Oracle Sensor Edge Server instance. For more information on dispatchers, see "Configuring Devices, Filter Instances, and Dispatchers".
The navigation tree (Figure 3-2), which displays on each page of the SES Console, enables you to both configure the current Oracle Sensor Edge Server instance and the extensions (filters, drivers, and dispatchers) in the repository. The tree organizes the configuration pages of the current Oracle Sensor Edge Server as a hierarchy, with the name of the current Oracle Sensor Edge Server as the top node. Clicking the plus (+) sign or the minus sign (-) next to a node enables you to display or hide items. You can modify the underlined items of the tree (such as Groups in Figure 3-2). Clicking an underlined item enables you to access a properties page, which enables you to modify and manage the selected item. Other items (that is, those that are not underlined), are titles and cannot be modified.
The pages accessed through the tree enable you to perform the following tasks:
The SES Console enables you to access other Oracle Sensor Edge Server instances that are connected to the same Sensor Data Repository using the Edge Server Instance List page (Figure 3-3), which you access using the other servers icon (Figure 3-4).
The page's Edge Server Instance List table lists the entries for the other Oracle Sensor Edge Servers that are connected to the same Sensor Data Repository. These entries enable you to identify and access the other server instances. Using this table, you can both access another Oracle Sensor Server instance, and view the running status of other Oracle Sensor Server instances. In addition you can edit and delete the entries for other Oracle Sensor Server instances.
To access another Oracle Sensor Server instance, click the name of the instance in the Server Name column of the Edge Server Instance List table and then enter the OC4J administrator name and password in the login page that appears.
Clicking the table's notepad and trash can icons enable you to edit or delete an entry for a selected Oracle Sensor Edge Server instance, respectively. The fields in the page's New Server Instance section enable you create an entry for an Oracle Sensor Edge Server instance, which is comprised of the instance's name and its location as described in "Creating an Entry for an Oracle Sensor Edge Server Instance".
|
Note: Because live Oracle Sensor Edge Server instances create their own entries once they are started, you are not required to create an entry for an Oracle Sensor Edge Server instance. |
To create an entry for an Oracle Sensor Edge Server instance:
Click the other servers icon (Figure 3-4). The Edge Server Instance List page appears (Figure 3-3), which includes a table listing the Oracle Sensor Edge Server instances that are connected to the same Sensor Data Repository.
Enter a name for the Oracle Sensor Edge Server instance.
Enter the URL that points to the Oracle Sensor Edge Server instance. Enter the URL in the following format:
http://<hostname/ip address>:<port>/edge
The <port> value is the port on which Oracle Application Server Containers for J2EE (OC4J) listens, which is located on the machine running the Oracle Sensor Edge Server instance. For a 10.1.3 OC4J instance, find the port value by navigating to oracle_home/opmn/bin and then running the following command:
opmnctl status - l
For a 10.1.2 OC4J instance, the OC4J listener port is generally 8888. For more information on OC4J 10.1.2, see Oracle Application Server Containers for J2EE User's Guide and "Installing OC4J".
Click Create Entry. The new Oracle Sensor Edge Server instance appears in the Edge Server Instance List table.
To edit an entry, first click the notepad icon for the selected Oracle Sensor Edge Server entry. The editing page then appears, which with its Server Name and URL fields populated with the information set for the selected entry. Perform either (or both) of the following:
Enter a new name for the entry.
Change the URL for the entry.
Click Update Entry to commit the changes, or click Cancel to set the entry back to its original state.
The Usage Statistics section of the Sensor Edge Server Instance page (Figure 3-1) lists the following performance metrics for the Oracle Sensor Edge Server Instance:
Events Received -- The number of inbound instruction events received by the Oracle Sensor Edge Server instance. For more information on inbound events, see "Monitoring the Event Data".
Events Generated -- The number of outbound events sent from the Oracle Sensor Edge Server instance. For more information on outbound events, see "Monitoring the Event Data".
Events Sent -- The total number of events dispatched by the Oracle Sensor Edge Server instance.
Queued Events -- The number of events that are currently waiting in the queue.
Clicking Clear Queue enables you to remove all of the queued events in the system (and sets the number displayed for Queued Events to 0). Use this function to purge old, backed-up event messages before setting up and starting a dispatcher or before restarting the Oracle Sensor Edge Server instance.
|
WARNING: Once you click Clear Queue, you cannot recover purged event data. |
The General Settings section of the Main page enables you to edit the basic information for the Oracle Sensor Edge Server instance (described in Table 3-2). Click Save Changes to commit the updates to the Oracle Sensor Edge Server.
Table 3-2 The General Settings
| Parameter | Description |
|---|---|
|
Server Name |
A name for the Oracle Sensor Edge Server instance. |
|
Site Name |
The site name for the Oracle Sensor Edge Server. This parameter is a grouping mechanism to logically distinguish between Oracle Sensor Edge Server instances. |
|
Internal Queue |
Event messages sent from readers (or any device) are enqueued into the internal queue. A dispatcher takes events from this queue and then dispatches them. For example, the Streams Dispatcher dispatches the event messages from this queue to a database. The following options enable you to protect data by controlling how event messages are held before they are dispatched and safeguard event data. . Options include:
|
|
Log Level |
A list of the following error logging options that set the level of severity for the messages written to the log file:
The error messages written to the log file reflect not only the log level that you select, but also the log levels that are of greater severity than the log level that you select. The level you select affects the data that displays in the View Log tab. See also "Viewing Log Information". |
|
Use Archive |
Selecting this option enables the events to be saved to the Sensor Data Repository. |
|
Shutdown Timeout |
Enter the time (in milliseconds) that the Oracle Sensor Edge Server waits before shutting down threads that are not functioning properly. |
Clicking the Change Dispatcher in the Main page (Figure 3-5), enables you to change the dispatcher used by the Oracle Sensor Edge Server. See also "Managing Dispatchers for an Oracle Sensor Edge Server Instance".
From the Search and Select page (Figure 3-6) that appears, you can select an edge dispatcher to send event messages using such means as remote Web Services, Oracle Streams, or to a client application using HTTP.
An Oracle Sensor Edge Server instance uses only one dispatcher at a time. After you assign a dispatcher as current, the Oracle Sensor Edge Server instance must be restarted. See "Starting and Stopping the Oracle Sensor Edge Server Instance".
Expanding the Available Extensions folder in the tree (Figure 3-7) displays the dispatchers, filters, and drivers that are available to the Oracle Sensor Edge Server instance. Dispatchers forward events sent to the Oracle Sensor Edge Server instance to either a dispatching layer or directly to an application. Drivers enable communication between a device (such as reader) and the Oracle Sensor Edge Server instance and the filters, which generally either remove unwanted events (such as duplicates) or both remove and translate one or more events into a high-level event.
Figure 3-7 The Available Extensions Folder
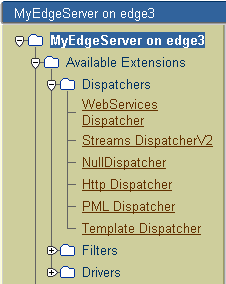
Clicking an extension, such as a driver, displays the default properties of the selected driver. The values set for the parameters are read-only and do not represent the current configuration of these objects. You cannot configure them because the Oracle Sensor Edge Server instance does not use live instances of the extensions. Instead, the Oracle Sensor Edge Server instance reads and cleanses event data using instances of the of the filters and drivers listed in the Extensions folder. To create these filter instances and driver instances (known as devices), you must create a device group. See "Configuring Devices, Filter Instances, and Dispatchers" for more information on creating device groups. See "Setting the Dispatcher for the Oracle Sensor Edge Server Instance" for more information on setting the dispatcher for the Sensor Edge Server.
To enable the Oracle Edge Sensor Server instance to receive, filter and dispatch event data, you must first create a device group, a logical grouping of devices (the instances of drivers) and the filters associated with these devices. An Oracle Sensor Edge Server instance can have one or many device groups instantiated. Each device group is responsible for all of the devices (and their associated filters) included within it.
Device groups make one or more devices into a logical device or "group." You use device groups to associate devices for processing as a single streams of events. For example, If you create device group called Warehouse Exits consisting of all of the devices placed at all of the exits of a warehouse (and if needed, add a filter instance to this group), then all of the generated events are viewed as originating from one logical device rather than from several devices.
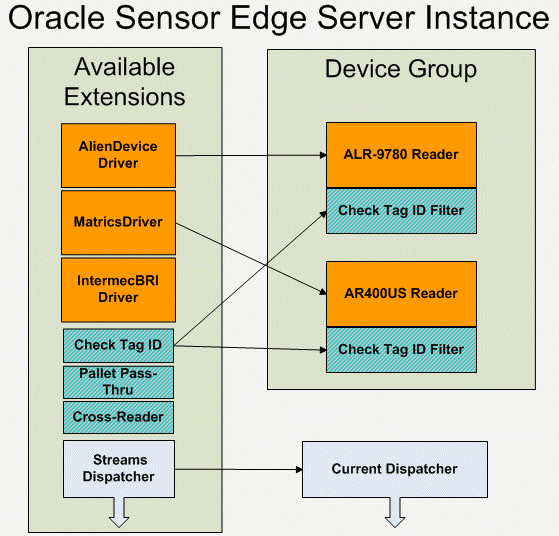
You can group devices in terms of management if you want to treat them as a logical unit to manage (such as in the case of the aforementioned Warehouse Exits device group), or you can group them by the type of filtering they perform (as illustrated in Figure 3-8). For example, if you group devices by cross-reader filtering, then you create a group of related devices and then attach filters to that group. For more information, see "Managing the Filter Instances for a Device or Device Group"
Figure 3-8 Reader Devices Grouped by Filter
Clicking the Groups folder invokes the Group Management page (Figure 3-9), which lists the device groups and their respective filters. In addition, the page lists the running status of the devices for each group. This page also enables you to create a new device group (as described in "Creating a Device Group"). To view the configuration of a specific device group, expand the Groups folder and then select the appropriate node to invoke the Configure Group page for the selected device group. The default device group is called Unassigned and is a special reserved group. For more information on Configure Group page, see "Editing a Device Group".
Creating a device group is the first step to connecting the Oracle Sensor Edge Server instance to devices and filters. Once you create a device group, you populate it with devices (the instances of the available drivers) and then attach filter instances to the individual devices (or to the entire device group). To create a new device group:
In the Group Management page, enter a name for the device group in the Group Name field and then click Create New Group. The Configure Group page appears for the new device group.
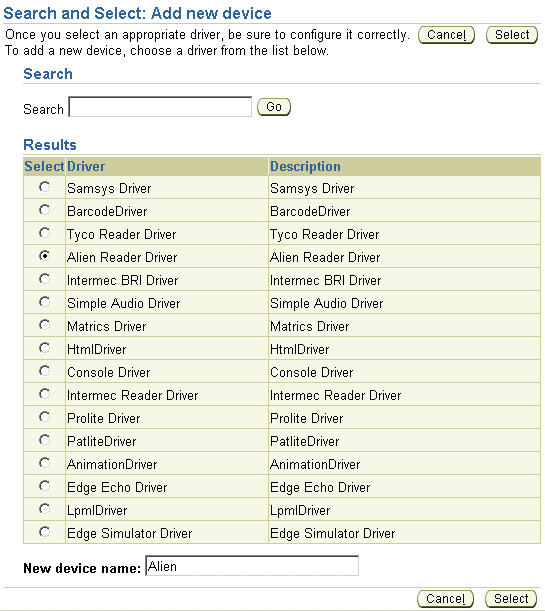
Create a device (a driver instance) for the device group by clicking Add new device. The Search and Select page appears, listing the drivers in the repository.
Figure 3-11 Selecting a Driver for the Device
|
Tip: Locate a driver by entering the name of the driver (or part of the driver name) in the Search field and then by clicking Go. |
Select a driver for the device. Table 3-3 describes the drivers supported by Oracle Sensor Edge Server. For descriptions of the these drivers, the configuration parameters required to create devices from them, and the models supported by these drivers, see Chapter 6, "Configuring Devices, Filter Instances, and Dispatchers".
Table 3-3 Supported Drivers
If needed, enter a name for the device in the New Device Name field. If you do not assign a name to the device, then Oracle Sensor Edge Server assigns a default name.
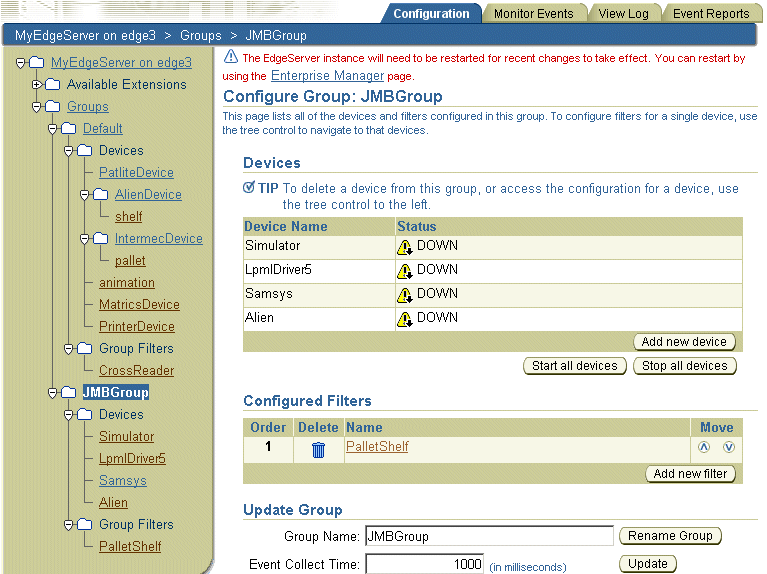
Click Select. The Configure Group page reappears, listing the device in the Devices section. The navigation tree also displays the device.
Figure 3-12 Devices Added to a Device Group
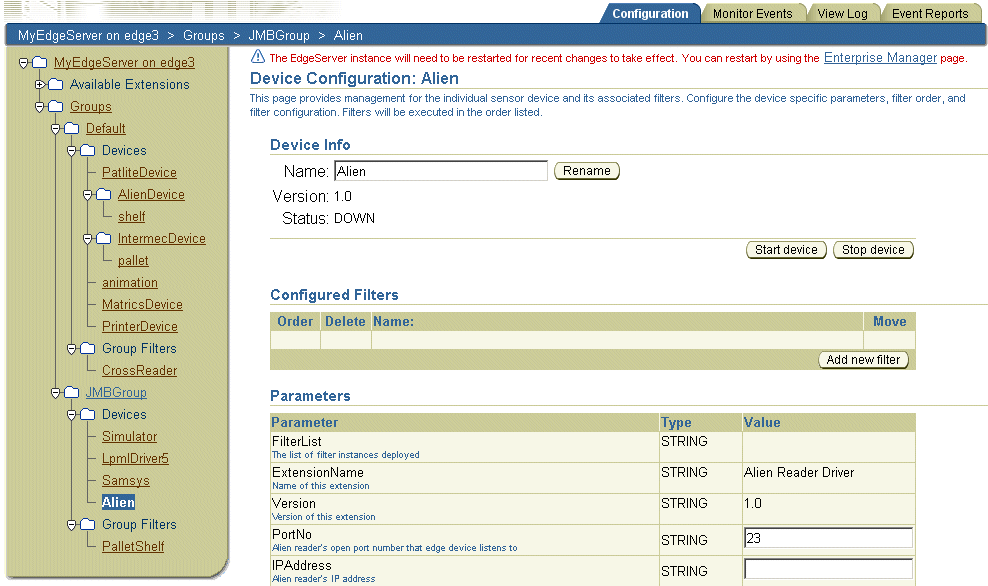
Configure the device by first selecting it from the tree. The Device Configuration page appears (Figure 3-13), displaying the parameters specific to the driver.
Define the parameters. For more information on the driver parameters, see "Configuring Devices".
Click Save Changes.
Figure 3-13 Configuring a Device for a Device Group
Add filters (filter instances) to the device by clicking Add new filter. The Search and Select page appears (Figure 3-14), listing the filters in the repository. Table 3-5 lists the Oracle Edge Sensor Server's seeded device- and group-level filters.
Select a filter instance for the device.
|
Tip: Locate a filter by entering the name of the filter (or part of the filter name) in the Search field and then by clicking Go. |
If needed, enter a name for the device in the New Filter Name field. If you do not assign a name to the filter instance, then Oracle Sensor Edge Server assigns a default name.
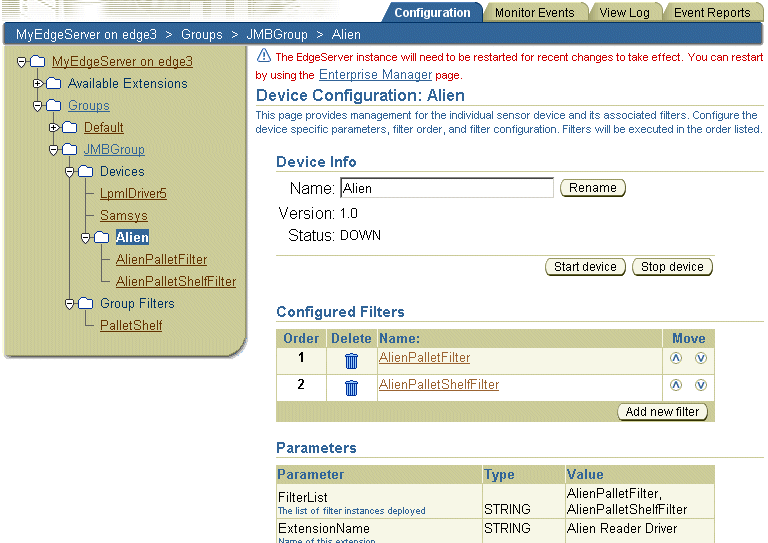
Click Select. The selected filter appears in the Configured Filters section of the device's configuration page (Figure 3-15) and in the tree under the device.
Figure 3-15 Adding Filter Instances to a Device
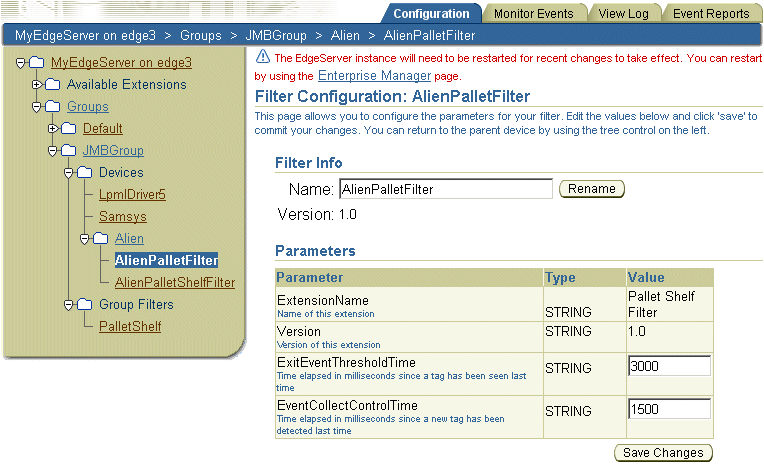
Configure the filter instance by first selecting the filter instance from the table in the Configured Filters section of the Device Configuration page, or from the tree. The Filter Configuration page appears (Figure 3-16), displaying the parameters of the selected filter.
If needed, rename the filter instance.
Define the filter parameters. For more information on filter parameters, see "Configuring Filter Instances".
Click Save Changes.
|
Note: You must stop and then restart the Oracle Sensor Edge Server after you create, edit or delete a device group. For more information, see "Starting and Stopping the Oracle Sensor Edge Server Instance". |
Figure 3-16 Creating a Filter Instance for a Device
If needed, assign a filter to the device group as follows:
Select the device group from the tree. The Configure Group page appears.
Click Add new filter. The Search and Select page appears (Figure 3-14), listing the filters in the repository. Table 3-5 lists the device- and group-level filters of the Oracle Edge Sensor Server.
Select a filter instance for the device group.
|
Tip: Locate a filter by entering the name of the filter (or part of the filter name) in the Search field and then by clicking Go. |
If needed, enter a name for the device in the New Filter Name field. If you do not assign a name to the filter instance, then Oracle Sensor Edge Server assigns a default name.
Click Select. The filter appears in the Configured Filters section of the Configure Group page and in the tree under Group Filters for the selected device group.
Configure the filter instance by first selecting the filter instance from the table in the Configured Filters section of the Configure Group page, or from the tree. The Filter Configuration page appears (Figure 3-16), displaying the parameters of the selected filter.
If needed, rename the filter instance.
Define the filter parameters. For more information on filter parameters, see "Configuring Filter Instances".
Click Save Changes.
The Configure Group page (Figure 3-9) enables you to edit the properties of a device group. This page, which appears when you click a device group in the navigation tree (Figure 3-2), enables you to do the following tasks:
To rename a device group:
Enter a new name for the device group in the Group Name field.
Click Rename Group. The new group name appears in the tree.
You can add devices and filter instances to a device group using the Add new device and Add new filter buttons described in "Creating a Device Group". Once you complete the device and filter instance assignments, click Update.
You must stop and then start device groups whenever you perform such tasks as adding new devices or filter instances. You start and stop the devices belonging to a device group using the Start all devices and Stop all devices buttons.
The Delete Group button enables you to remove a device group from the Oracle Sensor Edge Server. When you delete a device group, you also remove all of the devices and filter instances that have been configured for the group. Once you delete a device group, you must re-start entire Oracle Sensor Edge Server for the change to take effect.
Once you have modified an Oracle Sensor Edge Server instance, you must restart the Oracle Sensor Edge Server to commit the changes. You can stop and restart the Oracle Sensor Edge Server using either of the following methods:
Stopping and Starting an Oracle Sensor Edge Server Instance Using opmnctl
Restarting an Oracle Sensor Edge Server Instance Using the OracleAS Enterprise Manager
After you change the Oracle Sensor Edge Server's general settings, its dispatcher, or edit any device group, you can stop and restart the Oracle Sensor Edge Server using the opmnctl shutdown and opmnctl startall commands. For more information, see Oracle Process Manager and Notification Server Administrator's Guide.
When you change anything in an Oracle Sensor Edge Server instance, the SES Console displays a message (Figure 3-17) notifying you to restart the Oracle Sensor Edge Server instance using OracleAS Enterprise Manager. This message includes a link to OracleAS Enterprise Manager.
Figure 3-17 The Restart Oracle Enterprise Manager Message

To restart an Oracle Sensor Edge Server instance:
Click the Enterprise Manager link in the message (Figure 3-17). The login page for OracleAS Enterprise Manager appears.
After you enter the OC4J user name and password, the cluster topology page appears.
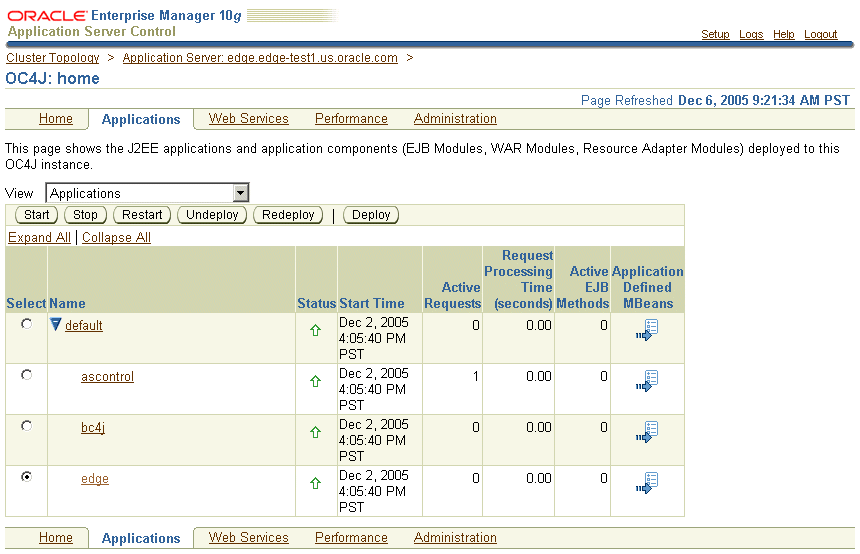
Navigate to the Home page (Figure 3-18).
Click Applications.
Select edge.
Click Restart.
Figure 3-18 The Home Page of OracleAS Enterprise Manager
|
Note: To restart OC4J 10.1.2, stop OC4J through the SES Console and then start OC4J again usingJava_HOME/bin/java -jar oc4j.jar.
|
You must first stop a device before you update it. You can stop or start a device from the Device Configuration page (Figure 3-13) using the Start Device and Stop Device buttons. The page also displays the status of the device. The status messages (described in Table 3-4) describe the current state of the driver, or its state before it crashed.
Table 3-4 Device Status Messages
| Status | Definition |
|---|---|
|
Instantiated |
The device successfully initialized itself (that is, it passed the |
|
Initialization Failed |
The initialization failed; the device is down (that is, the |
|
Start |
The device is started (it just entered the |
|
Start Failed |
The start failed; the |
|
Stop |
The device has stopped. |
|
Stop Failed |
The device failed to stop or clean up resources. |
|
Finished |
The device has completed processing. This is used by a device that has a fixed set of tasks and usually stops by itself when it completes these tasks, such as the Simulator when it finishes with the simulator file. |
|
Connection |
The device is attempting to connect. |
|
Connection Failed |
The device failed to connect. |
|
Setup |
The device is setting up resources and connections. |
|
Setup Failed |
The device failed during setup. |
|
Run |
The device is running. |
|
Run Failed |
The device failed while running. |
|
Disabled |
The device has been disabled. |
Filters can be attached to either a specific device or to a device group. Some filters, such as the Cross-Reader Redundant filter, are written as group-level filters and can only be attached to a device group. A device group filter provides filtering of events before they are delivered to an edge device. While some filters are written only for device groups, others are written only for device-level filtering and only function if they are attached to a specific device.
The Configured Filters tables of the Device Configuration (Figure 3-12) and Configure Group (Figure 3-15) pages enable you to add, delete, or reorder the filter instances. The add new filter button enables you to add additional filter instances to a device or to a device group. For more information, see "Creating a Device Group" and "Adding a Filter to a Device Group". Clicking the table's trash can icon enables you to remove a filter instance from a device or device group. The table's arrows enable you to prioritize the filter instances.
The order of filter instances affects the efficacy of the data filtering. For example, if a device or device group is assigned a group filter, which groups IDs into an array of events and treats them as one item and a tag filter the filters out the events for a specific tag, TagXYZ, then applying the group filter before the tag filter results in the Oracle Sensor Edge Server receiving events grouped into chunks based on when they were detected, but only after the tag filter has strained out the events for TagXYZ. Reversing the order of the filters (that is, putting the group filter before the tag filter) would prevent the tag filter from filtering out anything, because it would see only the group events and not those for TagXYZ.
Using the arrows in the Configured Filters table (Figure 3-15), you can arrange the filter instances by selecting a filter instance and then moving it up or down using the arrows.
A filter instance is an instantiated object of a filter. Whenever a filter is applied to a device (or to a device group), a filter instance is created, enabling the device or device group to use the filter.
Although you can develop your own filters and then upload them (see "Adding Extensions to the Oracle Sensor Edge Server Instance"), Oracle Sensor Edge Server ships with several filters (described in Table 3-5).
Table 3-5 The Pre-Seeded Filters of the Oracle Sensor Edge Server
| Filter Name | Function | Applied to Device Group? (Supports Group-Level Filtering) | Applied to Devices? (Supports Device-Level Filtering) |
|---|---|---|---|
|
Check Tag ID Filter |
A diagnostic tool that checks if a device is reading tags during a specified interval. See also "Configuring the Check Tag ID Filter". |
No |
Yes |
|
Cross-Reader Redundant Filter |
Blocks redundant events that are sent from the devices belonging to a device group. See also "Using the Cross-Reader Redundant Filter". |
Yes |
No |
|
Debug Filter |
Tracks events passing through the system and then writes these events to a log file. See also "Using the Debug Filter". |
No |
Yes |
|
JavaScript Filter |
Enables you to write filter logic in a scripting language. Changes made to the source scripts are loaded dynamically, thus eliminating the need to restart the server or any components. This filter relies on an external scripting engine that executes the script, such as Mozilla Rhino ( |
Yes |
Yes |
|
Movement Filter |
Smooths out movement tracking using Real Time Location System (RTLS) observations by averaging out spikes or sudden motion changes from errors or interference. See also "Configuring the Movement Filter". |
No |
Yes |
|
Pallet Pass-Thru Filter |
Enables you to see all of the tag IDs for items held in a container or on a pallet. See also "Configuring the Pallet Pass Thru Filter". |
No |
Yes |
|
Pallet Shelf Filter |
Sends events that signal new containers or pallets entering or exiting the field or gateway of a device reader. See also "Configuring the Pallet Shelf Filter". |
No |
Yes |
|
Pass Filter |
Notifies applications that a tag has passed through a device's gateway or range or transmission. This filter also blocks events, so that only one event, rather than duplicate events, are generated when a tag is detected by a device. See also "Configuring the Pass Filter". |
No |
Yes |
|
Polygon Filter |
Filters out all movement observations reported by Real Time Location System (RTLS) devices and generates events only if the tag moves in or out of any predefined polygons. The polygons are defined using a set of x, y coordinates that define the vertices and parenthesis. For example: ( (x,y), (x,y), ... ), (....), ..... See also "Configuring the Polygon Filter". |
No |
Yes |
|
Regex Filter |
Performs a regular expression search that looks for tags to either remove or to allow to pass through the streams. This filter enables you to define a set of patterns for the filter to search for in any of the event's fields. When the filter finds matches to the search criteria, it allows the event to pass through the system; if it finds no matches, it filters out the event. See also "Configuring the Regex Filter". |
Yes |
Yes |
|
Shelf Filter |
Signals that an item has entered, or exited the field or gateway of a device reader. See also "Configuring the Shelf Filter". |
No |
Yes |
Devices and filter instances communicate using events, messages that describe what has occurred. For example, a device informs other components that it has started by sending such a message. These event messages are specific to each type of device or filter instance. Within the Oracle Sensor Edge Server, any device can send or receive an event directly. In general, the event flow between the components follows two directions:
Inbound -- The devices and filter instances send events to the current dispatcher.
Outbound -- Applications send events to the devices and filter instances. These events are sometimes known as instruction events, since they often send commands to a device.
The SES Console enables you to view the health of the Oracle Sensor Edge Server by viewing the event data that displays in the Monitor Events and Events Reports tab. The Monitor Events tab (Figure 3-21) enables you to view the data currently in the queue, while the Events Reports tab enables you to view the data that has been stored in the Sensor Data Repository.
Table 3-6 describes the inbound and outbound fields that display in the Monitor Events and Events Reports tabs.
Table 3-6 inbound and Outbound Event Data
| Topic | Description |
|---|---|
|
Type |
A text representation of the Event Type. Types include RFID Observation, RTLS Observation, and Temperature. |
|
Description |
A text representation of the Event Subtype. |
|
Device Name |
The name of the device that generated the event |
|
Data |
The payload of the event. |
|
Time |
The time that the event was generated. |
The SES console enables you to view further information about an individual inbound, or outbound event, such as its Event Type, Subtype and Correlation ID fields. To access this information, click the Details icon.
The Event Details page appears, which displays the Metadata and Payload information for a selected event.
Metadata
The Metadata section of the Event Details screen lists the following routing information and information related to the origin of the event:
Event ID
The meaning of Event ID differs in terms of unprocessed event data and event data that has been stored in the Sensor Data Repository. In terms of unprocessed data (that is, the data viewed from a detail page from the Monitor Reports tab which is depicted in Figure 3-21), Event ID refers to the tag ID that triggered the event. When you view the event data that has been stored in the Sensor Data Repository which displays in the Event Report pages (Figure 3-23, Figure 3-24, and Figure 3-25), the Event ID field uniquely identifies an event.
Device Name
The name of the extension (device or filter instance) or application that generates the event.
Source Name
This field identifies the originator of the event. This is an optional field, one set by the client.
Site Name
The site that originally generated the message.
Type
The number value that corresponds to the type of event generated. Event types are grouped as follows:
0 - 99: System Messages
100 - 199: Generic Instructions to Devices
200 - 299: Observations from Devices
500 - 599 Custom messages (not registered)
Table 3-7 describes the registered event types that display in the Type field.
Subtype
The number value that corresponds to the subtype of event. Table 3-7 describes the values that display in the Subtype field.
Description
A text description of the Event Type and its Event Subtype. For example, if the event subtype is 200 (RFID Observation) and its subtype is 2 (tag exits field), then the Description field displays RFID Outfield. If the Event Type is 200 and the Event Subtype is 9 (that is, no explicit message), then the Description field displays the event type 200 message (RFID Observation) followed by the display of the Event Subtype as RFID Observation (subtype 9). Table 3-7 notes the text representations that display in the Description field.
Correlation ID
A unique ID that identifies this thread of events. The correlation ID is used for message responses to a particular client (such as checking if a device functions). Any message response sent back by the client has the same ID. This ID, which is set by the client, correlates the sent event message to the received event message so that it cannot be used as a parameter in the device. This is an optional field.
Table 3-7 Registered Event Types and Related Subtypes
| Event Type | Description | Type Description (As displayed in the Event reports) | Subtypes |
|---|---|---|---|
|
0 |
Unknown; a value of 0 represents a bad event or a system internal event. |
System event |
N/A |
|
1 |
Instructions or commands; message events. |
Instruc return code |
Subtypes include:
|
|
100 |
General instructions. |
Instruction |
Subtypes include:
|
|
101 |
RFID instructions. |
Instruc write |
Subtypes include:
|
|
102 |
Printer instructions. |
Instruc print |
Subtypes include:
|
|
103 |
Lightstack instructions. |
Indicator |
Subtypes include:
|
|
200 |
RFID |
RFID observation |
Subtypes include:
|
|
201 |
RTLS |
RTLS |
Subtypes include:
|
|
202 |
Physical contact |
Physical contact |
1 -- Displays as physical disconnect in the Event Details page. |
|
203 |
Temperature |
Temperature |
Subtypes include:
|
|
204 |
Humidity |
Humidity |
Subtypes include:
|
|
205 |
Weight |
Weight |
1 -- Displays as Weight reading in the Event Details page. |
|
206 |
Tampering |
Tampering |
1 -- Displays as Tampered with in the Event Details page. |
|
207 |
Audio |
Audio |
1 -- Displays as Audio instruction in the Event Details page. |
|
208 |
Message Board |
Message board |
N/A |
|
209 |
PLC |
Automation |
N/A |
|
210 |
Printer Response |
Printer Response |
2 -- Print Successful. Displays as Print Successful in the Event Details page. |
|
211 |
Hazardous Sensors |
Hazardous |
N/A |
|
212 |
Barcode |
Barcode |
1 -- Displays a Barcode read in the Event Details page. |
|
213 |
Radiation |
Radiation |
N/A |
Payload
The Payload section of the Event Details page displays the following fields:
Tag ID
The identity of the item described in this event. The text value of this field identifies a tag (that is, a read or target) to an event instruction.
Data
The tag data (or payload of the event). This is an optional field.
Timestamp
The date and time when the event was generated.
The SES Console enables you to view this event data in real-time from its Monitor Events tab. Clicking the Monitor Events tab displays the Monitor Events page (Figure 3-21).
The Monitor Event page enables you to view all of the inbound event data and the outbound event data that passes through the queue. The event data displayed on this page has not been processed; it has not been sent to the Sensor Data Repository.
|
Tip: The event data displayed in the Monitor Events page is dynamic and often-changing; if data remains static, then devices may not be sending events or receiving instruction events. |
The View Log page (Figure 3-22), which you access from the View Log tab, displays data written to the log according to the severity level selected from the Log Level list located on the Main page (Figure 3-1). For example, if you selected Error from the Main page, then the View Log page only displays error-level messages; if you selected All from the Main page, then the View Log page displays all of the logging data.
Using the View Log page, you can select the log file by date and set the number of rows displayed in this page.
To view log data:
Select the date for the log file from the Logfile list.
If needed, select a log level from the Filter by list.
If needed, enter the number of rows for display in the Rows field.
Click Get Log Data.
The SES Console enables you to track the events that have been processed and stored in the Sensor Data Repository using the pages accessed through the Event Reports tab. These pages enable you to retrieve data based on tag ID, device name, or on the period during which the event passed through the queue. You can refine tag ID and device name searches by building queries that include such search criteria as Event Type and Event Subtype.
When you click the Events Reports tab, the View Tags page (Figure 3-23) appears by default.
You can select other types of event searches using the navigation tree in the View Tags page. The tree appears in all of the pages accessed through the Events Reports tab.
Enter a portion of the tag ID. (This is a like pattern.)
Enter a starting date, or select a starting date using date-time editor. This is an optional condition; leaving this field blank excludes this condition from the search.
Enter a starting time (as hh:mm:ss). This is an optional condition; leaving this field blank excludes this condition from the search.
Enter an ending date, or select an ending date using the date-time editor. This is an optional condition; leaving this field blank excludes this condition from the search.
Enter an ending time (as hh:mm:ss). This is an optional condition; leaving this field blank excludes this condition from the search.
|
Tip: Clicking within the End Time field populates the End Date field with the same value as that entered in the Start Date field. |
Click Fetch Results. The search results appear in the Results table. Clicking the Details icon enables you view a specific event. For more information, see "Refining Tag ID and Device Name Searches". To add conditions to the search, click Advanced Search.
To retrieve events by device name:
Enter the device name (or a portion of the device name). This is a like pattern.
Enter a starting date, or select a starting date using the date-time editor. This is an optional condition; leaving this field blank excludes this condition from the search.
Enter a starting time (as hh:mm:ss). This is an optional condition; leaving this field blank excludes this condition from the search.
Enter an ending date, or select an ending date using the date-time editor. This is an optional condition; leaving this field blank excludes this condition from the search.
Enter an ending time (as hh:mm:ss). This is an optional condition; leaving this field blank excludes this condition from the search.
|
Tip: Clicking within the End Time field populates the End Date field with the same value as that entered in the Start Date field. |
Click Fetch Results. The search results appear in the Results table. Clicking the Details icon enables you view a specific event. For more information, see "Refining Tag ID and Device Name Searches". To add conditions to the search, click Advanced Search.
The Advanced Search button on the View Tags and View Device pages enables you to narrow search results by building query statements.
To add a query statement to a device name or tag ID search:
Enter the tag ID or device name search criteria. If needed, add the time and date constraints for the search.
Click Advanced Search. The Advanced Search page appears, populated with the search criteria entered for either the tag ID or device name.
Figure 3-24 The Advanced Search Page (For a Tag Search)
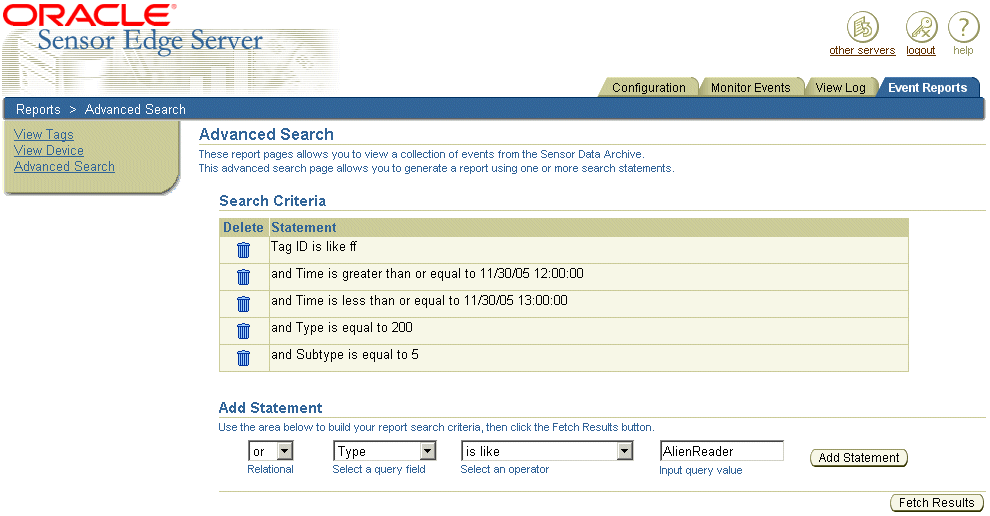
Build the query statements as follows:
Using the Select a query field list, select the event Metadata (such as Event ID, Device Name, Source Name, Site Name, Type, Subtype and Correlation ID) and the Payload (Tag ID, Data, and Time)
Select an operator to compare the search value selected from the Select a query field list to the value entered in the Input query value field. Options include:
is equal to
is not equal to
is less than
is less than or equal to
is greater
is greater than or equal to
is like
Enter a value in the input query value field that is relevant to the option selected in the Select a query field. For example, select Type from the Select a query field and then enter 200 in the input query value field.
Click Add Statement. The query statement appears in the Search Criteria statement section.
Click Fetch Results. The Sensor Data Repository is queried using the search statements. The requested data displays in the Results section of the page. You can sort the data in ascending and descending order by Event ID and by Data. To view an individual event, click the Details icon. For more information, see "Viewing an Individual Event".
The Advanced Search page enables you retrieve specific event data by constructing a query comprised of statements to retrieve event data using the event data's Metadata and Payload information.
To create specific search criteria for event data:
Using the Select a query field list, select the event Metadata (such as Event ID, Device Name, Source Name, Site Name, Type, Subtype and Correlation ID) and the Payload (Tag ID, Data, and Time).
Select an operator to compare the search value selected from the Select a query field list to the value entered in the Input query value field. Options include:
is equal to
is not equal to
is less than
is less than or equal to
is greater
is greater than or equal to
is like
Enter a value in the input query value field that is relevant to the option selected in the Select a query field. For example, select Type from the Select a query field and then enter 200 in the input query value field.
|
Tip: The Relational list appears once you complete a query and click Add Statement. This list enables you to bind the query statements using compound search conditions (and, or, not). Use the trash can icons to remove a query statement. |
Click Add Statement. The search statement appears in the Search Criteria section.
If needed, add other statements.
Click Fetch Results. The Sensor Data Repository is queried using the selected search statements. The results display in the Results section of the page. You can sort the data in ascending and descending order by Event ID and by Data. To view an individual event, click the Details icon. For more information, see "Viewing an Individual Event"
An extension is a custom-built driver, dispatcher or filter which you upload to the Oracle Sensor Edge Server by packaging the component in an Extension Archive file. The Extension Archive file is a JAR file containing all of the class files and native binaries for the driver, filter, or dispatcher, as well as properties files or static data files. In addition, the Extension Archive includes the Extension Archive Descriptor file, an XML file containing instructions for the Oracle Sensor Edge Server on loading and managing the extension.
|
Note: Setting the element content of<IsExtensionMonitorEnabled> to true enables an extension to be dynamically uploaded to the Oracle Sensor Edge Server. You do not have to restart the Oracle Sensor Edge Server. However, for the Oracle Edge Sensor Server to use the instances created from an extension, you must restart the Oracle Edge Sensor Server as described in.
|
Before you can upload a custom extension, such as a driver, dispatcher, or filter, you must package the extension files into an Extension Archive. An Extension Archive contains all of the extension's binaries, startup data, and configuration information. Each Extension Archive contains only one extension implementation, which is loaded at runtime. The Extension Archive contains the following directories:
Meta-INF
This directory contains any meta information about the archive. This directory must include the Extension Archive Descriptor file. The Extension Archive Descriptor file is an XML file located in the META-INF directory that contains the information needed by the Oracle Sensor Edge Server to load and manage the extension.
The Extension Archive Descriptor file is called ext.xml. Example 3-1 illustrates an Extension Archive Descriptor file (ext.xml) for a filter extension called Loop Back Filter.
Example 3-1 The Extension Archive Descriptor File for a Filter Extension
<?xml version="1.0"?>
<Extension>
<name>Loop Back Filter</name>
<version>1.0</version>
<className>oracle.edge.impl.filter.LoopBackFilter</className>
<type>Filter</type>
<Parameters>
        <Parameter name="TagID" defaultValue="" description="The Invalid Tag ID">
            <valueType type="string"/>
        </Parameter>
        <Parameter name="LightStackName" defaultValue="stack1" description="The Light Stack Instance Name">
            <valueType type="string"/>
        </Parameter>
    </Parameters>
Example 3-2 describes a simplified version of the DTD for ext.xml; Table 3-8 describes this DTD's elements.
Example 3-2 The DTD for the Extension Archive Descriptor File
<?xml version="1.0" encoding="UTF-8"?>
<!ELEMENT Extension (name, version, className, type, Parameters)>
<!ELEMENT name (#PCDATA)>
<!ELEMENT version (#PCDATA)>
<!ELEMENT className (#PCDATA)>
<!ELEMENT type (#PCDATA)>
<!ELEMENT Parameters (Parameter+)>
<!ELEMENT Parameter (valueType)>
<!ATTLIST Parameter
  name CDATA #REQUIRED
  displayName CDATA #IMPLIED
  defaultValue CDATA #IMPLIED
  description CDATA #IMPLIED
  encrypted (true|false)  #IMPLIED
  isClearText (true|false) #IMPLIED
  required  (true|false)  #IMPLIED>
<!ELEMENT valueType EMPTY>
<!ATTLIST valueType
 type (int | string | double | boolean) #REQUIRED>
Table 3-8 Elements and Attributes of the DTD for the Extension Archive Descriptor File
| Element | Attribute or Text | Description |
|---|---|---|
|
|
|
Defines the properties of an extension. |
|
|
|
The name of the extension. |
|
|
|
The type of the extension, such as a driver, filter, or dispatcher. Although the match is not case-sensitive, there must be no extra spaces or special characters in the text. The reserved values are: Device, Filter, Dispatcher. |
|
|
|
A text representation of the version number of the extension. |
|
|
|
The name of the class to load and instantiate the driver. This is the entry class that implements one of the standard extension interfaces. You must include a package name to form a fully qualified class name. |
|
|
(Parent of the <Parameter> element.) |
The parameters that users can edit after an extension has been uploaded. |
|
|
Attributes include:
|
|
|
|
|
The type of the parameter (which can be one of the following):
|
classes
This directory includes all of the classes files, native binaries, files, or static data. The classes files packaged into JAR files must be expanded on top of this directory. This release does not support loading JAR libraries.
lib
The Extension Archive file also includes the lib directory, where you specify third-party libraries. Example 3-3 illustrates an Extension Archive file for an Alien device driver, where the lib directory includes the library specific to the Alien device driver, Gateway.jar.
Example 3-3 Extension Archive File for an Alien Device Driver
meta-inf/ext.xml
meta-inf/Manifest.mf
classes/oracle/edge/impl/driver/AlienReader.class
lib/Gateway.jar
To package an Extension Archive file:
Build a sandbox directory. Use this directory as the JAR source directory.
At the top of this directory, create the META-INF and classes directories.
Copy all class files and properties files (if any) to the classes directory. In the META-INF directory, create ext.xml, the Extension Archive Descriptor file.
Archive the files. You can use the JAR tool included in the JDK, or any other standard compression utility. Run the JAR tool from top-level directory of the sandbox. For example, executing jar cvMf test.jar archives the files in the sandbox directory into test.jar. You can then upload test.jar to the Oracle Sensor Edge Server. Do not archive the META-INF and classes directories as part of the sandbox directory. For example, the command c:/work> jar tvf test.jar displays the files in test.jar have been properly archived as follows:
0 Thu Apr 08 14:36:56 PDT 2004 META-INF/
71 Thu Apr 08 14:36:56 PDT 2004 META-INF/ext.xml
0 Thu Apr 08 13:42:52 PDT 2004 classes/
0 Thu Apr 08 13:42:52 PDT 2004 classes/my/
0 Thu Apr 08 13:42:58 PDT 2004 classes/my/test.class
|
Note: No slashes or other directory indicators appear before theMETA-INF and classes directories. Including the entire path in the JAR prevents the Oracle Sensor Edge Server from locating the Extension Archive Descriptor file or the classes. As a result, the extension cannot be deployed.
|
Package the driver, filter, or dispatcher in an Extension Archive File as described in "Adding Extensions to the Oracle Sensor Edge Server Instance".
Copy this JAR file to:
ORACLE_HOME/j2ee/applications/edge/edge/extensions
Restart the Oracle Sensor Edge Server by restarting the OC4J Instance. The extensions display in the tree as available drivers, filters, or dispatchers and can be configured as the Oracle Sensor Edge Server's devices, filter instances, or current dispatcher.
|
Tip: If the<IsExtensionMonitorEnabled> element has been set to true in edgeserver.xml, then you only need to copy the JAR file to ORACLE_HOME/edge/extensions. The running Oracle Sensor Edge Server then picks up the extension automatically and does not need to be stopped and then restarted. Because this method of adding an extension slows performance, it is recommended only for development instances.
In Oracle Application Server 10g (10.1.3), |
All of the extensions of the Oracle Sensor Edge Server are arranged as:
EdgeObject—The basic root class, which contains a unique identifier.
AbstractEdgeExtensionImpl—Implements the EdgeExtension interface.
AbstractDispatcherV2—The base class for all dispatchers.
AbstractDispatcher—Implements AbstractDeviceV2 class to provide basic dispatcher behavior.
SimpleDispatcher—Enables you to build custom dispatchers.
AbstractFilter—The base class for all filters. It implements the Filter interface and defines the monitoring API for filters required to generate events that monitor filter performance.
SimpleFilter—Enables you to write both device-level and device group-level filters.
AbstractDevice—The base class for all devices. It provides its own thread for reading data from the device and processing the read data.
AbstractEventDevice—Extended from AbstractDevice class; provides integration with the device-level filters and implements the required methods to propagate events to the event processor.
SimpleDriver—Provides the common functionality required by most custom drivers. Many of the drivers that ship with Oracle Sensor Edge Server are extended from SimpleDriver.
|
Note: Extend from theSimpleDriver, SimpleFilter, or SimpleDispatcher classes to create an extension.
|
Figure 3-26 illustrates the extension class hierarchy.
The doInit() method implements extensions, as this call initializes the instance of an extension at runtime.
When the instance of an extension is created at runtime, the corresponding Context is created that enables the extension to:
Set (or retrieve) the runtime Context data.
Locate and communicate with other extensions of the Oracle Edge Sensor Server.
Access the system facilities of the Oracle Edge Sensor Server.
Retrieve information about the instance itself.
The base class, EdgeExtension, provides utility functions for an instance to retrieve information about itself. These methods include:
getContext()
Returns the runtime context.
getName()
Returns the name of the extension.
getDescription()
Returns the description of the extension.
getVersion()
Returns the version string of the extension.
An instance of an extension does not hold its own persistent data or configuration; configuration data is passed in at runtime when the instance is initialized. The configuration data is defined as parameters, which are composed of name/value pairs. Each parameter has a unique name and an optional value.
|
Note: This release of the Oracle Sensor Edge Server does not directly support trees or arrays of values. You are responsible for un-marshalling the data when forming non-scalar type data. |
Extensions often have specific configurations. For example, a driver might include such configuration parameters as serial port name, baud rate, IP address, port number, login and password. These parameters must be defined to enable the driver to communicate with the device.
To expose parameters for a driver implementation, you must modify the Extension Archive Descriptor file. Example 3-4 illustrates a device that has two parameters that can be configured: serial port name and baud rate, defined within the <Parameter> extract tags.
Example 3-4 An Extension Archive Descriptor File with Exposed Parameters
<Extension>
         <name>My Driver</name>
         <type>Device</type>
         <className>my.testdriver</className>
         <Parameters>
                   <Parameter name="port" displayName="Serial Port">
                          <valueType type="string"/>
                   </Parameter>
                   <Parameter name="baud" displayName="Baud Rate">
                         <valueType type="int"/>
                   </Parameter>
         </Parameters>
</Extension>
Once you have defined the Extension Archive Descriptor file's <Parameter> tags, you can fetch the values for the parameters using the EdgeExtensionConfigInfo object. The values defined within the <Parameter> tags are retrieved using the Context object (illustrated in Example 3-5).
Example 3-5 Retrieving Parameter Values Using the Context Object
EdgeExtensionContext context = super.getContext();
ConfigParameter filenameParam = ct.getParameter( fileName );
The getParameter() method returns a ConfigParameter object. The getParameter() method returns the value for a parameter. (In Example 3-5, the ConfigParamter object is called filenameParam and the getParameter() method returns the value for a parameter called fileName.)The name of the target parameter must be passed to the ConfigParameter object. Further, the name of this parameter must match the name given to the name attribute of the <Parameter> element of the Extension Archive Descriptor file. Once you obtain the ConfigParameter object, you can get the value of the parameter (illustrated in Example 3-6).
|
Note: ThegetStringValue()method returns the string value of the parameter. If the value for the parameter is an int, call the getIntegerValue() method, which returns an integer object.
|