11 Comparing SQL Trials
After the post-change SQL performance data is built, you can compare the performance data collected in the pre-change SQL trial to the post-change SQL trial by running a comparison analysis using SQL Performance Analyzer. After the comparison analysis is completed, you can generate a report to identify the SQL statements that have improved, remained unchanged, or regressed after the system change. For more information, see "Comparing Performance Measurements".
This chapter describes how to compare and analyze the performance data from the pre-change and post-change SQL trials and contains the following topics:
Note:
The primary interface for comparing SQL trials is Oracle Enterprise Manager. If for some reason Oracle Enterprise Manager is unavailable, you can compare SQL trials using theDBMS_SQLPA PL/SQL package.Tip:
Before comparing SQL trials, you need to create a post-change SQL trial, as described in Chapter 10, "Creating a Post-Change SQL Trial".Comparing SQL Trials Using Oracle Enterprise Manager
Comparing SQL trials using Oracle Enterprise Manager involves the following steps:
-
Reviewing the SQL Performance Analyzer Report Using Oracle Enterprise Manager
-
Tuning Regressed SQL Statements Using Oracle Enterprise Manager
Analyzing SQL Performance Using Oracle Enterprise Manager
To analyze SQL performance before and after the system change using Oracle Enterprise Manager:
-
On the Guided Workflow page, click the Execute icon for Compare Step 2 and Step 3.
The Run SQL Trial Comparison page appears.
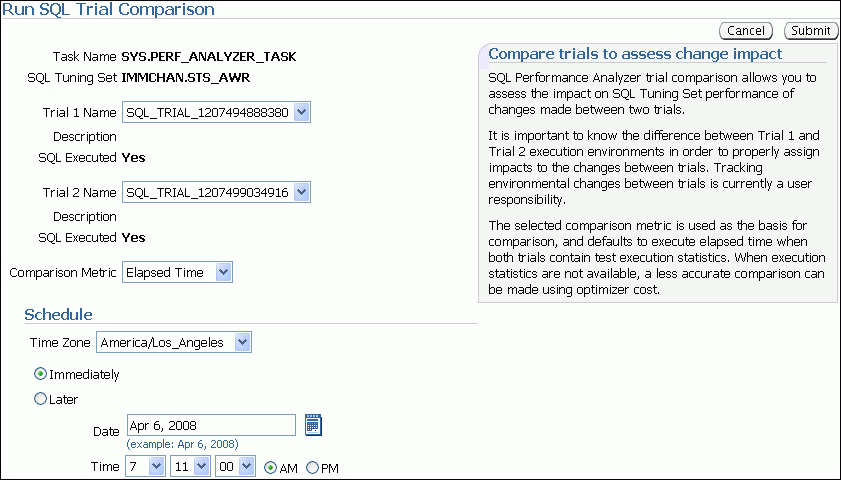
Description of the illustration spa_run_trial_compare.gif
In this example, the
SQL_TRIAL_1207494888380andSQL_TRIAL_1207499034916trials are selected for comparison. -
To compare trials other than those listed by default, select the desired trials in the Trial 1 Name and Trial 2 Name lists.
Note that you cannot compare a statistical trial with a trial that tests the explain plan only.
-
In the Comparison Metric list, select the comparison metric to use for the comparison analysis:
-
Elapsed Time
-
CPU Time
-
Buffer Gets
-
Disk Reads
-
Direct Writes
-
Optimizer Cost
Optimizer Cost is the only comparison metric available if you generated execution plans only in the SQL trials.
To perform the comparison analysis by using more than one comparison metric, perform separate comparison analyses by repeating this procedure with different metrics.
-
-
In the Schedule section:
-
In the Time Zone list, select your time zone code.
-
Select Immediately to start the task now, or Later to schedule the task to start at a time specified using the Date and Time fields.
-
-
Click Submit.
The Guided Workflow page appears when the comparison analysis begins.
The status icon of this step changes to an arrow icon while the comparison analysis is in progress. To refresh the status icon, click Refresh. Depending on the amount of performance data collected from the pre-change and post-change executions, the comparison analysis may take a long time to complete. After the comparison analysis is completed, the Status icon changes to a check mark and the Execute icon for the next step is enabled.
-
Once SQL Performance Analyzer has analyzed the pre-change and post-change performance data, generate a SQL Performance Analyzer report that you can use for further analysis, as described in "Reviewing the SQL Performance Analyzer Report Using Oracle Enterprise Manager".
Reviewing the SQL Performance Analyzer Report Using Oracle Enterprise Manager
When a SQL Performance Analyzer task is completed, the resulting data is generated into a SQL Performance Analyzer report that compares the pre-change and post-change SQL performance.
Figure 11-1 shows a sample SQL Performance Analyzer report. This sample report uses the elapsed time comparison metric to compare the pre-change and post-change executions of a SQL workload.
Figure 11-1 SQL Performance Analyzer Report
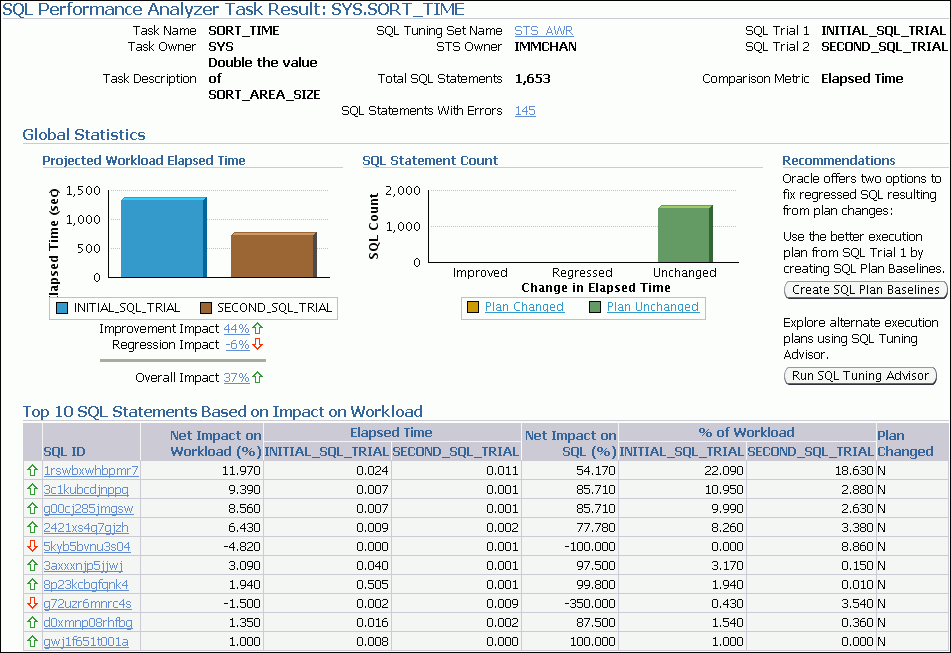
Description of "Figure 11-1 SQL Performance Analyzer Report"
Tip:
Before you can view the SQL Performance Analyzer report, compare the pre-change version of performance data with the post-change version, as described in "Comparing SQL Trials Using Oracle Enterprise Manager"To generate and review the SQL Performance Analyzer report:
-
On the Guided Workflow page, click the Execute icon for View Trial Comparison Report.
The SQL Performance Analyzer Task Result page appears.
-
Review the general information about the performance analysis, as described in "Reviewing the SQL Performance Analyzer Report: General Information".
-
Review general statistics, as described in "Reviewing the SQL Performance Analyzer Report: Global Statistics".
-
Optionally, review the detailed statistics, as described in "Reviewing the SQL Performance Analyzer Report: Global Statistics Details".
Reviewing the SQL Performance Analyzer Report: General Information
The General Information section contains basic information and metadata about the workload comparison performed by SQL Performance Analyzer.
To review general information:
-
On the SQL Performance Analyzer Task Result page, review the summary at the top of the page, which includes the following information.

Description of the illustration spa_task_result_info.gif
This summary includes the following information:
-
The name, owner, and description of the SQL Performance Analyzer task
-
The name and owner of the SQL tuning set
-
The total number of SQL statements in the tuning set and the number of failing statements
-
The names of the SQL trials and the comparison metric used
-
-
Optionally, click the link next to SQL Tuning Set Name.
The SQL Tuning Set page appears.
This page contains information—such as SQL ID and SQL text—about every SQL statement in the SQL tuning set.
-
Click the link next to SQL Statements With Errors if errors were found.
The SQL Performance Analyzer Task Result page appears.
The Errors table reports all errors that occurred while executing a given SQL workload. An error may be reported at the SQL tuning set level if it is common to all SQL executions in the SQL tuning set, or at the execution level if it is specific to a SQL statement or execution plan.
-
Review the global statistics, as described in "Reviewing the SQL Performance Analyzer Report: Global Statistics".
Reviewing the SQL Performance Analyzer Report: Global Statistics
The Global Statistics section reports statistics that describe the overall performance of the entire SQL workload. This section is a very important part of the SQL Performance Analyzer analysis, because it reports on the impact of the system change on the overall performance of the SQL workload. Use the information in this section to understand the tendency of the workload performance, and determine how it will be affected by the system change.
To review global statistics:
-
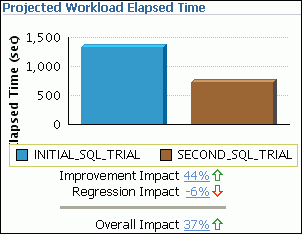
Review the chart in the Projected Workload Elapsed Time subsection.
The chart shows the two trials on the x-axis and the elapsed time (in seconds) on the y-axis.
Description of the illustration spa_task_result_elapsed.gif
The most important statistic is the overall impact, which is given as a percentage. The overall impact is the difference between the improvement impact and the regression impact. You can click the link for any impact statistic to obtain more details, as described in "Reviewing the SQL Performance Analyzer Report: Global Statistics Details".
In this example, the improvement impact is 44%, while the regression impact is -6%, so the overall impact of the system change is an improvement of approximately 37%.
-
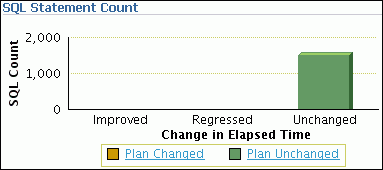
Review the chart in the SQL Statement Count subsection.
The x-axis of the chart shows the number of SQL statements whose performance improved, regressed, or remain unchanged after the system change. The y-axis shows the number of SQL statements. The chart also indicates whether the explain plans changed for the SQL statements.
Description of the illustration spa_task_result_sqlcount.gif
This chart enables you to quickly weigh the relative performance of the SQL statements. You can click any bar in the chart to obtain more details, as described in "Reviewing the SQL Performance Analyzer Report: Global Statistics Details".
In this example, all SQL statements were unchanged after the system change.
Reviewing the SQL Performance Analyzer Report: Global Statistics Details
You can use the SQL Performance Analyzer Report to obtain detailed statistics for the SQL workload comparison. The details chart enables you to drill down into the performance of SQL statements that appears in the report. Use the information in this section to investigate why the performance of a particular SQL statement regressed.
To review global statistics details:
-
In the Projected Workload Elapsed Time subsection, click the impact percentage of the SQL statements for which you want to view details. To view SQL statements whose performance:
-
Improved, click the percentage for Improvement Impact
-
Regressed, click the percentage for Regression Impact
-
Improved or regressed, click the percentage for Overall Impact
A table including the detailed statistics appears. Depending on the type of SQL statements chosen, the following columns are included:
-
SQL ID
This column indicates the ID of the SQL statement.
-
Net Impact on Workload (%)
This column indicates the impact of the system change relative to the performance of the SQL workload.
-
Elapsed Time
This column indicates the total time (in seconds) of the SQL statement execution.
-
Net Impact on SQL (%)
This column indicates the local impact of the change on the performance of a particular SQL statement.
-
% of Workload
This column indicates the percentage of the total workload consumed by this SQL statement.
-
Plan Changed
This column indicates whether the SQL execution plan changed.
-
-
To view details about a particular SQL statement, click the SQL ID link for the SQL statement that you are interested in.
The SQL Details page appears.
You can use this page to access the SQL text and obtain low-level details about the SQL statement, such as CPU time, buffer gets, and optimizer cost.
Tuning Regressed SQL Statements Using Oracle Enterprise Manager
After reviewing the SQL Performance Analyzer report, you should tune any regressed SQL statements that are identified after comparing the SQL performance. If there are large numbers of SQL statements that appear to have regressed, you should try to identify the root cause and make system-level changes to rectify the problem. In cases when only a few SQL statements have regressed, consider using one of the following tuning methods to implement a point solution for them:
After tuning the regressed SQL statements, you should test these changes using SQL Performance Analyzer. Run a new SQL trial on the test system, followed by a second comparison (between this new SQL trial and the first SQL trial) to validate your results. Once SQL Performance Analyzer shows that performance has stabilized, the testing is complete. Implement the fixes from this step to your production system.
Creating SQL Plan Baselines
Creating SQL plan baselines enables the optimizer to avoid performance regressions by using better execution plans.
To create SQL plan baselines:
-
On the SQL Performance Analyzer Task Result page, under Recommendations, click Create SQL Plan Baselines.
The Create SQL Plan Baselines page appears. The Regressed SQL Statements section lists the regressed SQL statements that will be associated with the new SQL plan baselines.
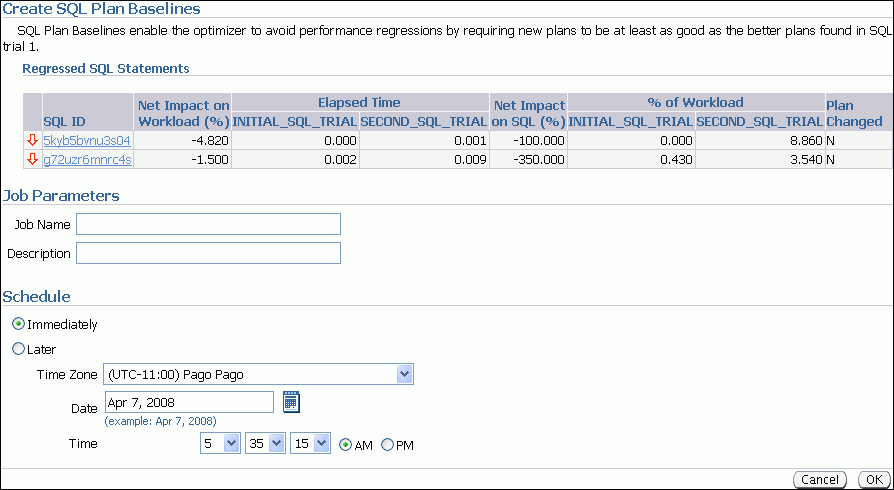
Description of the illustration create_sql_plan_baselines.gif
-
Under Job Parameters, specify the parameters for the job:
-
In the Job Name field, enter a name for the job.
-
In the Description field, optionally enter a description for the job.
-
-
Under Schedule, select:
-
Immediately to start the job now.
-
Later to schedule the job to start at a time specified using the Time Zone, Date, and Time fields.
-
-
Click OK.
The SQL Performance Analyzer Task Result page appears. A message is displayed to inform you that the job has been submitted successfully.
See Also:
-
Oracle Database 2 Day + Performance Tuning Guide for information about creating and managing SQL plan baselines
Running SQL Tuning Advisor
Running SQL Tuning Advisor explores alternate execution plans that may prevent performance regressions.
To run SQL Tuning Advisor:
-
On the SQL Performance Analyzer Task Result page, under Recommendations, click Run SQL Tuning Advisor.
The Schedule SQL Tuning Task page appears.
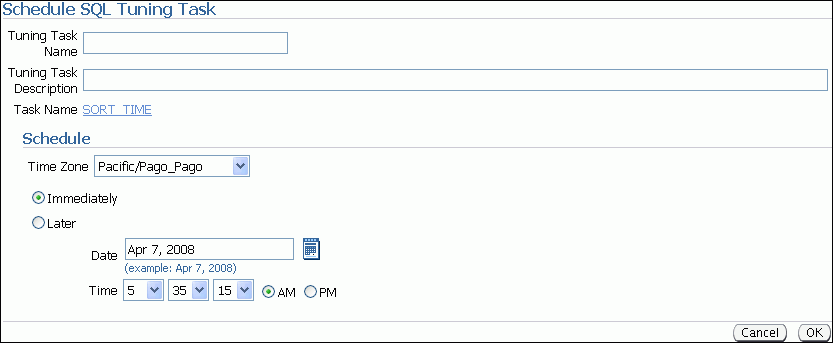
Description of the illustration schedule_sql_tuning.gif
-
In the Tuning Task Name field, enter a name for the SQL tuning task.
-
In the Tuning Task Description field, optionally enter a name for the SQL tuning task.
-
Under Schedule, select:
-
Immediately to start the job now.
-
Later to schedule the job to start at a time specified using the Time Zone, Date, and Time fields.
-
-
Click OK.
The SQL Performance Analyzer Task Result page appears. A link to the SQL tuning report appears under Recommendations.
-
To view the SQL tuning report, click the SQL Tune Report link.
The SQL Tuning Results page appears.
See Also:
-
Oracle Database 2 Day + Performance Tuning Guide for information about running the SQL Tuning Advisor
Comparing SQL Trials Using APIs
Comparing SQL trials using APIs involves the following steps:
Analyzing SQL Performance Using APIs
After the post-change SQL performance data is built, you can compare the pre-change version of performance data to the post-change version. Run a comparison analysis using the DBMS_SQLPA.EXECUTE_ANALYSIS_TASK procedure or function.
To compare the pre-change and post-change SQL performance data:
-
Call the
EXECUTE_ANALYSIS_TASKprocedure or function using the following parameters:-
Set the
task_nameparameter to the name of the SQL Performance Analyzer task. -
Set the
execution_typeparameter toCOMPARE PERFORMANCE. This setting will analyze and compare two versions of SQL performance data. -
Specify a name to identify the execution using the
execution_nameparameter. If not specified, it will be generated by SQL Performance Analyzer and returned by the function. -
Specify two versions of SQL performance data using the
execution_paramsparameters. Theexecution_paramsparameters are specified as (name, value) pairs for the specified execution. Set the execution parameters that are related to comparing and analyzing SQL performance data as follows:-
Set the
execution_name1parameter to the name of the first execution (before the system change was made). This value should correspond to the value of theexecution_nameparameter specified in "Creating a Pre-Change SQL Trial Using APIs". -
Set the
execution_name2parameter to the name of the second execution (after the system change was made). This value should correspond to the value of theexecution_nameparameter specified in "Creating a Post-Change SQL Trial Using APIs" when you executed the SQL workload after the system change. If the caller does not specify the executions, then by default SQL Performance Analyzer will always compare the last two task executions. -
Set the
comparison_metricparameter to specify an expression of execution statistics to use in the performance impact analysis. Possible values include the following metrics or any combination of them:elapsed_time(default),cpu_time,buffer_gets,disk_reads,direct_writes, andoptimizer_cost.
For other possible parameters that you can set for comparison, see the description of the
DBMS_SQLPApackage in Oracle Database PL/SQL Packages and Types Reference. -
The following example illustrates a function call:
EXEC DBMS_SQLPA.EXECUTE_ANALYSIS_TASK(task_name => 'my_spa_task', - execution_type => 'COMPARE PERFORMANCE', - execution_name => 'my_exec_compare', - execution_params => dbms_advisor.arglist(- 'comparison_metric', 'buffer_gets')); -
-
Call the
DBMS_SQLPA.REPORT_ANALYSIS_TASKfunction using the following parameters:-
Set the
task_nameparameter to the name of the SQL Performance Analyzer task. -
Set the
execution_nameparameter to the name of the execution to use. This value should match theexecution_nameparameter of the execution for which you want to generate a report.To generate a report to display the results of:
-
Execution plans generated for the SQL workload, set this value to match the
execution_nameparameter of the desiredEXPLAIN PLANexecution. -
Execution plans and execution statistics generated for the SQL workload, set this parameter to match the value of the
execution_nameparameter used in the desiredTEST EXECUTEexecution. -
A comparison analysis, set this value to match the
execution_nameparameter of the desiredANALYZE PERFORMANCEexecution.
If unspecified, SQL Performance Analyzer generates a report for the last execution.
-
-
Set the
typeparameter to specify the type of report to generate. Possible values includeTEXT(default),HTML, andXML. -
Set the
levelparameter to specify the format of the recommendations. Possible values includeTYPICAL(default),BASIC,IMPROVED,REGRESSED,CHANGED_PLANS,ERRORS, andALL. -
Set the
sectionparameter to specify a particular section to generate in the report. Possible values includeSUMMARY(default) andALL. -
Set the
top_sqlparameter to specify the number of SQL statements in a SQL tuning set to generate in the report. By default, the report shows the top 100 SQL statements impacted by the system change.
The following example illustrates a portion of a SQL script that you could use to create and display a comparison summary report:
VAR rep CLOB; EXEC :rep := DBMS_SQLPA.REPORT_ANALYSIS_TASK('my_spa_task', - 'text', 'typical', 'summary'); SET LONG 100000 LONGCHUNKSIZE 100000 LINESIZE 130 PRINT :rep -
-
Review the SQL Performance Analyzer report, as described in "Reviewing the SQL Performance Analyzer Report Using APIs".
See Also:
-
Oracle Database PL/SQL Packages and Types Reference for information about the
DBMS_SQLPA.EXECUTE_ANALYSIS_TASKandDBMS_SQLPA.REPORT_ANALYSIS_TASKfunctions
Reviewing the SQL Performance Analyzer Report Using APIs
The SQL Performance Analyzer report is divided into the following sections:
This section uses a sample report to illustrate how to review the SQL Performance Analyzer report. The sample report uses buffer_gets as the comparison metric to compare the pre-change and post-change executions of a SQL workload.
General Information
The General Information section contains basic information and metadata about the SQL Performance Analyzer task, the SQL tuning set used, and the pre-change and post-change executions. Example 11-1 shows the General Information section of a sample report.
Example 11-1 General Information
---------------------------------------------------------------------------------------------
General Information
---------------------------------------------------------------------------------------------

 Task Information:                              Workload Information:
 ---------------------------------------------  ---------------------------------------------
  Task Name    : my_spa_task                     SQL Tuning Set Name        : my_sts
  Task Owner   : APPS                            SQL Tuning Set Owner       : APPS
  Description  :                                 Total SQL Statement Count  : 101

Execution Information:
---------------------------------------------------------------------------------------------
  Execution Name  : my_exec_compare        Started             : 05/21/2007 11:30:09
  Execution Type  : ANALYZE PERFORMANCE    Last Updated        : 05/21/2007 11:30:10
  Description     :                        Global Time Limit   : UNLIMITED
  Scope           : COMPREHENSIVE          Per-SQL Time Limit  : UNUSED
  Status          : COMPLETED              Number of Errors    : 0

Analysis Information:
---------------------------------------------------------------------------------------------
 Comparison Metric: BUFFER_GETS
 ------------------
 Workload Impact Threshold: 1%
 --------------------------
 SQL Impact Threshold: 1%
 ----------------------
 Before Change Execution:                       After Change Execution:
 ---------------------------------------------  ---------------------------------------------
  Execution Name      : my_exec_BEFORE_change    Execution Name      : my_exec_AFTER_change
  Execution Type      : TEST EXECUTE             Execution Type      : TEST EXECUTE
  Description         :                          Description         :
  Scope               : COMPREHENSIVE            Scope               : COMPREHENSIVE
  Status              : COMPLETED                Status              : COMPLETED
  Started             : 05/21/2007 11:22:06      Started             : 05/21/2007 11:25:56
  Last Updated        : 05/21/2007 11:24:01      Last Updated        : 05/21/2007 11:28:30
  Global Time Limit   : 1800                     Global Time Limit   : 1800
  Per-SQL Time Limit  : UNUSED                   Per-SQL Time Limit  : UNUSED
  Number of Errors    : 0                        Number of Errors    : 0

---------------------------------------------------------------------------------------------
In Example 11-1, the Task Information section indicates that the task name is my_spa_task. The Workload Information section indicates that the task compares executions of the my_sts SQL tuning set, which contains 101 SQL statements. As shown in the Execution Information section, the comparison execution is named my_exec_compare.
The Analysis Information sections shows that SQL Performance Analyzer compares two executions of the my_sts SQL tuning set, my_exec_BEFORE_change and my_exec_AFTER_change, using buffer_gets as a comparison metric.
Result Summary
The Result Summary section summarizes the results of the SQL Performance Analyzer task. The Result Summary section is divided into the following subsections:
Overall Performance Statistics
The Overall Performance Statistics subsection displays statistics about the overall performance of the entire SQL workload. This section is a very important part of the SQL Performance Analyzer analysis because it shows the impact of the system change on the overall performance of the SQL workload. Use the information in this section to understand the change of the workload performance, and determine whether the workload performance will improve or degrade after making the system change.
Example 11-2 shows the Overall Performance Statistics subsection of a sample report.
Example 11-2 Overall Performance Statistics
Report Summary
---------------------------------------------------------------------------------------------

Projected Workload Change Impact:
-------------------------------------------
 Overall Impact      :   47.94%
 Improvement Impact  :   58.02%
 Regression Impact   :  -10.08%

SQL Statement Count
-------------------------------------------
 SQL Category  SQL Count  Plan Change Count
 Overall       101        6
 Improved      2          2
 Regressed     1          1
 Unchanged     98         3
.
.
.
---------------------------------------------------------------------------------------------
This example indicates that the overall performance of the SQL workload improved by 47.94%, even though regressions had a negative impact of -10.08%. After the system change, 2 of the 101 SQL statements ran faster, while 1 ran slower. Performance of 98 statements remained unchanged.
Performance Statistics of SQL Statements
The Performance Statistics subsection highlights the SQL statements that are the most impacted by the system change. The pre-change and post-change performance data for each SQL statement in the workload are compared based on the following criteria:
-
Weight, or importance, of each SQL statement
-
Impact of the system change on each SQL statement relative to the entire SQL workload
-
Impact of the system change on each SQL statement
-
Whether the structure of the execution plan for each SQL statement has changed
Example 11-3 shows the Performance Statistics of SQL Statements subsection of a sample report. The report has been altered slightly to fit on the page.
Example 11-3 Performance Statistics of SQL Statements
SQL Statements Sorted by their Absolute Value of Change Impact on the Workload
--------------------------------------------------------------------------------------
---------------------------------------------------------------------------------------------
|        |               | Impact | Metric  | Metric  | Impact | % Wrkld | % Wrkld | Plan   |
| obj_id | sql_id        | Wrkld  | Before  | After   | on SQL | Before  | After   | Change |
---------------------------------------------------------------------------------------------
| 205    | 73s2sgy2svfrw |  29.01%| 1681683 |  220590 | 86.88% |   33.39% |  8.42% |   y    |
| 206    | gq2a407mv2hsy |  29.01%| 1681683 |  220590 | 86.88% |   33.39% |  8.42% |   y    |
| 204    | 2wtgxbjz6u2by | -10.08%| 1653012 | 2160529 | -30.7% |   32.82% | 82.48% |   y    |
---------------------------------------------------------------------------------------------
The SQL statements are sorted in descending order by the absolute value of the net impact on the SQL workload, that is, the sort order does not depend on whether the impact was positive or negative.
Errors
The Errors subsection reports all errors that occurred during an execution. An error may be reported at the SQL tuning set level if it is common to all executions in the SQL tuning set, or at the execution level if it is specific to a SQL statement or execution plan.
Example 11-4 shows an example of the Errors subsection of a SQL Performance Analyzer report.
----------------------------------------------------------------------------------
                             SQL STATEMENTS WITH ERRORS
----------------------------------------------------------------------------------
SQL ID        Error
------------- --------------------------------------------------------------------
47bjmcdtw6htn ORA-00942: table or view does not exist
br61bjp4tnf7y ORA-00920: invalid relational operator
----------------------------------------------------------------------------------
Result Details
The Result Details section represents a drill-down into the performance of SQL statements that appears in the Result Summary section of the report. Use the information in this section to investigate why the performance of a particular SQL statement regressed.
This section will contain an entry of every SQL statement processed in the SQL performance impact analysis. Each entry is organized into the following subsections:
SQL Details
This section of the report summarizes the SQL statement, listing its information and execution details.
Example 11-5 shows the SQL Details subsection of a sample report.
SQL Details:
-----------------------------
 Object ID            : 204
 Schema Name          : APPS
 SQL ID               : 2wtgxbjz6u2by
 Execution Frequency  : 1
 SQL Text             : SELECT /* my_query_14_scott */ /*+ ORDERED INDEX(t1)
                        USE_HASH(t1) */ 'B' || t2.pg_featurevalue_05_id
                        pg_featurevalue_05_id, 'r' || t4.elementrange_id
                        pg_featurevalue_15_id, 'G' || t5.elementgroup_id
                        pg_featurevalue_01_id, 'r' || t6.elementrange_id . . .
.
.
.
---------------------------------------------------------------------------------------------
In Example 11-5, the report summarizes the regressed SQL statement whose ID is 2wtgxbjz6u2by and corresponding object ID is 204.
Single Execution Statistics
The Single Execution Statistics subsection compares execution statistics of the SQL statement from the pre-change and post-change executions and then summarizes the findings.
Example 11-6 shows the Single Execution Statistics subsection of a sample report.
Example 11-6 Single Execution Statistics
Execution Statistics:
-----------------------------
---------------------------------------------------------------------------------------
|              | Impact on | Value   | Value   | Impact     | % Workload | % Workload |
| Stat Name    | Workload  | Before  | After   | on SQL     | Before     | After      |
---------------------------------------------------------------------------------------
| elapsed_time |    -95.54%|  36.484 | 143.161 |   -292.39% |     32.68% |     94.73% |
| parse_time   |    -12.37%|    .004 |    .062 |     -1450% |       .85% |     11.79% |
| exec_elapsed |    -95.89%|   36.48 | 143.099 |   -292.27% |     32.81% |     95.02% |
| exec_cpu     |    -19.73%|  36.467 |  58.345 |    -59.99% |     32.89% |     88.58% |
| buffer_gets  |    -10.08%| 1653012 | 2160529 |     -30.7% |     32.82% |     82.48% |
| cost         |     12.17%|   11224 |    2771 |     75.31% |     16.16% |      4.66% |
| reads        |  -1825.72%|    4091 |  455280 | -11028.82% |     16.55% |     96.66% |
| writes       |     -1500%|       0 |      15 |     -1500% |         0% |       100% |
| rows         |           |     135 |     135 |            |            |            |
---------------------------------------------------------------------------------------

Findings (2):
-----------------------------
 1. The performance of this SQL has regressed.
 2. The structure of the SQL execution plan has changed.
---------------------------------------------------------------------------------------------
Execution Plans
The Execution Plans subsection displays the pre-change and post-change execution plans for the SQL statement. In cases when the performance regressed, this section also contains findings on root causes and symptoms.
Example 11-7 shows the Execution Plans subsection of a sample report.
Execution Plan Before Change:
-----------------------------
 Plan Id          : 1
 Plan Hash Value  : 3412943215

----------------------------------------------------------------------------------------------------------
| Id   | Operation                           | Name                | Rows   | Bytes   | Cost  | Time     |
----------------------------------------------------------------------------------------------------------
|    0 | SELECT STATEMENT                    |                     |      1 |     126 | 11224 | 00:02:15 |
|    1 |   HASH GROUP BY                     |                     |      1 |     126 | 11224 | 00:02:15 |
|    2 |    NESTED LOOPS                     |                     |      1 |     126 | 11223 | 00:02:15 |
|  * 3 |     HASH JOIN                       |                     |      1 |     111 | 11175 | 00:02:15 |
|  * 4 |      TABLE ACCESS FULL              | LU_ELEMENTGROUP_REL |      1 |      11 |   162 | 00:00:02 |
|  * 5 |      HASH JOIN                      |                     |    487 |   48700 | 11012 | 00:02:13 |
|    6 |       MERGE JOIN                    |                     |     14 |     924 |  1068 | 00:00:13 |
|    7 |        SORT JOIN                    |                     |   5391 |  274941 |  1033 | 00:00:13 |
|  * 8 |         HASH JOIN                   |                     |   5391 |  274941 |   904 | 00:00:11 |
|  * 9 |          TABLE ACCESS FULL          | LU_ELEMENTGROUP_REL |    123 |    1353 |   175 | 00:00:03 |
| * 10 |          HASH JOIN                  |                     |   5352 |  214080 |   729 | 00:00:09 |
| * 11 |           TABLE ACCESS FULL         | LU_ITEM_293         |   5355 |  128520 |    56 | 00:00:01 |
| * 12 |           TABLE ACCESS FULL         | ADM_PG_FEATUREVALUE |   1629 |   26064 |   649 | 00:00:08 |
| * 13 |        FILTER                       |                     |        |         |       |          |
| * 14 |         SORT JOIN                   |                     |      1 |      15 |    36 | 00:00:01 |
| * 15 |          TABLE ACCESS FULL          | LU_ELEMENTRANGE_REL |      1 |      15 |    35 | 00:00:01 |
|   16 |       INLIST ITERATOR               |                     |        |         |       |          |
| * 17 |        TABLE ACCESS BY INDEX ROWID  | FACT_PD_OUT_ITM_293 | 191837 | 6522458 |  9927 | 00:02:00 |
|   18 |         BITMAP CONVERSION TO ROWIDS |                     |        |         |       |          |
| * 19 |          BITMAP INDEX SINGLE VALUE  | FACT_274_PER_IDX    |        |         |       |          |
| * 20 |     TABLE ACCESS FULL               | LU_ELEMENTRANGE_REL |      1 |      15 |    49 | 00:00:01 |
----------------------------------------------------------------------------------------------------------
.
.
.

Execution Plan After Change:
-----------------------------
 Plan Id          : 102
 Plan Hash Value  : 1923145679

------------------------------------------------------------------------------------------------------
| Id   | Operation                           | Name                | Rows | Bytes  | Cost | Time     |
------------------------------------------------------------------------------------------------------
|    0 | SELECT STATEMENT                    |                     |    1 |    126 | 2771 | 00:00:34 |
|    1 |   HASH GROUP BY                     |                     |    1 |    126 | 2771 | 00:00:34 |
|    2 |    NESTED LOOPS                     |                     |    1 |    126 | 2770 | 00:00:34 |
|  * 3 |     HASH JOIN                       |                     |    1 |    111 | 2722 | 00:00:33 |
|  * 4 |      HASH JOIN                      |                     |    1 |    100 | 2547 | 00:00:31 |
|  * 5 |       TABLE ACCESS FULL             | LU_ELEMENTGROUP_REL |    1 |     11 |  162 | 00:00:02 |
|    6 |       NESTED LOOPS                  |                     |      |        |      |          |
|    7 |        NESTED LOOPS                 |                     |  484 |  43076 | 2384 | 00:00:29 |
|  * 8 |         HASH JOIN                   |                     |   14 |    770 |  741 | 00:00:09 |
|    9 |          NESTED LOOPS               |                     |    4 |    124 |  683 | 00:00:09 |
| * 10 |           TABLE ACCESS FULL         | LU_ELEMENTRANGE_REL |    1 |     15 |   35 | 00:00:01 |
| * 11 |           TABLE ACCESS FULL         | ADM_PG_FEATUREVALUE |    4 |     64 |  649 | 00:00:08 |
| * 12 |          TABLE ACCESS FULL          | LU_ITEM_293         | 5355 | 128520 |   56 | 00:00:01 |
|   13 |         BITMAP CONVERSION TO ROWIDS |                     |      |        |      |          |
| * 14 |          BITMAP INDEX SINGLE VALUE  | FACT_274_ITEM_IDX   |      |        |      |          |
| * 15 |        TABLE ACCESS BY INDEX ROWID  | FACT_PD_OUT_ITM_293 |   36 |   1224 | 2384 | 00:00:29 |
| * 16 |      TABLE ACCESS FULL              | LU_ELEMENTGROUP_REL |  123 |   1353 |  175 | 00:00:03 |
| * 17 |     TABLE ACCESS FULL               | LU_ELEMENTRANGE_REL |    1 |     15 |   49 | 00:00:01 |
------------------------------------------------------------------------------------------------------
Tuning Regressed SQL Statements Using APIs
After reviewing the SQL Performance Analyzer report, you should tune any regressed SQL statements that are identified after comparing the SQL performance. If there are large numbers of SQL statements that appear to have regressed, you should try to identify the root cause and make system-level changes to rectify the problem. In cases when only a few SQL statements have regressed, consider using the SQL Tuning Advisor or SQL plan baselines to implement a point solution for them.
After tuning the regressed SQL statements, you should test these changes using SQL Performance Analyzer. Run a new SQL trial on the test system, followed by a second comparison (between this new SQL trial and the first SQL trial) to validate your results. Once SQL Performance Analyzer shows that performance has stabilized, the testing is complete. Implement the fixes from this step to your production system.
See Also:
-
Oracle Database Performance Tuning Guide for information about using the SQL Tuning Advisor
-
Oracle Database Performance Tuning Guide for information about using SQL plan baselines
Using SQL Performance Analyzer Views
You can query the following views to monitor SQL Performance Analyzer and view its analysis results:
Note:
The information available in these views are also contained in the SQL Performance Analyzer report. It is recommended that you use the SQL Performance Analyzer report to view analysis results instead. Consider using these views only for performing more advanced analysis of the results.-
The
DBA_ADVISOR_TASKSandUSER_ADVISOR_TASKSviews display descriptive information about the SQL Performance Analyzer task that was created. -
The
DBA_ADVISOR_EXECUTIONSandUSER_ADVISOR_EXECUTIONSviews display information about task executions. SQL Performance Analyzer creates at least three executions to analyze the SQL performance impact caused by a database change on a SQL workload. The first execution collects a pre-change version of the performance data. The second execution collects a post-change version of the performance data. The third execution performs the comparison analysis. -
The
DBA_ADVISOR_FINDINGSandUSER_ADVISOR_FINDINGSviews display the SQL Performance Analyzer findings. SQL Performance Analyzer generates the following types of findings:-
Problems, such as performance regression
-
Symptoms, such as when the structure of an execution plan has changed
-
Errors, such as nonexistence of an object or view
-
Informative messages, such as when the structure of an execution plan in the pre-change version is different than the one stored in the SQL tuning set
-
-
The
DBA_ADVISOR_SQLPLANSandUSER_ADVISOR_SQLPLANSviews display a list of all execution plans. -
The
DBA_ADVISOR_SQLSTATSandUSER_ADVISOR_SQLSTATSviews display a list of all SQL compilations and execution statistics. -
The
V$ADVISOR_PROGRESSview displays the operation progress of SQL Performance Analyzer. Use this view to monitor how many SQL statements have completed or are awaiting execution in a SQL trial.
You must have the SELECT_CATALOG_ROLE role to access the DBA views.
See Also:
-
Oracle Database Reference for information about the
DBA_ADVISOR_TASKS,DBA_ADVISOR_EXECUTIONS, andDBA_ADVISOR_SQLPLANSviews