| Oracle® SOA Suite Developer's Guide 10g (10.1.3.1.0) Part Number B28764-01 |
|
|
View PDF |
| Oracle® SOA Suite Developer's Guide 10g (10.1.3.1.0) Part Number B28764-01 |
|
|
View PDF |
The Instances view enables you to view details about message processing across an ESB system. This view enables you to filter messages based on any of the following properties:
The service that processed them
The status of the messages (Any, Error, Faulted, Processing, or Completed)
Tracking name and tracking value
Message IDs
Timeframe during which the message was processed
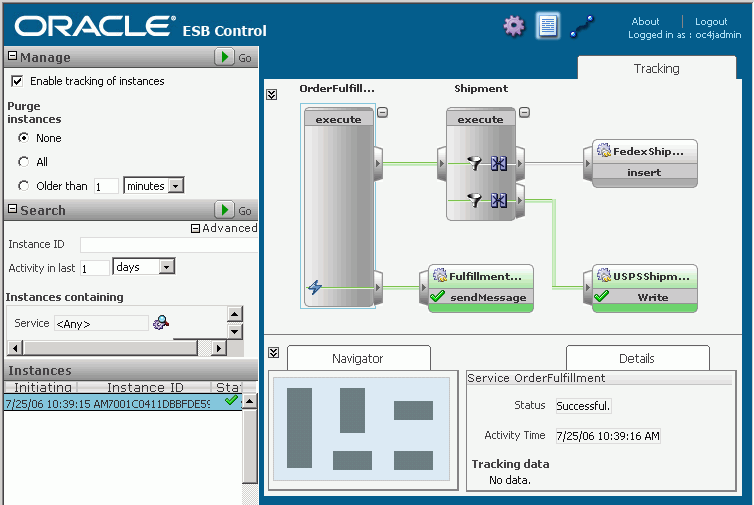
When you select a service for a given message from the Instances panel, the message instance's path through the enterprise service bus is presented in the Tracking tab diagram (and the selected service is enclosed by dotted lines in the diagram). Within the diagram, endpoints that successfully processed the message are represented in green, services where an error occurred are represented in red, and services that processed the message successfully, but were rolled back due to an error are represented in yellow. Endpoints that were not invoked in the processing of the message are represented in gray.
Figure 12-5 provides an example of the Oracle ESB Control Instances view showing successful message processing with service icons colored green.
Figure 12-5 Oracle ESB Control - Instances View

For more information about monitoring message instances, see "Tracking Message Instances Across the Enterprise Service Bus" in Oracle Enterprise Service Bus Developer's Guide.
You can view all the messaged instances by simply clicking the green arrow on the Search title bar on the left side of Oracle ESB Control when the Instances view is displayed.
To view all message instances:
At the top of Oracle ESB Control, click the Instances button if the Instances view is not currently displaying.
In the Search panel title bar, click the Apply icon (green arrow).
All the message instances display for the default time period specified.