| Oracle® Retail Job Orchestration and Scheduler Oracle® Retail Job Orchestration and Scheduler Release 19.0 F23589-01 |
|

 Previous |
 Next |
| Oracle® Retail Job Orchestration and Scheduler Oracle® Retail Job Orchestration and Scheduler Release 19.0 F23589-01 |
|
Previous |
Next |
The screenshots in this appendix are part of the Process Flow User Interface.
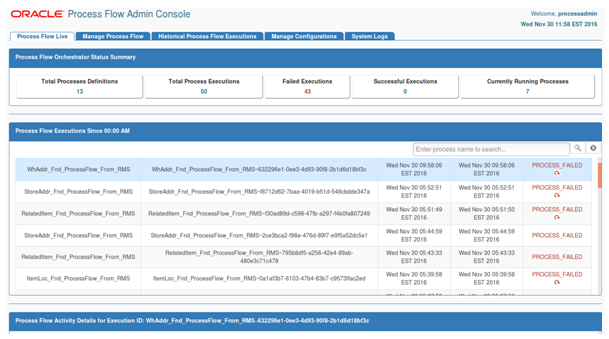
The Process Flow Live tab shows the details of the currently running processes. The first section shows the summary of all processes running in the system. The next section shows the list of all processes running since midnight. The last section shows the activity details of the selected process.
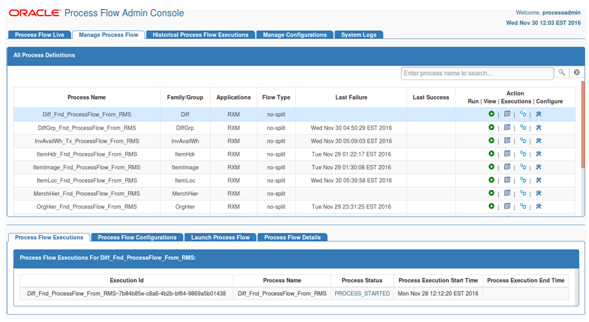
The Manage Process Flow tab is used to start a process flow, restart a failed process flow, view/edit a process flow, list the executions instances of a process flow, and view/edit the process flow configuration. A failed process flow instance can be restarted only if it is the latest failed instance and there are no successful executions after that.
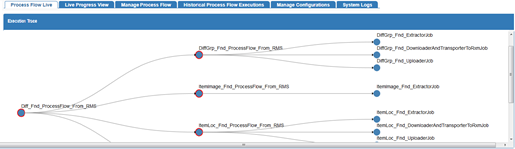
The Execution Trace Graph is also part of Process Flow Live tab. Execution trace graph shows the sub processes and jobs called from a process. The arrows show the relationship between the caller and the callee. The circular nodes of the graph represent the process or the job that was invoked. On hovering over the node, the details of the execution like name of the process or job, invocation time, status etc. are displayed.
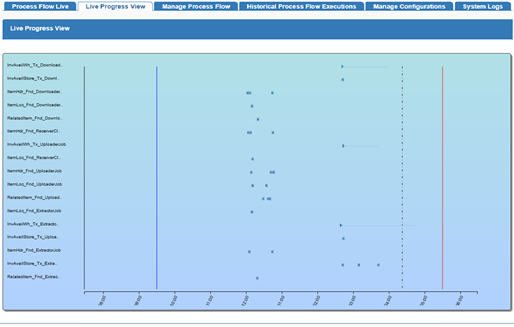
Live progress graph shows the batch status for a time window. Here are the details of the graph.
It shows all the jobs from all the JobAdmins configured in the process flow.
Currently the time window is 10 hours before the current time and one hour ahead of the current time.
Current time is the dotted line axis. The batch start time is the blue axis and batch end time is the red axis
The graph will refresh itself every second. So the axis, jobs and all related information will update
The time window will move as the current time axis nears the end of the graph
Each job is represented by an arrow. The color of the arrow will be red (errored jobs), blue (running jobs) or green (completed jobs). The length of the arrow will be same as the time taken for the job. Same jobs will appear in the same line.
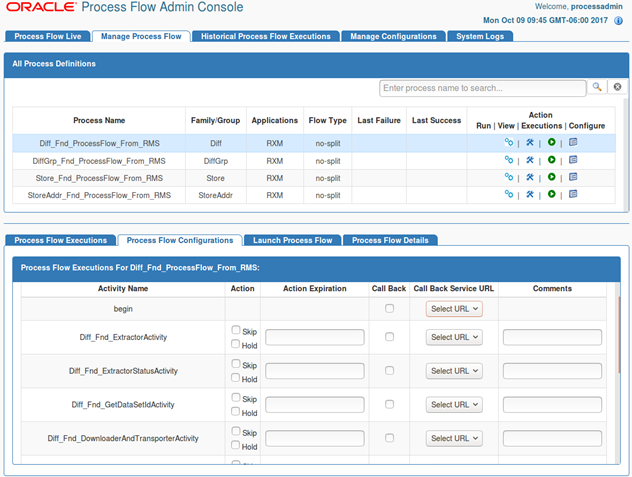
The Process Flow Configurations tab is used to set skip/hold flags on activities in a flow. Call back flag and url can be selected from this page.
Build version and date is displayed on the info icon when the user selects the same. The icon is on the extreme right top corner of the page.
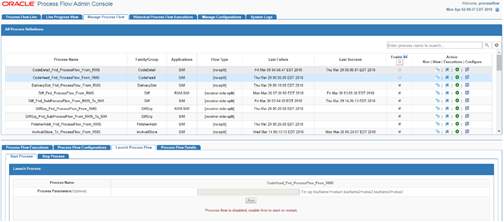
The Manage Process Flow tab allows the user to Start a process flow, Restart a failed process flow, enable or disable the process flow etc. By default all the process flows are enabled. Select the process flow row and check/uncheck the check box of each process and click on save image button in enable column. Only enabled process flows can be launched/restarted. The Run/Restart button is disabled for the disabled process flows. There is an option to enable or disable all the process flows at a time by clicking on checkbox, present in the enable column, highlighted in red and click on save image button.
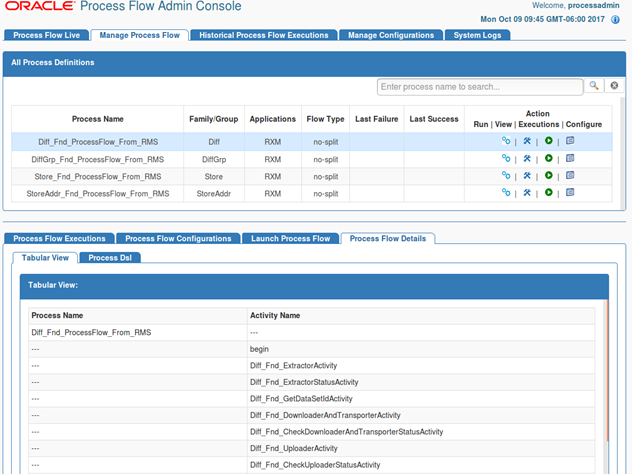
The Process Details tab displays process activities and configuration in a tabular form.
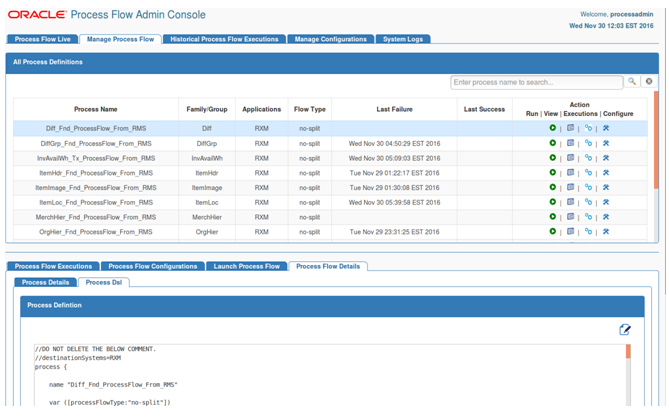
The Process DSL tab displays DSL for the selected process flow.
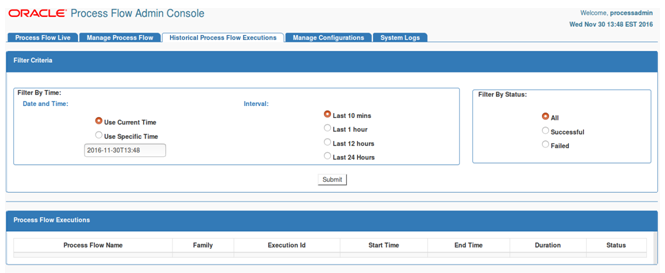
The Historical Process Flow Execution tab allows the user to look at the history of process flow executions. The user can specify a date, a time interval, and a process status. The application will list all the process flow executions matching the criteria. The user can select any of the flow to see the activities details of that execution instance. The page also provides the option to view the before and after values of all process variables for each activity.
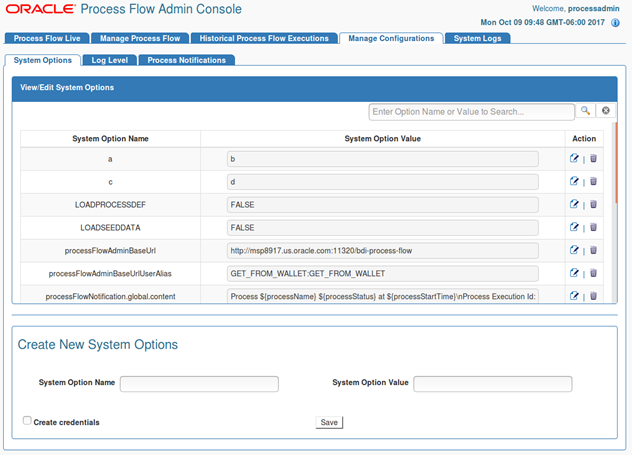
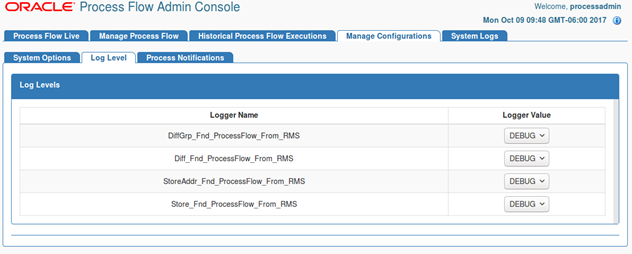
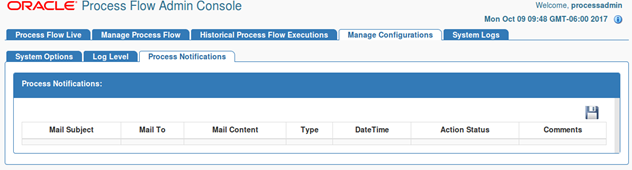
The Manage Configurations tab allows to manage system options, log levels, and process notifications.
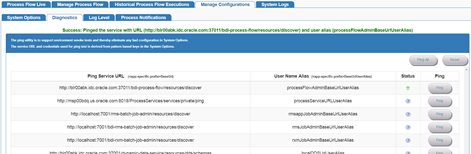
Ping Feature: The ping utility is to support environment smoke tests and thereby eliminate any bad configuration in System Options.
The service URL and credentials used for ping test is derived from pattern based keys in the System Options.
The default Ping Service URL is combination of App specific BaseUrl + Discover service as suffix. POAM ping service URL is combination of BaseUrl + Default ping service as prefix (services/private/ping)
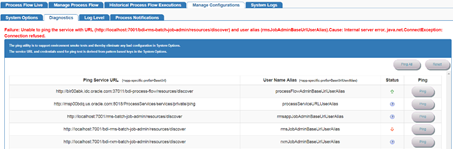
User can ping individual app URL and see the success/failure message on the TOP. Also, there will be a status column which shows UP Arrow image for success and DOWN arrow image for failure.
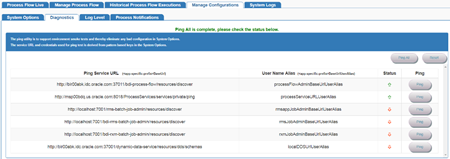
User can also use Ping All feature to ping all the URLs at one time and the responses will be shown on the status column against each URL.
Reset button is to reset the cache and do a fresh service call.
All roles are able to ping services i.e. Admin Role, Operator Role and Monitor Role
The System Options tab allows users to view, edit, and create system options. This page displays the list of system options of the application. The user can modify the value of the existing system options, create new system options, and delete the existing system options. The user must have admin privileges for editing, creating, and deleting system options. A search option based on the system options name and value is also provided on this page.