| Oracle® Retail Integration Bus Java Messaging Service Console Guide Release 19.0 F22949-02 |
|

 Previous |
 Next |
| Oracle® Retail Integration Bus Java Messaging Service Console Guide Release 19.0 F22949-02 |
|
Previous |
Next |
This chapter describes the navigation and steps to use JMS Console application.
JMS Console is a lightweight Web application based on ADF and presents information it sources from AQ JMS in a user friendly manner. The Live Monitor tab describes all JMS activity in real time, thereby giving you a summary of the overall health of JMS system in one view. The Browse tab allows you to browse topics and is a view-only feature. The Manage tab gives you access to the administrator management tools that are critical for troubleshooting.
To log in to the JMS Console, take the following steps:
Enter the application URL http://<host>:<port>/jms-console in the address bar of the browser.
|
Note: Oracle recommends that you use the Mozilla Firefox Web browser to access the URL. |
In the Username field, enter the user name you provided during the installation of the application.
In the Password field, enter the password.
Select the JMS server from the drop down list to work with a specific JMS server. By default, jms1 is selected. The drop down list provides flexibility to switch between JMS servers when multiple AQ JMS's are configured for a single installation.
Click Login. The application home page displays.
The Live Monitor tab is the landing page of JMS Console. It provides an unattended high level view of the AQ JMS server. The dashboard displays the activity on the AQ JMS in question in real time. The dashboard automatically refreshes its content and pulls the latest data from the server every ten seconds.
The Live Monitor tab displays the data collected at different levels and visually groups related data into graphs and tables. There are three main groups are as follows:
Server Level Metrics - The top panel displays a few key metrics for the configured JMS and provides a short summary of them.
JMS Connection URL - Provides the full JDBC URL for AQ data source, where jms1 stands for JMS Server 1.
JMS User Name - Provides the database user name for the configured AQ.
Topic Count - Denotes the total number of Topics present on the configured AQ.
Subscriber Count - Denotes the total number of subscribers found on the configured AQ.
Total Messages Waiting - Denotes the total number of messages waiting on the configured AQ since the JMS Console was installed.
Total Messages Processed - Denotes the total number of messages processed on the configured AQ since the JMS Console was installed.
Monitor Start Time - Denotes the time passed since monitoring started, that is since the time the JMS Console was installed.
Topic/Subscriber Level Metrics - This panel displays the current activity and inactivity details for the AQ JMS system.
Top (10) Active Topics Since 00:00 AM (En-queue/De-queue) - This graph lists the Top Active Topic names and the volume of messages en-queued and de-queued since midnight (00 AM). The data is sorted by volume so that the topics with the highest volume appear first in the bar graph.
Usage Tip - Use this graph to know the list of Topics that have processed most volume since midnight.
Most Recent Activity - This is a tree table that lists all the Topics on the AQ system with the subscribers for each topic. For each topic, the Total Messages processed are listed at two different time intervals, one since midnight and second one since the JMS Console was installed. Values are delimited by a '/'. For each subscriber, the Total Messages Waiting is listed. This table is significant because it displays the current activity on JMS system by indicating the most recent activity at the top of the table. In other words, this table is sorted by Most Recent Activity Time.
Usage Tip - Use this table to review the most recent activities in JMS system.
Inactive Topics by Inactivity Age - This table reports all Topics based on how long the Topic has been 'inactive'. In other words, Topics with no message traffic since the monitoring started. This table is sorted by the Inactivity age and displays the most inactive Topic first. In custom installations, there are chances that certain topic(s) is intentionally not being used. In such cases, you can configure the topic(s) to not be shown in this table. For more information, see the Edit Properties under Manage JMS.
Usage Tip - This report would be useful while troubleshooting potential problems when messages are being en-queued to a Topic, This will help isolating the integration problems, specifically when the publishing application is not even hitting JMS Topic.
|
Note: The timezone is not taken into account when calculating Inactive Time. For example, if the database is in a timezone one hour ahead of the application server, any activity in the AQ will immediately be recorded in JMS console as 1 hour ago. |
Live Message Subscription Activity Count per Subscriber by Topic - This graph reports the live message activity on the AQ JMS grouped by Topics and subscribers. This graph is presented in four quadrants stacked as four panels. The number of panels is based on the number of Topics available on JMS. The graph mainly presents the key metrics for each Topic, Total Messages processed, and the Messages Waiting on a Topic for a specific subscriber. The graph also serves as an alert notification monitor. When the threshold for Max Messages Waiting on Topic set for Messages waiting is breached, a warning sign appears on the Topic that has reached the set threshold. This indicates that the messages are blocked and that the administrator needs to take action to normalize the condition.
|
Note: The Live Monitor window automatically refreshes every ten seconds but the backend services are designed to collect data from JMS on a longer interval for performance reasons. Hence, all the reports (including graphs) in the Live Monitor window may experience a slight delay (~1 minute) in loading the latest data. For more information, see Edit Properties. |
The Browse tab provides browsing capabilities and allows you to discover and drill into the key components of AQ JMS namely Topics, Subscribers, and the Messages. By clicking on a Topic listed in the navigation menu, you can see all the subscribers registered with the Topic. When you click on the Subscriber, you can view the message count and the message content.
Discover Topics Navigation Menu - The navigation system lists all the Topics found on the AQ JMS. It allows you to review (view-only access) the Topics and explore the AQ JMS without altering the state of JMS. The menu system lets you drill into the Topics and the Subscribers by clicking on them.
The Navigation menu uses icons to visually differentiate Topics. For example:

A Subscribers example is as follows:

JMS_MONITORING_AGENT - This is a special light weight subscriber created by JMS Console during application installation. It is designed to collect data from the AQ and provides statistics to JMS Console.
To browse a specific Topic/Subscriber, click the Subscriber listed on the Navigation menu. This displays the Subscriber Summary panel on the right hand side pane. The Subscriber Summary panel provides information on the selected subscriber and contains the Take Snapshot of messages button.
JMS Server - The complete connection URL for JMS Server.
Topic - The name of the Topic the selected subscriber is listening to.
Subscriber Name - The name of the selected subscriber.
Message Waiting on Topic - The number of messages waiting for the selected subscriber.
Message Selector - A messaging application can filter the messages it receives using a message selector. The message subscriber then receives only messages whose headers and properties match the selector. This field displays the Message Selector for the selected subscriber.
Take Snapshot of the messages - In a healthy messaging system, messages are typically en-queued/de-queued continuously and removed from the Topic as soon as the de-queue transaction is committed. In such a situation, viewing a live message is practically impossible. The Take Snapshot tool resolves this issue. This tool lets you get a snapshot of a specific message you want to analyze even after the message has been consumed by the subscribing application. The messages in the snapshot are stored in memory thereby giving you access to view or analyze the message payload.
The tool requires two inputs as follows:
Start Index - It specifies the starting point of the snapshot.
Count - It specifies the number of messages to be included in the snapshot.
Messages - Once the snapshot of the messages is available, the messages are listed in the Messages panel. Each record in the table corresponds to a message in the snapshot. The index in the table refers to the indexing of the list of messages starting with 0. Message columns display the first few characters of the actual message and are intended to serve as a clue. You can identify the message you want to review in detail and click on the row to view it.
Message Details - When a row in the Messages panel is selected, details are loaded in the Message Details panel. This describes JMS Header properties associated with the message and the actual message contents.
The Manage tab essentially bundles a few key tools that are required for managing a JMS server. Oracle recommends that only an administrator, who knows JMS system in depth and is aware of the potential outcome of the action performed by this toolset, be allowed to use the features provided in this tab. This window allows you to interact with JMS server using core messaging system features like publishing a message to a Topic and dumping and draining messages from a subscriber. 
Manage JMS Navigation Menu - The navigation system in the Manage tab provides accessibility to information via two kinds of nodes; the Data Nodes and the Action Nodes. Topics and the Subscriber nodes are referred to as the Data Nodes since they have no action associated with them directly. Action nodes provide links that leads to any action. The Topic and Subscriber nodes have a separate set of relevant action nodes.
The Action nodes available for a Topic are Publish Message and Edit Properties.
The Action nodes available for a Subscriber are Dump Message and Drain Messages.
To publish messages to a JMS Topic, take the following steps:
In the Manage tab, select JMS Topic.
Click Publish Message. The Publish Message window for the Topic displays.
Enter the following:
Choose a JMS Header Name - Add a JMS Header property name if one is not already available. Once added, the header name is available to all the users using the application. The header names are not persisted and are lost when the server is restarted.
JMS Header Properties - Add JMS Header property name and value.
Import Message Payload from Local Disk - Select the file from the local file system.
Enter Message Payload Here - Enter the complete XML message payload.
Click Publish.
|
Note: A message that is published to a JMS system is consumed by the registered subscriber and may eventually flow to the downstream applications. Once initiated, this process cannot be undone.Message family is a case-sensitive field and needs to be entered consistently while testing. Variations in message family capitalization will result in inconsistencies in RIC. |
JMS Console application has a preference configuration that defines application level preferences. Based on the set preferences and business need, the application behavior can change. These preferences are persisted and are available even after a server bounce.
The following two preference settings are available:
Threshold for Max Messages Waiting on Topic - It is the maximum number of messages waiting on a Topic after which a notification is generated. The notification can be a graphical alert on the Live Monitor graph or an Email Notification that is enabled. By default, this preference is set to a 100 messages. Once the threshold is met, alerts are fired.
Ignore This Topic For Inactivity Calculation - When set to false, this property ignores the selected Topic for inactivity calculation. In other words, if this flag is set to Yes, the selected Topic is not treated as inactive. The Topic will not be listed in the Live Monitor's Inactive Topics by Inactivity Age report even if no traffic exists. By default, this flag is set to No and the Topic is treated as inactive in the event when there is no message traffic.
To edit properties for a JMS Topic, take the following steps:
In the Manage tab, select JMS Topic.
Click Edit Properties. The Properties window for the Topic displays.
Threshold for Max Messages Waiting on Topic - Provides the threshold for the selected Topic.
Ignore This Topic For Inactivity Calculation - Select from a Yes/No preference.
Click Save Changes.
Apart from monitoring alerts using the Live Monitor window when the system is offline, you can configure email notifications for an alert that requires an administrator's attention.
To enable email notifications, take the following steps:
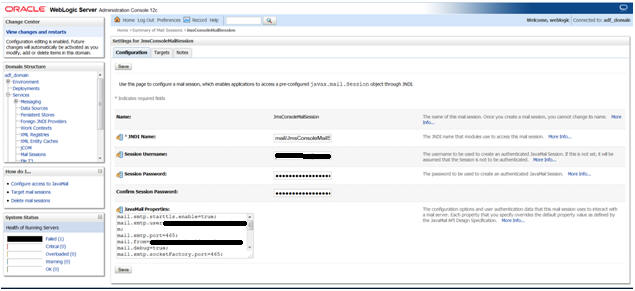
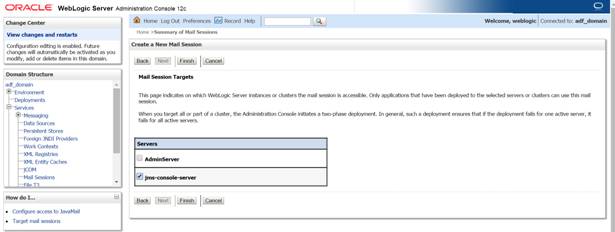
On the WebLogic Administrator Console's left side menu, click Services > Mail Sessions and create a New mail session. For Mail Session Properties, enter the values and click Next. The following is an example of values:
Name: JmsConsoleMailSession
JNDI Name: mail/JmsConsoleMailSession
Session Username: Administrator's email id (for example, admin@example.com)
Session Password: Email server authentication password
Confirm Same Password: Enter same email server authentication password
JavaMail Properties:
mail.debug=true;
mail.smtp.user=exampleuser@sample.com;
mail.from=exampleuser@sample.com;
mail.smtp.host= sample.com;
mail.to=exampleuser@sample.com,exampleuser2@sample.com;
mail.smtp.auth=true;
mail.smtp.port=465;
mail.smtp.socketFactory.class=javax.net.ssl.SSLSocketFactory;
mail.smtp.socketFactory.port=465;
mail.transport.protocol=smtp
Select the Mail Session Target to be the managed server hosting JMS Console application. Click Finish. On completing these steps, alerts are generated by JMS Console which triggers email notifications to the configured email addresses.
|
Note: For more information on setting up the Mail sessions on WebLogic, see the Oracle® WebLogic Administrator's Guide 12c Release. |
To reset the set preferences across all the Topics to default setting, take the following steps:
Go to WebLogic domain home and locate and delete jms-console hidden folder.
cd $MW_HOME/user_projects/JMS_CONSOLE_DOMAIN/rm -rf .jms-console
Restart the server hosting the application.
A JMS administrator or a business user can use this feature to analyze payload data or the message content. This feature lets you dump, or download, the messages to the file system. While troubleshooting messaging or integration problems where messages are stuck on a Topic, you can dump messages to file system and replay them at a later date. You need expertise to execute this process. Make sure you consider message sequencing while replaying the messages.
To dump/download messages to a file system for a Subscriber, take the following steps:
In the Manage tab, select the Subscriber.
Click Dump Message. The Dump Messages window for the Subscriber displays.
Starting Index - Specify the index to begin dumping the messages.
Number of Messages to Dump - Specify the number of messages to dump.
Click Dump Messages. After a successful message dump, the location to the messages is displayed. The messages are downloaded from the AQ JMS server to the WebLogic server and not the client/local computer for security reasons.
|
Note: Dumping messages can be an expensive operation depending on the number of messages being dumped. It may have an impact on the Messaging application. |
Use this feature to delete messages from JMS Topics permanently. An Administrator can use the Drain Messages feature to delete messages while troubleshooting messaging / integration problems where messages are stuck on a Topic. Use this feature only after analyzing the message using the Dump Message feature.
To drain messages for a Subscriber, take the following steps:
In the Manage tab, select the Subscriber.
Click Drain Messages. The Drain Messages window for the Subscriber displays.
Number of Messages to Drain - Specify the number of messages to drain.
Click Drain Messages.
|
Note: Incorporate due diligence while using the Drain Messages feature since it deletes the messages permanently from JMS system. This process cannot be undone. |
