| Oracle® Retail Service Backbone Integration Console User Guide Release 19.0 F22955-02 |
|

 Previous |
 Next |
| Oracle® Retail Service Backbone Integration Console User Guide Release 19.0 F22955-02 |
|
Previous |
Next |
The RIB Integration Summary page shows a one page view of the overall RIB integration infrastructure. This page shows event counts, commits vs rollbacks count, current integration performance, most active adapter since midnight, most recent activity count, top problematic interfaces, top 10 problematic JMS topics, and server CPU and memory usage. The summary information is for applications and servers that are in scope. The Auto Refresh checkbox, if checked, polls for data for the graphs and tables every 10 seconds.
Data Collected At: Displays the time the data is collected from the RIB.
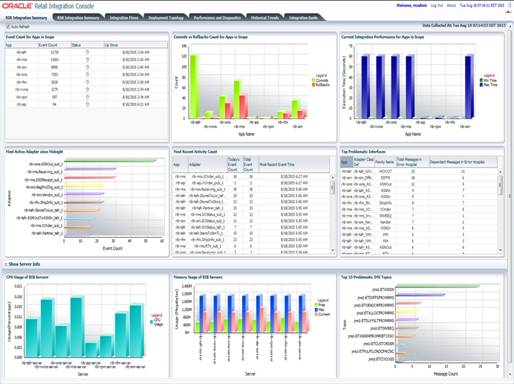
Event Count for Applications in Scope: This table shows event count, status and up since time, for all the applications in scope. The event count shown here is the total event count from the time displayed in Up Since column. The application with the highest event count is on the top.
Commits vs Rollbacks Count for Applications in Scope: This bar graph shows the event commits and rollbacks for the applications in scope. The commit and rollback count refers to the information maintained by WebLogic server for the EJBs transactions. RIB monitoring system interrogates the JMX MBeans for the commit and rollback counts and updates the local repository. A single message may result in more than one commit and/or rollback, depending upon various scenarios of failures.
Current Integration Performance for Applications in Scope: This bar graph shows the comparison of minimum and maximum execution time for the applications in scope.
Adapter Execution Time: For a subscriber adapter, the time is noted when the message arrives and again at the end of the Message method. The difference is calculated. An Adapter Execution Time event is created, which is used (if applicable) to set the minimum, maximum and last adapter execution time for the hour of the day.
For a publisher adapter, the time is noted at the beginning and end of the publishing method and the difference is calculated. An Adapter Execution Time event is created, which is used (if applicable) to set the minimum, maximum and last adapter execution time for the hour of the day.
API Execution Time: For a subscriber adapter, the time is noted around the API call and the difference is calculated. An API Execution Time event is created, which is used (if applicable) to set the minimum, maximum and last api execution time for the hour of the day.
There is no API execution time event for publisher adapters.
Most Active Adapter since Midnight: This bar graph shows the most active adapters since midnight. The adapter with highest event count after midnight is at the top of the graph.
Most Recent Activity Count: This table shows adapter's today's event count, total event count and most recent event time for the applications in scope. The adapter with the most recent event is at the top.
Top Problematic Interfaces: This table shows error hospital data for the applications in scope, with details of adapter class def, family name, total, and dependent messages in error hospital. The adapter with the most messages in error hospital is shown on top. For every rib-<app> in scope of integration, an email notification is sent upon exceeding the error hospital threshold count of 100 error messages per family.
CPU Usage of RIB Servers: This graph shows the CPU usage of RIB servers, for applications in scope.
Memory Usage of RIB Servers: This graph shows, current, maximum and free memory statistics of RIB application servers in scope.
Top 10 Problematic JMS Topics: This graph shows the 10 JMS topics with the most messaging waiting. The topic with most messages waiting is shown on top.
