| Oracle® Retail Integration Cloud Service Implementation Guide Release 19.0.000 F25439-01 |
|

 Previous |
 Next |
| Oracle® Retail Integration Cloud Service Implementation Guide Release 19.0.000 F25439-01 |
|
Previous |
Next |
This chapter describes monitoring via the RIB in detail.
RIB runtime monitoring enables you to monitor the state and volume of messages running through the RIB system. It also provides the status of various components of the system. The current RIB system and message flows are interrogated transparently to collect useful metrics that immensely enable business users and system administrators to review the state and health of the system. The monitoring enhancement collects application and adapter statuses, message event counts, transaction counts, error hospital statistics, and server resource utilization statistics.
The following graphic describes the architecture of the system:
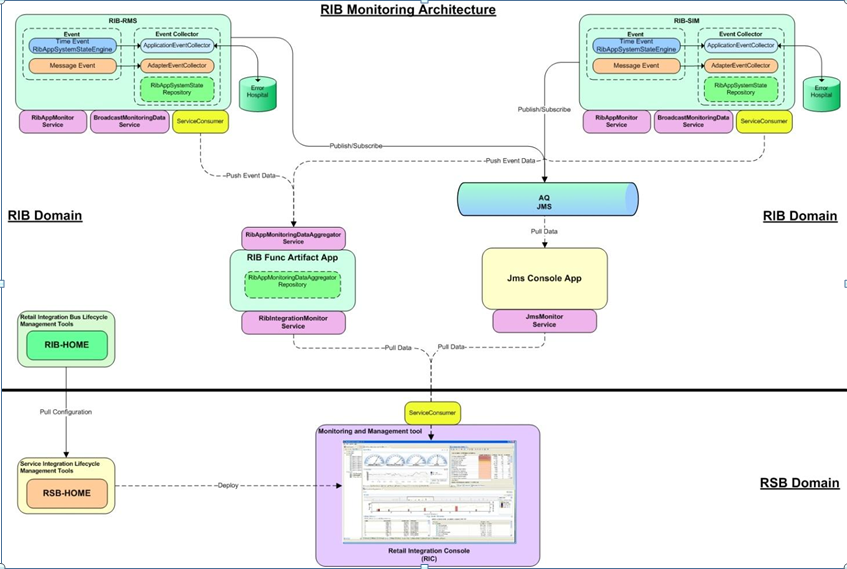
The monitoring metric data is collected in the rib-<app> instances. The data collected from all rib-<app> instances are consolidated in the central location. Both the collection and consolidation server instances store the data in in-memory repositories. Various pieces of data are collected at different times based on the nature of data and performance considerations. At any point of time, the repository data shows a complete picture of the state as of the last data collection time.
The collected data is reported in a defined format. The monitoring data is exchanged between components that produce and consume in XML format. rib-<app> instances produce the data and the central repository and Retail Integration console (RIC) (or third-party tools) consume the monitoring data.
Sometimes, data is collected by scheduled background jobs. Message related data is collected asynchronously as the messages are consumed/published by adapters. The collected metric data is kept in a local repository in the rib-<app> instance. This information is pushed to a central repository (in memory) on a scheduled frequency (every two minutes). If any rib-<app> is down, the central repository does not receive data from that instance. The Central repository does not poll for data nor pull data from the rib-<app> instances. This way the central repository has no dependency on the rib-<app>s.
While each rib-<app> has its own monitoring data, the central repository holds the consolidated data from all the rib-<app> instances.
The monitoring data in the rib-<app> instances and the central repository are made available to RIB monitoring system as well as the third-party tools via SOAP web services running in the respective server instances. For more information, review the sample data and the Web service WSDL URL available at: Sample Data from RIB App Monitoring Service
The out-of-the-box implementation of the monitoring services is secured. So credentials are required for the rib-<app> to call the integration monitoring Web service. These credentials need to be provided during RIB compilation. This is the only change from an installer perspective for the monitoring service implementation.
RIB messages flow from the publishing apps to subscribing apps, TAFRs, and error hospital in the RIB system. Sometimes, messages can be rolled back due to application or system errors. Each attempted delivery, whether successful or not, is called an Event. The RIB monitoring system counts the events which include both successful and failed delivery of messages. Also, any changes in the adapter status, error hospital data, server resource utilization etc. is considered an event.
There are two types of events - Adapter Events and Application Events.
Event count includes both successful and failed message counts. There is no reliable way of getting the exact successful message count without affecting the performance of the system. Hence, the RIB monitoring system collects event counts instead of message counts. For the most part, they are similar, but not exact.
Adapter events are adapter level events like message flows (subscription, publishing) and adapter statuses. In the RIB monitoring system, message related adapter events are collected in real-time. Adapter status events are collected by scheduled background threads.
Application events are application level events like server resource (CPU, Memory) utilization, application status, error hospital data, etc. These metrics are collected by scheduled background threads.
Various events in the system are collected at various times.
|
Note: There is a difference between the collection time and reporting time. For example, even though the eventcounts are collected in real-time, they are not available in the central repository immediately. |
The following is a complete schedule of collection times:
| Metric | Event Type | Schedule |
|---|---|---|
| Event Count | Adapter | Real time |
| Adapter Execution Time | Adapter | Real time |
| API Execution Time | Adapter | Real time |
| Adapter Status | Adapter | Every three minutes |
| Application Status | Application | At startup |
| Error Hospital Statistics | Application | Every five minutes |
| CPU Utilization | Application | Every five minutes |
| Memory Utilization | Application | Every five minutes |
The publishing event does not collect certain metrics, like the API Execution Time, since it is not possible to find out the API execution time once the message is published. It collects only the Adapter Execution time, which is the time taken to publish the message.
TAFRs are monitored for collecting various time metrics. Measuring the time for the TAFR API execution begins as soon as the TAFR starts transforming the inbound message to an outbound message and ends when the message get transformed. Collecting Adapter Execution Time begins as soon as the message is available for the rib-tafr to transform and ends after routing the message to the destination topic.
The monitoring data is collected in rib-<app> repositories and a central repository in the functional artifact app. These are in-memory repositories. The information in the repositories is lost when the application is restarted. Additionally, the repositories are not purged, so the data collects as long as the applications run. The monitoring data is collected in hourly buckets. There can only be a maximum of 24 records per day. This strategy reduces the chances of the system going out of memory.
The following sections describe the metrics that are collected by the system.
When a message is subscribed or published, an event is generated to increment the event count for the hour of the day.
For a subscriber adapter, the time is noted as soon as the message arrives. At the end of the onMessage method the difference is calculated. An Adapter Execution Time event is created, which is used (if applicable) to set the minimum, maximum, and last adapter execution time for the hour of the day.
For a publishing adapter, the time is noted at the beginning and end of the publishing method, and the difference is calculated. An Adapter Execution Time event is created, which is used (if applicable) to set the minimum, maximum, and last adapter execution time for the hour of the day.
For a subscriber adapter, the time is noted around the API call and the difference is calculated. An API Execution Time event is created, which is used (if applicable) to set the minimum, maximum, and last API execution time for the hour of the day.
For publishing adapter, there is no API execution time.
A scheduled background job collects the Adapter status and updates the local repository. If the RIB application is down, since the job cannot run the status of the adapter in the central repository will be the last known status until the cache expires. After the cache expiry it will be "Unknown' until the status is reset by the rib-<app>.
The commit and rollback count is the same information maintained by WebLogic server for the EJBs transactions. RIB monitoring system interrogates the JMX MBeans for the commit and rollback counts and updates the local repository. A message flow may result in more than one commit and rollback, depending on various scenarios of failures.
CPU and Memory information are also collected by background thread on scheduled times. The status is always as of the last collection time.
Error hospital data for the RIB application is queried by a scheduled background thread and the following information is collected:
Total Messages in Error Hospital: Total number of messages in the Error Hospital for the application
Total Messages in Error Hospital due to dependency: Total number of dependent messages in the Error Hospital
Message Family: Message family of the family-vice statistics
Adapter class Definition: Adapter information for the message family
Error count: Number of error messages for the message family
Dependency count: Number of the dependent messages for the message family
Server Status (Up Since) is collected at the application startup. When the server is restarted, this information is reset. The following metrics are collected:
Current CPU: Current CPU utilization for the rib-<app> server
Current Memory: Current Memory utilization for the rib-<app> server
Max Memory: Max Memory utilization for the rib-<app> server
Free Memory: Free Memory utilization for the rib-<app> server
For details on the metrics collected by the JMS Console, see the Java Messaging Service Console Guide.
A set of web services for third-party software make the RIB monitoring data available for use. Services are available in rib-<app> instances as well as the central repository. The rib-<app> services return only the data for the rib-<app>. The central repository returns consolidated monitoring data from all the rib-<app> instances.
These services are hosted on the same JVM as the rib-<app>. For each RIB, there is an instance of the service that returns the monitoring data of the service.
Rib Application Monitor Service: This service returns the monitoring data in the local repository of the rib-<application> in XML format. The schema of the messages is the same for rib-<app> and TAFRs. For more details on the example of the data, refer the Appendix A chapter.
WSDL for the RIB Application Monitor Service: http://<host>:<port>/RibAppMonitorService/RibAppMonitorService?WSDL
Broadcast Monitoring Data Service: This service pushes the data from the local repository to the central repository. There is a scheduled background thread that pushes the data.
WSDL for the Broadcast Monitoring Data Service: http://<host>:<port>/BroadcastMonitoringDataService/BroadcastMonitoringDataService?WSDL
RIB Integration Monitor Service: This service returns the consolidated monitoring data from all the services. The data is returned as XML. The central repository returns the data as of the last known status of the rib-<app> adapters. A sample XML is shown in Appendix B.
WSDL: http://<host>:<port>/RibIntegrationMonitorService/RibIntegrationMonitorService?WSDL
These services are bundled inside the JMS Console application and are available from the same managed server where the JMS console is installed. The service is intended to expose the RIB integration messaging activity by directly probing the underlying AQ JMS.
JMS Monitor Service: This service provides the runtime information from the RIB's JMS server. The data returned conforms to jms-runtime-info.xsd. All the statistics captured in a service response XML are tied to a JMS server. If RIB utilizes multiple JMS servers, then the JmsMonitorService produces the XML for all the JMS servers involved. Each JMS Server further contains data related to all topics and subscribers. A sample response XML is shown in: Sample Data from RIB App Monitoring Service
WSDL: http://<jms-console-host>:<jms-console-port>/JmsMonitorService/JmsMonitorService?WSDL
The monitoring data is cached in the rib-<app> instances and central repository to eliminate the timing dependency between data collection and data consumption. If any of the rib-<app> servers go down, the data already sent to the central integration repository stays until the cache expiration. The cache expiration is set to 10 minutes. If the RIB does not refresh the central repository with its monitoring data within the cache expiration time, the status of the rib-<app> becomes unknown.
The Functional Artifact application is home to the central RIB Monitoring data repository. This way there is no additional steps to deploy one more application for implementing the monitoring capability. There is no additional change for the monitoring feature, during download and deployment, from the previousreleases.
Out of the box implementation of RIB apps will have the monitoring turned on. Rib Monitoring is controlled by timings logger level. If timings log level is at INFO or DEBUG, then instrumentation is enabled for adapter events. For other log levels (ERROR, WARNING), the adapter level events are not captured.
Application level events are collected by scheduled jobs running at predetermined frequency. Currently, these jobs cannot be turned off.
RIC is the visualization tool for all RIB monitoring data. Monitoring data originates in the RIB apps, gets collected in Function Artifact Apps, and gets rendered in the RIC. If any of the links are broken, it is easy to interrogate the component since the data is also exposed by services. You can call the RIB Application Monitoring service to see the data in the rib-<app> instances. You can call RIB Integration Monitor Service to review the consolidated data. You can call the Broadcast Service to push data from rib-<app> instances to the central repository.
RIC is a visualization tool for Retail Integration. It provides a complete and unified view of the Oracle Retail Integration System within the business context of the Oracle Retail applications. The RIC application is enhanced to add RIB monitoring data. In other words, RIC is the visualization tool for RIB Monitoring data.
To review more information on RIB Monitoring, refer the RIB User Guide.
RIC relies on the JMS Console application to source the messaging activity of RIB runtime. RIC derives the JMS console information at compile time and starts polling the JMS Monitoring Service available on the preconfigured JMS Console application. All JMS related metrics in RIC are sourced from JMS console.
The RIB Monitoring system is designed with several performance considerations. Typically, the RIB system can handle heavy volumes of retail data flow between systems with a near real-time response time. Any negative performance impact may result in substantial performance degradation to the entire system. Hence, the monitoring framework is designed to have a minimal impact on the core messaging system. The following design approaches were employed in RIB Monitoring system:
The collection for message-specific metric data are asynchronous with minimal impact to the RIB message processing.
Event data statistics are summarized to hourly counts to reduce chatter and improve performance.
Update to the central repository of integration data from rib-<app> instances is on scheduled frequency to improve performance.
Application level metrics are collected on a scheduled frequency.
Repositories are used only for storage. Data is interpreted by client applications (like RIC).
The RIB monitoring framework is designed to combat dependencies - that is, if one component is down for any reason, the other components are not impacted. The following measures ensure this behavior:
If any of the rib-<application> servers go down, to the central integration repository remains until the cache expiration.
If the rib-<application> server is bounced, the local repository initializes and the new data is sent to the central repository at scheduled frequency.
If the central repository server is bounced, the historical data is lost and new data is generated by the rib-<application> instances.
The RIB Monitoring services are secured with a username password policy. The credentials for the services are collected initially when the RIB system is configured.
The RIB Monitoring system provides the monitoring data via Web services to any third party client applications. The data is in XML format. The schema of the data is the same for all the rib-<app> instances. The schema is well-defined and any Web service consumer with credentials can consume the data.
