| Oracle® Retail Service Backbone Cloud Service Oracle® Retail Service Backbone Cloud Service Implementation Guide Release 19.1.000 F31812-01 |
|

 Previous |
 Next |
| Oracle® Retail Service Backbone Cloud Service Oracle® Retail Service Backbone Cloud Service Implementation Guide Release 19.1.000 F31812-01 |
|
Previous |
Next |
This section describes the RSB JMX infrastructure. JMX is a specification that provides capability for runtime management of Java components. WebLogic server implements JMX specification. RSB uses JMX for collecting useful information for monitoring the functioning of the integration infrastructure.
Any third party JMX console compatible with the Java EE container can be used to manage RSB components. In RSB some of information captured by OSB MBeans are collected and reported in context through the administrating application (RIC).
|
Note: See also JMX Specificationhttp://docs.oracle.com/javase/7/docs/technotes/guides/jmx/JMX_1_4_specification.pdf. |
In RIC, the following metrics are captured using JMX. The metrics data is collected by OSB from all the managed servers on regular interval. The default interval is 10 minutes. The interval for each service (Proxy and Business) can be changed in EM console. The following graphic shows a proxy service aggregation interval field location, in case it is required to change. 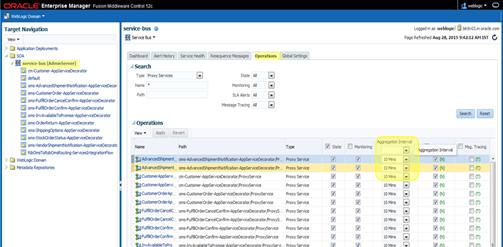
RIC retrieves the metric data from EM when the user visits the Metrics Graphs tab. Since EM metric collection is decided by the collection interval, the data shown in RIC can be out of sync by a maximum delay of the interval. So, in a default configuration the metric data can be outdated by a maximum of 10 minutes.
In order for the alerts to work, it should be enabled in the global settings. These are enabled by default. Following screen shows the location to enable alerts in the EM Console. 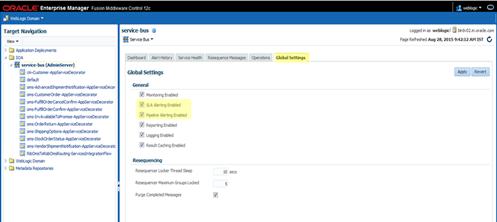
Success and failure count
This count shows the number of successful invocations and number of failures of decorator and app service for the past 24 hours.
Min, max and average response time
This information shows minimum, maximum and average response time of service operations for the past 24 hours.
Success and Failure count for operations
This is a count of success and failure by operations for the past 24 hours.
Review the Oracle Retail Service Backbone Developers Guide for instructions on adding Business and System Alerts.
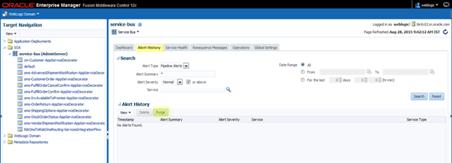
The performance of alert retrieval is affected by the number of alerts in the system. As the number of alerts grows, the retrieval becomes slow. This becomes evident in the alert screen of RIC application. The screen rendering gets slower as the number of alerts increases over time. Here are a couple of ways to purge the alert.
Purge the alert through EM console. From the EM console dashboard navigate to the Alert History for SLA and Pipeline alerts. Search for an alert based on a specific search criteria and click on Purge to purge the alert.
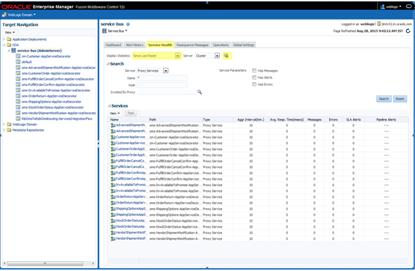
The following graphic shows how to reset statistics using EM Console
Select Service Health tab.
Choose Since Last Reset option for Display Statistics drop-down.
Click Reset Statistics.
|
Note: See also Oracle Service Bus Guides. |