3 Adding Charts
Once a Management Plug-in is deployed and a target instance created, a basic default target home page is automatically generated. The Management Plug-in framework lets you increase the utility of this page allowing you to display performance and configuration data using charts (pie, bar, and time series). By adding charts to a target home page, you can present key monitoring information about the target in an intuitive, easy-to-read format. This allows administrators to monitor and manage target instances with ease. In some cases, adding charts may eliminate the need for creating specialized reports
This chapter covers the following topics:
3.1 Management Plug-in Home Page
The default target home page provides basic information regarding target status such as Availability, Up/Down status, and Alerts. Depending on what level of monitoring support the Management Plug-in provides, there may be additional sections. Most all information is in tabular format.
Figure 3-1 Default Target Home Page without Charts
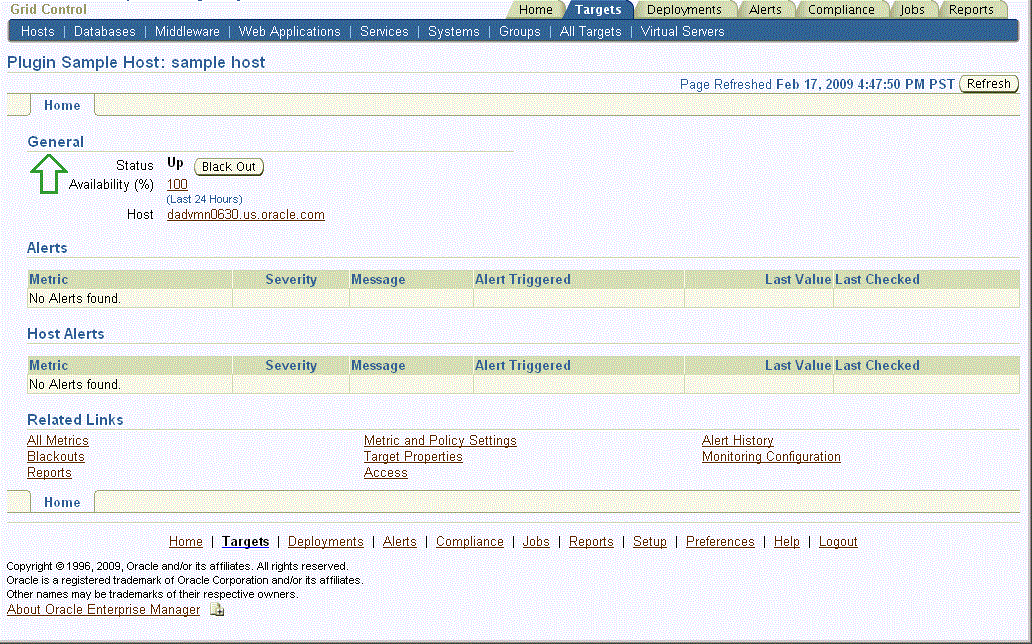
Description of "Figure 3-1 Default Target Home Page without Charts"
Adding charts to the target home page makes key graphical information normally found in Enterprise Manager reports readily available on the target home page.
Figure 3-2 Default Target Home Page with Charts
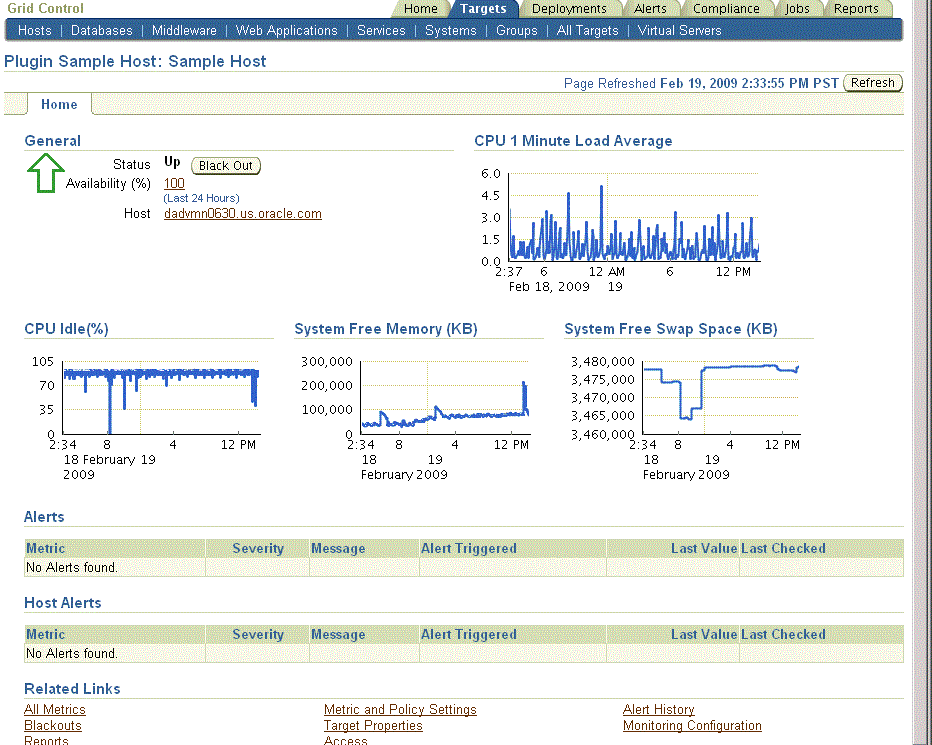
Description of "Figure 3-2 Default Target Home Page with Charts"
By adding a chart definition XML file to your Management Plug-in Archive, you will be able to specify any number of charts (pie, bar, and time series) on the target home page.
3.2 Home Page Charts File
Like other Management Plug-in files, the XML used to define a home page chart file is straightforward and relatively compact. This file defines the metadata used to render charts using metric or SQL data sources for the target.
Home Page Chart File Structure
From the examples, you can see that the basic structure of the home page charts definition file is organized according to chart location on the target home page. One chart may be placed on the top of the page and to the right of the General Information Region (TopPane). Any number of charts may be placed in a row that renders just below this area (MiddlePane).
Figure 3-3 TopPane and MiddlePane Locations within the Target Home Page
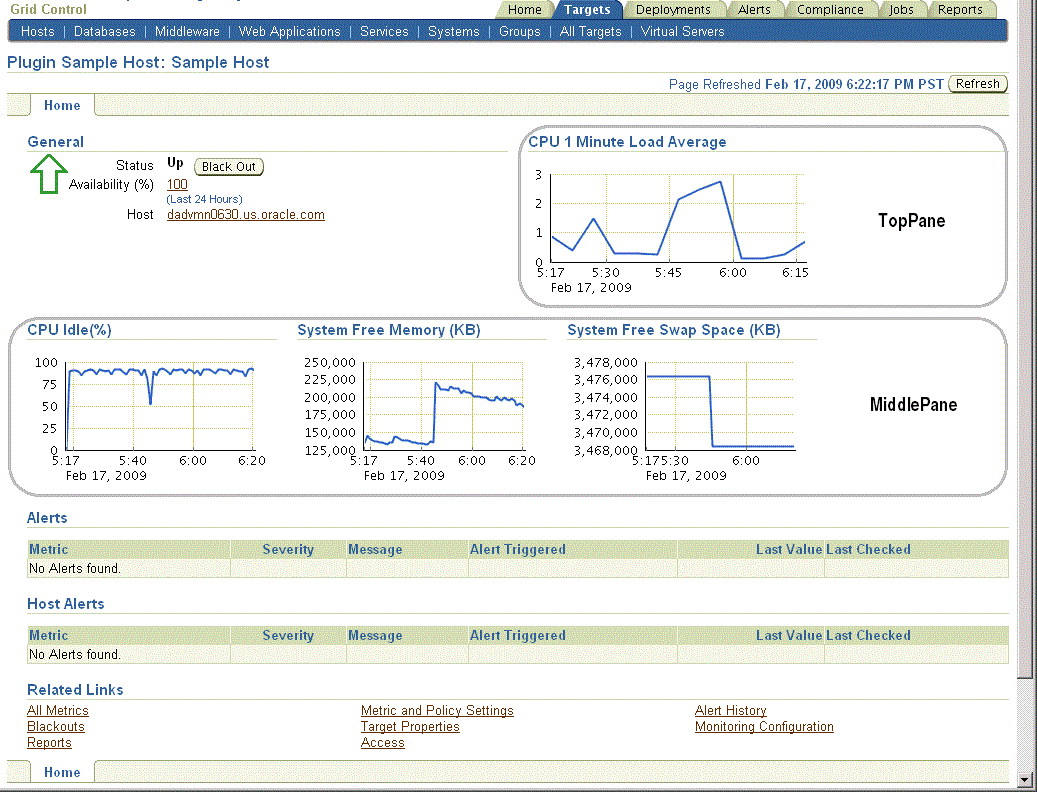
Description of "Figure 3-3 TopPane and MiddlePane Locations within the Target Home Page"
Although there is no technical limit to the number of charts you can add, in practice, at most 3 - 4 charts will fit comfortably in the MiddlePane.
3.2.1 Defining the Home Page Chart File
The home page charts file must begin and end with a HomepageCharts tag to identify the XML file as a chart definition file for the plug-in. As shown in the following sample, the opening HomepageCharts tag requires that you specify a TARGET_TYPE property, which is the target type defined by the TYPE parameter of the TargetMetadata tag found in the Management Plug-in's target type metadata file. See "Target Definition Files" for more information about the target type metadata file.
<HomepageCharts TARGET_TYPE="my_plugin_target_type"> ...</HomepageCharts>
3.2.2 Defining Charts Sets
Between the opening and closing HomepageCharts tags you define the charts and optionally when they should appear on the target home page using the ChartSet tag. The ChartSet tag functions as a container for all charts that are to rendered on the target home page. You can define multiple ChartSet containers within the home page chart definition file. By using the optional META_VER parameter, you can specify different sets of charts (or no charts at all) be rendered on the target home page for specific versions of the Management Plug-in target type. Shown below are the three acceptable implementations of the ChartSet tag:
<HomepageCharts TARGET_TYPE="my_plugin_target_type">
     <ChartSet META_VER="1.0">
     ...
     </ChartSet>

     <ChartSet>
     ...
     </ChartSet>

     <ChartSet META_VER="2.0"/>
</HomepageCharts>
In the example, each implementation of the ChartSet tag operates as follows:
-
<ChartSet META_VER="1.0">Charts defined in this set appear on target home pages for version 1.0 Management Plug-in target types.
-
<ChartSet>Charts defined in this set appear on target home pages for all Management Plug-in target types that are not version 1.0 or 2.0 (charts displayed by default).
-
<ChartSet META_VER="2.0" />No charts will appear on the target home pages for version 2.0 Management Plug-in target types.
3.2.3 Defining Chart Location
Each ChartSet block gives you the option to define charts in two locations: TopPane and MiddlePane. The TopPane refers to the top right of the target home page, next to the General Metrics section. This area can accommodate a single chart. The MiddlePane refers to the row immediately below this area. You can define charts for either or both areas.
<HomepageCharts TARGET_TYPE="my_plugin_target_type">     <ChartSet>
          <TopPane>
          ...
          </TopPane>
          <MiddlePane>
          ...
          </MiddlePane>
     </ChartSet>
</HomepageCharts>
3.2.4 Creating Charts
Once you have decided the when and where the charts should appear, you need to define the actual charts. Within each pane, you use the Chart tag to specify the type of chart to be rendered, chart attributes, as well as any data acquisition methods required to render the chart.
<HomepageCharts TARGET_TYPE="my_plugin_target_type">
     <ChartSet>
          <TopPane>
               <Chart TYPE="timeSeriesChart">
               ...
               </Chart>
          </TopPane>
          <MiddlePane>
               <Chart TYPE="pieChart">
               ...
               </Chart>
               <Chart TYPE="barChart">
               ...
               </Chart>
          </MiddlePane>
     </ChartSet>
</HomepageCharts>
As shown in the example, each Chart tag must specify one of the following TYPE properties that define the type of chart (pie, time series, bar) to be rendered on the target home page:
-
timeSeriesChart
-
pieChart
-
barChart
The following example demonstrates chart implementation for a VMware target type. As shown in Figure 3-5, both bar and time series charts have been created, making use of a variety of optional chart properties, such as stacked, timeGranularity, shadowEffect, xAxisLabel, yAxisLabel. The code used to define the charts is shown in Example 3-1.
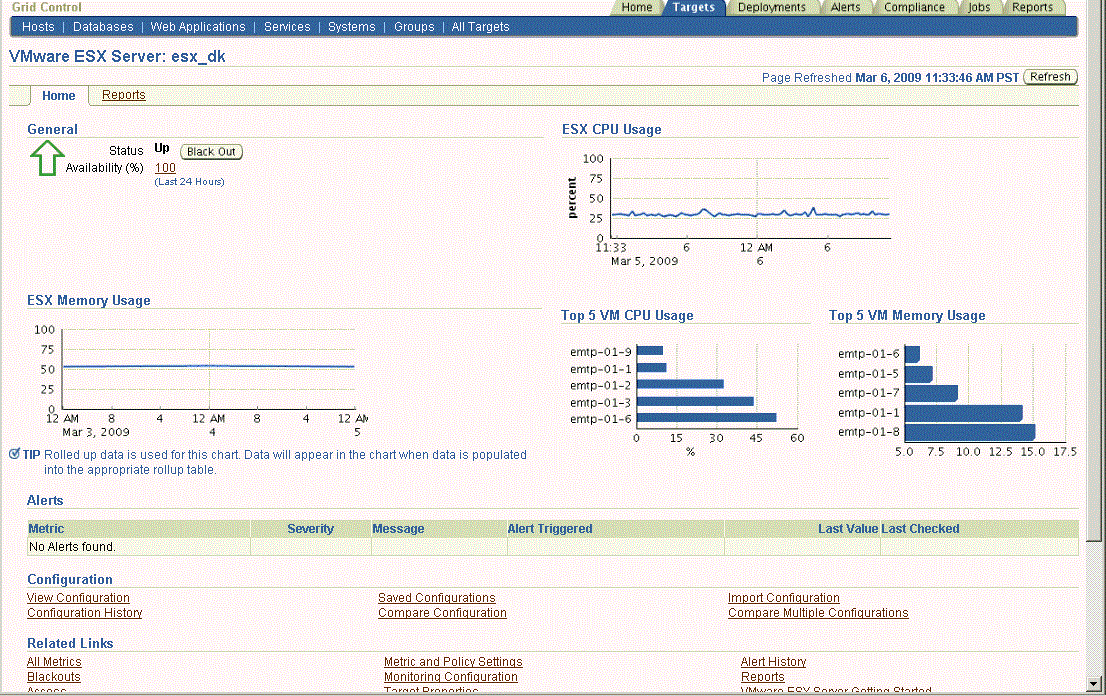
Example 3-1 Home Page Charts XML for VMware
<HomepageCharts TARGET_TYPE="vmware_esx_server">
<ChartSet>
<TopPane>
<Chart TYPE="timeSeriesChart">
<ChartProperty NAME="metric">HostSummCPU</ChartProperty>
<ChartProperty NAME="column">host_cpu_usage</ChartProperty>
<ChartProperty NAME="width">375</ChartProperty>
<ChartProperty NAME="height">150</ChartProperty>
<ChartProperty NAME="legendPosition">south</ChartProperty>
<ChartProperty NAME="titleVisible">true</ChartProperty>
<ChartProperty NAME="title">ESX CPU Usage</ChartProperty>
<ChartProperty NAME="subtitle"> </ChartProperty>
<ChartProperty NAME="destination">metricDetail</ChartProperty>
<ChartProperty NAME="yAxisLabel">percent</ChartProperty>
</Chart>
</TopPane>
<MiddlePane>
<Chart TYPE="timeSeriesChart">
<ChartProperty NAME="metric">HostSummMem</ChartProperty>
<ChartProperty NAME="column">host_mem_usage</ChartProperty>
<ChartProperty NAME="width">375</ChartProperty>
<ChartProperty NAME="height">150</ChartProperty>
<ChartProperty NAME="legendPosition">south</ChartProperty>
<ChartProperty NAME="titleVisible">true</ChartProperty>
<ChartProperty NAME="title">ESX Memory Usage</ChartProperty>
<ChartProperty NAME="subtitle"> </ChartProperty>
<ChartProperty NAME="destination">metricDetail</ChartProperty>
<ChartProperty NAME="timeGranularity">days</ChartProperty>
</Chart>
<Chart TYPE="barChart">
<ChartProperty NAME="sql">select vm, cpu_usage from (select key_value as vm, value as cpu_usage from mgmt$metric_current where metric_name = 'VMSummCPU' and metric_column = 'vm_virtual_cpu_usage' and target_guid = ??HC_TARGET_GUID?? order by to_number(value) desc) where rownum < 6</ChartProperty>
<ChartProperty NAME="width">275</ChartProperty>
<ChartProperty NAME="height">150</ChartProperty>
<ChartProperty NAME="orientation">horizontal</ChartProperty>
<ChartProperty NAME="titleVisible">true</ChartProperty>
<ChartProperty NAME="title">Top 5 VM CPU Usage</ChartProperty>
<ChartProperty NAME="legendPosition">south</ChartProperty>
<ChartProperty NAME="barLegendLabel1">CPU Usage %</ChartProperty>
<ChartProperty NAME="destination">reportTab</ChartProperty>
<ChartProperty NAME="reportTitle">ESX Server CPU Usage</ChartProperty>
<ChartProperty NAME="xAxisLabel">%</ChartProperty>
<ChartProperty NAME="stacked">true</ChartProperty>
</Chart>
<Chart TYPE="barChart">
<ChartProperty NAME="sql">select vm, mem_usage from (select key_value as vm, value as mem_usage from mgmt$metric_current where metric_name = 'VMSummMem' and metric_column = 'vm_mem_usage' and target_guid = ??HC_TARGET_GUID?? order by to_number(value) desc) where rownum < 6</ChartProperty>
<ChartProperty NAME="width">275</ChartProperty>
<ChartProperty NAME="height">150</ChartProperty>
<ChartProperty NAME="orientation">horizontal</ChartProperty>
<ChartProperty NAME="titleVisible">true</ChartProperty>
<ChartProperty NAME="title">Top 5 VM Memory Usage</ChartProperty>
<ChartProperty NAME="legendPosition">south</ChartProperty>
<ChartProperty NAME="barLegendLabel1">Memory Usage %</ChartProperty>
<ChartProperty NAME="destination">reportTab</ChartProperty>
<ChartProperty NAME="reportTitle">ESX Server Memory Usage</ChartProperty>
<ChartProperty NAME="shadowEffect">3d</ChartProperty>
</Chart>
</MiddlePane>
</ChartSet>
</HomepageCharts>
3.3 Chart Properties
Between the beginning and ending Chart tags, you define how the chart should be rendered by specifying chart properties using ChartProperty tags. For example:
<ChartProperty NAME="legendPosition">default</ChartProperty>
You may specify as many ChartProperty tags a necessary to render the exact type of chart you want to appear. For example:
The following table lists chart properties that apply to all chart types.
Important:
ChartProperty values are case-sensitive| Option | Required | Values | Default | Description |
|---|---|---|---|---|
|
chartType |
Yes |
pieChart barChart timeSeriesChart |
NA |
Defines the chart display type: Bar, Time Series, or Pie. |
|
width |
No |
NA |
Defines the width of the chart graphic. This property only controls the size of the chart graphic itself and not any other elements which are rendered along with it, such as the title and subtitle. |
|
|
height |
No |
NA |
Defines the height of the chart graphic, this attribute only controls the size of the chart graphic itself and not any other elements which are rendered along with it, e.g. the title, subtitle, etc. |
|
|
timeGranularity |
No |
SECOND MINUTE HOUR DAY WEEK MONTH YEAR |
HOUR |
Defines the units used to display data for time series charts. |
|
legendPosition |
No |
For Pie Charts:
For Time Series/Bar Charts
|
default |
Controls the location of the chart. |
|
legendVisible |
No |
true/false/external |
true |
Determines whether or not the chart legend is displayed. Set this property to 'false' to hide the legend. To position the legend outside of the chart boundary, set this property to ;external. Position a legend external to a chart if you want to control the size of the image separately from the size of the legend. An "external" legend can contain any number of entries of any length without truncating text. Setting legendVisible="external" causes image generation to occur on the first pass. |
|
legendWidthFraction |
No |
> 0 <= 1 |
NA |
Specifies the fraction of the overall chart width that the legend should occupy, no default. |
|
legendHeightFraction |
No |
> 0 <= 1 |
NA |
Specifies the fraction of the overall chart height that the legend should occupy, no default. |
|
title |
No |
Text |
NA |
Defines the title string to be displayed in header element above chart graphic . |
|
titleVisible |
No |
true/false |
false |
Disables display of the title (header) created with the chart. This allows for the specification of a title attribute without its display. The title property is required for ADA compliance. |
|
subtitle |
No |
Text |
NA |
Text to appear in subtitle just below header element which includes title and above chart graphic. |
|
orientation |
No |
horizontal vertical |
Vertical |
Defines the visual orientation of the chart. Valid values are either "horizontal" or "vertical". This attribute is only valid with the chartType attribute set to barChart or timeSeriesChart, it has no affect on the pieChart. |
|
shadowEffect |
No |
none shadow 3d default |
default |
Determines whether charts appear with a shadow or 3-D effect. This property is only applies to bar and pie charts. There are three possible values for this attribute:
The default setting for bar charts is "none" and the default for pie charts is "3d". |
|
noDataMessage |
No |
Text |
"No data is currently available." |
Specifies the message that should appear in place of the chart if no data is available from the data source. If you do not specify a message, default message "No Data Available" will appear. In cases where the data source generates an exception message, the text of this message will be displayed in place of the chart graphic. |
|
sql |
No |
Valid SQL |
Defines the SQL query used to obtain data for chart generation. Depending on the type of chart, SQL queries must return:
Note: If the SQL text contains any XML syntax characters, then the SQL text should be embedded in a CDATA block. Also, if the target instance GUID is needed in the SQL query, HC_TARGET_GUID can be used. |
|
|
axisMin |
No |
Integer |
Defines the Y-Axis minimum value. |
|
|
axisMax |
No |
Integer |
Defines the Y Axis maximum value. |
|
|
xAxisLabel |
No |
Text |
NA |
For bar and line charts, a label to appear along the X-axis (string series or time series axis) label. |
|
showXAxisLabels |
No |
true/false |
true |
Controls the display of X-axis labels. “false” disables display of X-axis values (currently applies to bar charts only). |
|
yAxisLabel |
No |
Text |
NA |
For bar and line charts, a label to appear along the Y-axis (numeric axis). |
|
yAxisVisible |
No |
true/false |
false |
Disables the display of the Y-axis; valid values "true" or "false" (default). |
|
destination |
No |
metricDetail keyedMetricDetail reportTab |
Defines chart hyperlinks. See Section 3.4, "Linking from a Chart to Another Destination" for more information. |
|
|
reportTitle |
No |
Text |
NA |
Defines the chart title entry in the drop-down menu on the target Reports page. This property is only relevant when used in conjunction with the |
|
fill |
No |
none absolute cumulative |
none |
For line charts, fill allows the area under the lines to be filled (solid coloring) using the same color as the line. The fill property also provides a means of creating a stacked area chart. Valid Values:
When using the fill property, ensure that there is no confusion for users as to whether the data in the chart is cumulative or absolute |
Chart Type-Specific Properties
The following tables list chart properties that are specific to each of the three chart types (pie, time series, and bar).
Table 3-2 Time Series Chart Properties
| Option | Required | Values | Default | Description |
|---|---|---|---|---|
|
metric |
Yes |
Text |
NA |
A metric and column must be specified or a SQL statement that returns the appropriately formatted data. |
|
column |
Yes |
Text |
NA |
|
|
yAxisWidth |
No |
Forces the width of the Y-Axis to be a fixed size this allows the caller to specify the same width for a number of charts stacked vertically and thus have the axes aligned. |
Table 3-3 Pie Chart Properties
| Option | Required | Values | Default | Description |
|---|---|---|---|---|
|
pieValuesInLegend |
No |
value percent none |
none |
Defines whether or not values for pie slices are included in the legend along with the label for the pie slice. The default value for this attributes is “none”. If specified as either “percent” or “value” then the numeric value is displayed along with the pie slice label in the form, “pie slice label (numeric value)”. If “percent” is specified, then the percentage out of the total of all slice values is calculated and displayed, otherwise, the raw value of the slice is displayed. The pieValuesInLegend property is ignored for chartTypes other than pieChart and if the legendVisible attribute is set to “false”. |
|
pieSlicesFromColumn |
No |
true/false |
false |
Determines how data is retrieved from the data source for display in a pie chart. See "Linking from a Chart to Another Destination" for more details. This attribute is ignored for chartTypes other than pieChart. |
|
showSlicePercentLabels |
No |
true/false |
false |
Determines whether each slice is labeled with a percentage value. This property is ignored for chartTypes other than pieChart. |
|
showSliceValueLabels |
No |
true/false |
false |
Determines whether each slice is labeled with the raw numeric value for that slice. This attribute is ignored for chartTypes other than pieChart. |
|
hideZeroSlices |
No |
true/false |
false |
When set to "true", this property remove entries from the legend for any slice with a zero value. |
Table 3-4 Bar Chart Properties
| Option | Required | Values | Default | Description |
|---|---|---|---|---|
|
barLegendLabel# |
Yes |
Integer |
None |
Specifies that a legend label be associated with each data stream. # starts at 1 and represents a data stream. If you are only going to have one bar for each key, you would only have barLegendLabel1. If you are going to have more than one bar for each key, you would specify barLegendLabel1,... barLegendLabelN (where N is the number of the last data stream). |
|
stacked |
No |
true/false |
false |
When set to "true", displays stacked bars for each key value of a bar chart. |
3.4 Linking from a Chart to Another Destination
Any chart appearing on the target home page can be linked to another destination that provides more information/greater detail. This provides users with easy 'drill-down' access to pertinent information.
You make a chart linkable by setting the destination chart property. The Management Plug-in framework allows you to link a chart to one of three destinations:
-
metricDetail - Links the chart to a Metric Detail page displaying a time series chart.
-
keyedMetricDetail - Links the chart to a Metric Detail page for a metric with keys. A table with values for each key is displayed.
-
reportTab - Links the chart to a report that has been developed for the Management Plug-in registered so that it appears on the target Reports page (Reports subtab). The administrator must be registered to view the report.
The following example implements a time series chart that is linked to the Response Metric Detail page.
<Chart TYPE="timeSeriesChart">
        <ChartProperty NAME="metric">Response</ChartProperty>
        <ChartProperty NAME="column">Load</ChartProperty>
        <ChartProperty NAME="width">300</ChartProperty>
        <ChartProperty NAME="height">150</ChartProperty>
        <ChartProperty NAME="legendPosition">south</ChartProperty>
        <ChartProperty NAME="titleVisible">true</ChartProperty>
        <ChartProperty NAME="title">CPU 1 Minute Load Average</ChartProperty>
        <ChartProperty NAME="subtitle"> </ChartProperty>
        <ChartProperty NAME="destination">metricDetail</ChartProperty>
</Chart>
Required Chart Property Values for Destinations
Depending on the destination type, linked charts require that certain chart properties be included with the chart definition.
metricDetail and keyedMetricDetail
To link a chart to either a Metric Detail page or a Metric Detail page for keys, the required chart properties are column, metric, and timeGranularity.
If both metric and column properties have already been defined, those values will be used to generate a link for that metric. All that is required is to specify the appropriate destination type (metricDetail or keyedMetricDetail). Implementing links in this way makes it possible to create a chart that can link to a Metric Detail page via custom SQL queries (when metric and column properties would normally not be specified).
The timeGranularity property will default to HOUR if it is not explicitly defined as part of the chart definition. However, if this property had already been specified in the chart definition, it will be used for the link as well.
To link a chart to a report, the reportTitle chart property is required.
3.5 Adding Home Page Charts to the Management Plug-in Archive
Once you have defined your home page charts file, you use the Enterprise Manager Command Line Interface (EMCLI) verb add_mp_to_mpa to add the new home page chart definition file to a Management Plug-in Archive. As shown in the following example, you specify HOMEPAGE_DEFINITION as the file type to add a home page chart definition file to the plug-in archive.
Example 3-2 Using EMCLI to Create a Management Plug-in Archive
./emcli add_mp_to_mpa
     -mpa=host_sample.jar -mp_version=1.0
     -ttd=host_sample_ttd.xml
     -dc=host_sample_dc.xml
     -file="MONITORING_SCRIPT:data_collector.pl"
     -file="REPORT_DEFINITION:host_sample_perf_report.sql"
     -file="REPORT_DEFINITION:host_sample_config_report.sql"
     -file="HOMEPAGE_DEFINITION:host_sample_homepage_charts.xml"
     -func_desc="Demo Plug-in: Linux host monitoring."
     -req_desc="Requirements: Requires that the Agent that hosts the target instances be running on Linux. If the 'Use Fake Data' property is set when adding a target instance, then all data provided will be generated and a Linux Agent is not required.";
At this point, you are now ready to use Enterprise Manager to import and deploy the new Management Plug-in. Once you add a target instance of the plug-in target type, your newly defined charts will appear on the target home page.