4 Setting Up and Using the AD4J Console
This chapter provides information about the administration tasks that you can perform with Oracle Application Diagnostics For Java (Oracle AD4J). In particular, the chapter covers the following:
Note:
By default, Oracle AD4J Agent will write the following files to /tmp (C:\ on Windows):-
Heapdump file
Change for specific JVM from the Setup -> JVMs -> Edit JVM -> Heapdump Dir.
-
Extract and load native libraries
Change the parameter jamlibdir in the file jamserv/jam/jamagent/WEB-INF and rebuild wars.
-
Log file (only on Windows)
This is always written to C:\
Oracle AD4J Console Setup
If you have followed the default installation, the console should be accessible from the URL
http://console01.mycompany.com:3500
Where console01.mycompany.com is the name of the server you have installed the console on. You can also access the console using the IP address zzz.zzz.zzz.zzz for the server.
Note:
The default port for Linux is 3500 and for Windows, it is 80. If you are using HTTPS, the default port number will be different.Assumptions
This guide assumes the following:
-
Console is installed and running
-
Console has been configured correctly with a repository database
-
Database agents are installed and running
-
Java agents are installed and running
For details on how to set up the console and agents, refer to the Oracle AD4J Installation Notes.
JVM Console Diagnostics
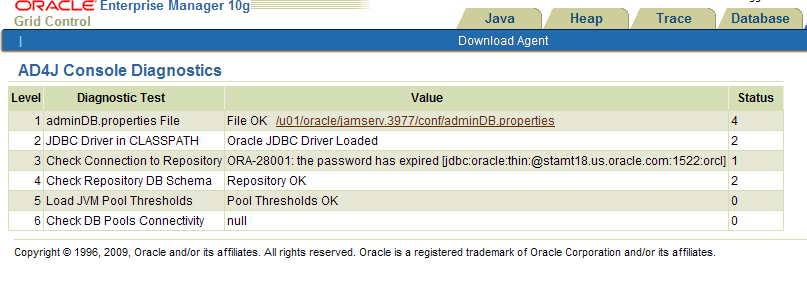
When you first access the console, it will take you to the Setup tab and run Diagnostics. Here, you can see the information about the configuration of the console and the errors (if any). For example, if a connection to the console repository cannot be established for any reason, it would show up here along with some debug information.
Console Login Screen
You are taken to the Login screen if you want to modify any admin information on the Oracle AD4J console. Login as the administrator to continue. The default administrator username and password is admin and welcome. You will need to change the password after your first login.
You get the following screen if you try logging in again before timeout.
DB Connection Information
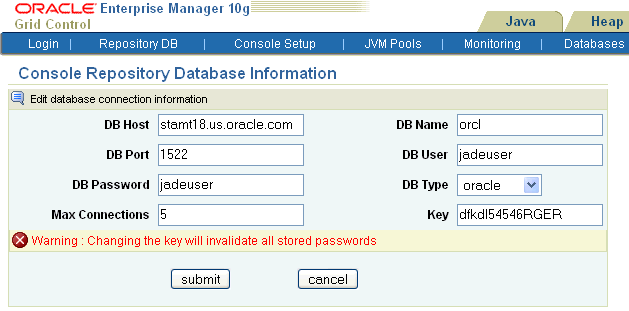
The adminDB.properties file stores connection information about the repository database. The file resides in the location specified by the start up parameter jampropfilepath.
Click on the adminDB.properties link to create the file:
Enter the fields with a valid DB Connection Information. Refer to the Oracle AD4J Console Install Note for details.
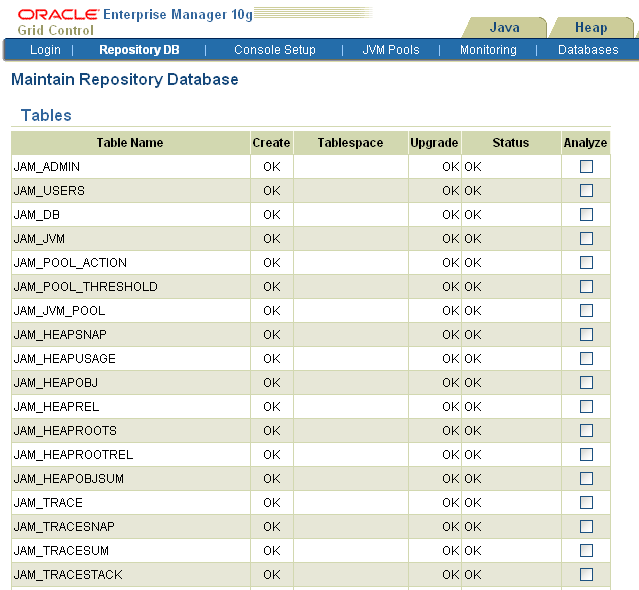
Repository DB Page
From this page you can create and/or view the tables and indexes in the database that are being used by the Oracle AD4J console.
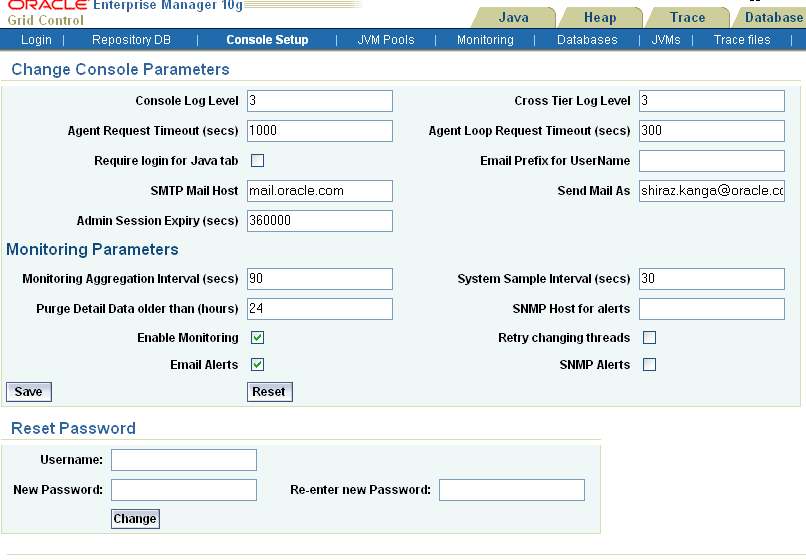
Console Setup Page
This page is used to set console parameters and reset lost passwords.
Console Log Level, Cross Tier Log Level: Verbosity of console log messages. Increase only when advised by Oracle Support.
Agent Request Timeout, Agent Loop Request Timeout: Increase if the monitored JVMs are extremely busy and the console times out and disconnects waiting for their response.
Require login for Java tab: Enable this checkbox to restrict access to other (non-setup Tabs). Users will need to login with valid accounts (created from the Users screen) and will have access to all non-setup screens. The setup screens can only be accessed by the ADMIN user.
Enable Monitoring: With this checkbox enabled, JVMs belonging to selected pools will be polled for active requests periodically. This data is available on the NOC and in the last 90 seconds/24 hrs charts.
Email Alerts: Email alerts based upon threshold violations (requires monitoring to be enabled).
Email Prefix for UserName, SMTP Mail Host, Send Mail As: Parameters used for emailing alerts.
SNMP Alerts: Send SNMP traps for threshold violations (requires monitoring to be enabled).
SNMP Host for Alerts: SNMP Host to send alerts to.
Reset Password Screen can be used to reset lost passwords and does not require old password.
JVM Pool Info
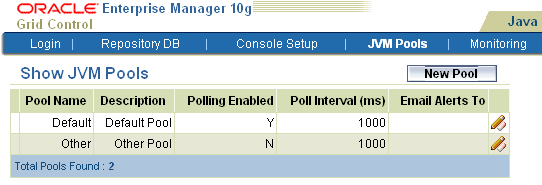
You can group sets of JVMs into JVM pools that provide monitoring information across all related JVMs in a single view. This table displays all the JVM pools in the system. You can view all available pools, delete existing pools or add new pools. The Default and Other pools cannot be deleted. Any user defined pools can be deleted.
Each row displays whether polling is currently enabled for the pool, the polling interval, and the email notification recipient. If the Polling Enabled flag is set to Y, JVMs belonging to this pool will be polled for active requests periodically based on the Poll Interval. You can click on the Edit icon to edit the JVM pool or click on New Pool to add a new JVM Pool.
Updating a JVM Pool
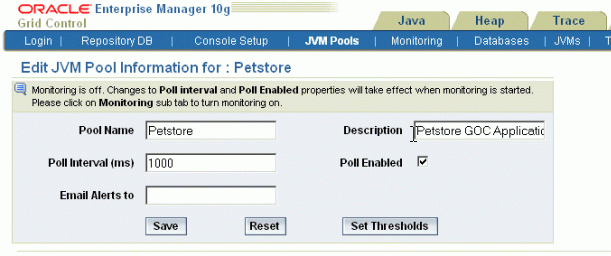
To update a JVM Pool, click the Edit icon in the Show JVM Pools page. The Edit JVM Pool page is displayed:
Poll interval (ms): Sample interval for JVMs belonging to this pool when monitoring (polling) is enabled.
Poll Enabled: Enable monitoring for this pool.
Email Alerts to: Email Alias/list to email this pool's alerts to.
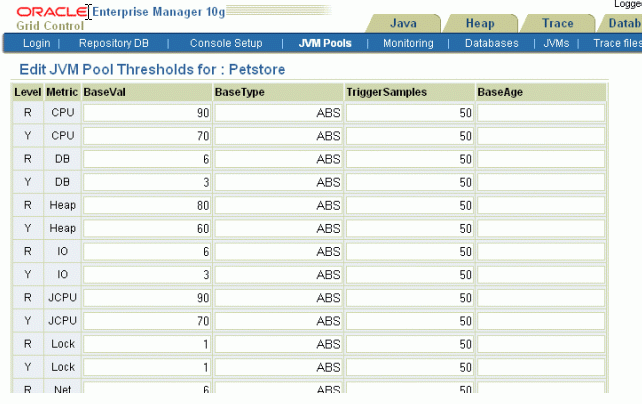
Update Pool Thresholds
Threshold violations can have a Level of R (Red) or Y (Yellow). The Metric is the attribute being monitored and the Threshold is the value against which that metric is being compared. A violation occurs when the threshold is exceeded after a minimum number of samples have been monitored. Threshold units are % CPU Utilization for Machine CPU (CPU), JVM CPU (CPU), % Heap Utilization for Heap, number of threads in that state for others. 3 to 5 threads active in DB for more than 50% of the samples will cause an amber (Y) alert for DB, while 6+ threads active in DB wait state for more than 50% of the samples will cause a red alert for DB.
Action URL is the URL to be invoked when a threshold violation occurs. This includes internal URLs into the AD4J console and external URLs. The Action URL can be any valid URL on a remote system. It can also accept URLs on the local AD4J Console. It can be used to trace a particular thread, all active threads, or dump a heap in response to a threshold violation.
The Action URL should be a valid URL as called from a browser. If not specified, default parameters for the traceThread and heapdump will be added to the URL. If the Action URL specifies a host that is different from the current console host, you must navigate to the Console Setup page and uncheck the Require Login for Java Tab checkbox.
A sample URL template for Tracing Threads is given below:
http://localhost/jvmTraceActive.jsp?traceThread=allactive&JVM_THREAD_ID=&JVM_ID=1&JVM_MACHINE=machine_name&JVM_PORT=8080&pollInterval=50&pollDuration=10&samplesfilename=traceactive&detailsfile=on
where:
-
traceThreadis the name of the thread to be traced. If you want to trace all the active threads, specify the value as traceThread=allactive. This is the value in the Thread column in the View All Threads page. -
JVM_THREAD_IDis the ID of the thread to be traced. If you want to trace all active threads or iftraceThread=allactive, theJVM_THREAD_IDparameter must be blank. This is the value specified in theOS PIDcolumn in the View All Threads page. -
JVM_ID,JVM_MACHINE,JVM_PORTare the ID, machine name, and port number of the JVM Agent on which the thread or threads to be trace are running. For example, if the text displayed at the top of the View All Threads page is -Name: machine_name:8080 ID: 1: Linux-2.6.9-55.0.0.0.2.EL: Sun Microsystems Inc.: 1.6.0_07-
machine_nameis theJVM_MACHINE -
8080is theJVM_PORT -
1is theJVM_ID(If theJVM_IDparameter is not supplied in the URL, it is automatically appended by the Console)
-
-
PollIntervalis the time interval (in milliseconds) between successive samples. The default value is 50. -
PollDurationis the duration (in seconds) for the trace. The default value is 10. -
Samplesfilenameis the prefix of the trace sample file name created on the console machine. The default value istraceactiveand an unique identifier is added as a suffix to each trace file that is created. -
Detailsfileis the sample thread stack in addition to the state. You must set this toOnif you require complete thread details. The default is On.
A sample URL for heapdump is given below:
http://localhost/jvmHeapDump.jsp?JVM_ID=1&JVM_MACHINE=machine_name&JVM_PORT=8080&JVM_DUMP_FILE=heapdump <http://localhost/jvmHeapDump.jsp?JVM_ID=1&JVM_MACHINE=machine_name&JVM_PORT=8080&JVM_DUMP_FILE=heapdump>
The following parameters are required in the URL for heapdump.
-
JVM_ID,JVM_MACHINE, andJVM_PORTare the same parameters as specified for the Tracing Threads template. -
JVM_DUMP_FILEis the prefix of the heap dump file name on the agent. An unique identifier is added as a suffix to each heap dump file.
Database Information
Use this screen to view information about the databases being monitored/profiled currently or to add additional databases for the same.
Click the Edit icon to edit an existing database or click Register NewDB to register a new database.
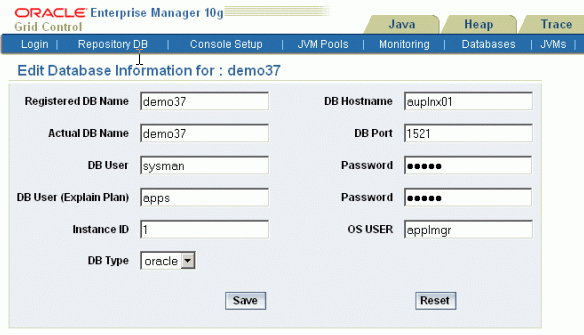
Register New Database/Update Screen
Enter the database information in the New
Registered DB Name: Provide a user friendly name for Oracle AD4J to display.
DB Hostname: Database server for this monitored instance.
Actual DB Name: Actual Oracle SID for the monitored DB.
DB Port: Oracle Net Listener Port on the DB Server.
DB User: DB User to use for querying database information.
Password: (only in update/new mode) : The password for the DB User.
DB User (Explain Plan): Application DB User account to use for explain plan analysis.
DB OS User: Operating System User which owns the database.
JVM Information Page
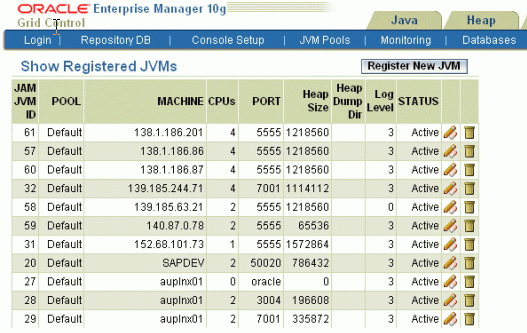
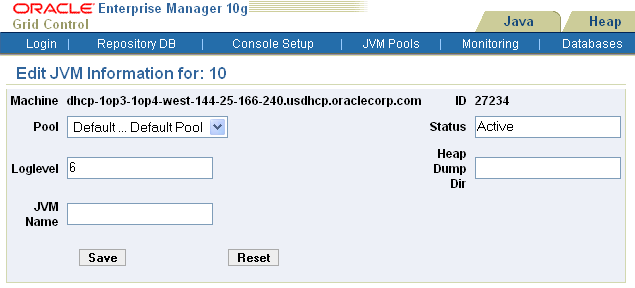
Lists all the JVMs that have connected to the console. You can edit the JVM parameters using the edit icon, or delete old JVMs that no longer connect to the console.
You can assign a JVM to a different pool, change it's log level (if recommended by Support) or change the temporary directory where the heap snapshots are dumped.
Monitoring
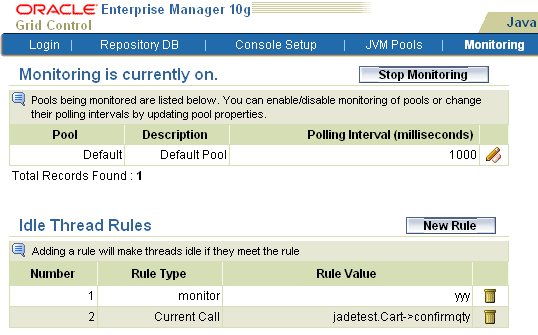
Once you have updated a JVM pool with polling enabled, you can monitor the JVMs in that pool.
Click on the Start Monitoring link above to start monitoring. This can also be done from the Console Setup Screen. You can enable or disable monitoring of pools or change their polling intervals by updating the pool properties.
You can mark a thread as idle by adding it to an Idle Thread Rule. All threads that have been marked as idle will not be monitored. Click New Rule to create a new Idle Thread Rule. The Rule Type can be:
-
Monitor (Waiting on Lock): Select this type if you want to ignore all threads that are locked.
-
Current Call: Select this type if you want to ignore all threads that are making a call to the selected function.
The Rule Value should contain the class name, method, followed by class+method. An example of a Current Call is weblogic.socket.PosixSocketMuxer->processSockets. An example of a Monitor (Waiting on Lock) is weblogic.socket.PosixSocketMuxer$1.
All threads that meet the criteria specified in the Idle Thread Rule will not appear in the View Active Threads screen.
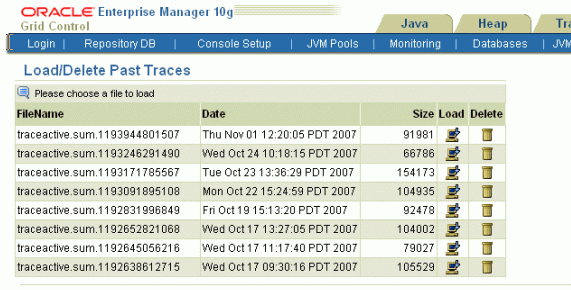
Manage Trace Files
Use this screen to:
-
Delete trace files from the traces you have run.
-
Load a trace file from another console. You'll need to move the trace file(s) to the
jamserv/tracedirectory for them to visible in this screen.
Manage Users
From this screen, you can create non-admin user accounts for accessing the Oracle AD4J console.
Download Agent
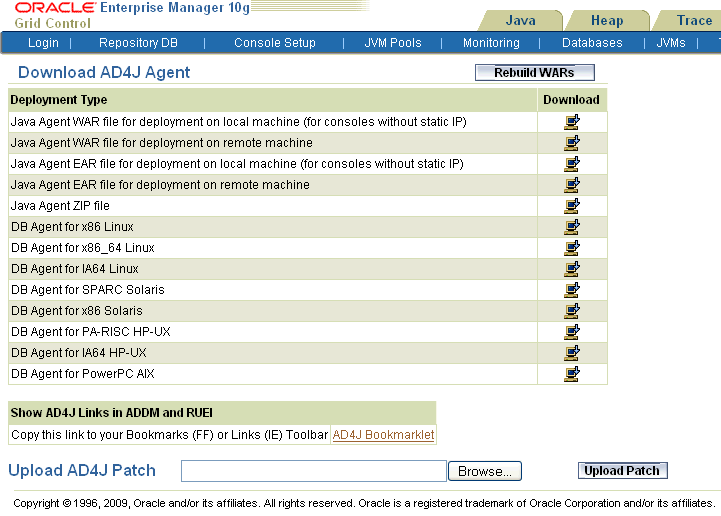
Use this screen to download Java and database agents for deployment on remotely monitored JVMs or databases. Depending on the format supported by your application server, or if it is remote or local (on the same host as the console), you can select a war or ear file for the Java agent.
If you are running a standalone Java application then you can select the zip file. For database agents, you can select the correct one for the platform on which you are running the Oracle database to be monitored. The Java agents contain the IP address of the console. If your console IP address changes, you need to click on Rebuild WARs, download a new agent and deploy it.
Note:
The rest of this screen should be used only with instructions from Oracle support.