| Oracle® Retail Merchandising Implementation Guide Release 15.0 E65391-01 |
|

 Previous |
 Next |
This chapter provides an overview of Oracle Retail Operational Insights (OI).
Oracle Retail Operational Insights dashboards and reports provide pervasive Business Intelligence. To provide a seamless user experience, they are designed to be embedded in a single sign on environment within Retail Merchandising Fusion Application like ReSA/ReIM/Allocation.Operational Insights dashboards and reports have integrated data sources, including Oracle Retail Merchandising System (RMS) for foundation data and ReSA/ReIM/Allocation for transactional data from their corresponding applications. The standard reporting tool for Operational Insights dashboards and reports is Oracle Business Intelligence Enterprise Edition (OBIEE).
Using OBIEE11g, a rich metadata layer is created hiding the complexities of the base transactional systems
The reports and dashboards are created using OBIEE Answers and embedded into Retail Merchandising Fusion Application ADF screens. The Oracle Retail Operational Insights dashboards and reports provide the ability to drill to lower level of detail and launch to application screens to execute tasks thus enabling actionable, and close loop BI.
The contextual BI reports in ADF application screens provides additional contextual insights related to the primary information displayed in the main dashboard report or in the contextual pane of application screen. The pervasive contextual BI reports give an user additional insight into the data that they see in a dashboard or application UI screen to make better decisions and drive efficiencies in the process.
The contextual BI reports for application screens other than the main dashboard screen appear in an expandable pane to the right of the main application screen.
This section covers the following topics:
This section provides a list of factors that should be taken into account when making sizing plans. There are two major hardware components that make up the Operational Insights dashboards and reports physical environment:
Middle Tier Application Server - The middle tier application server hosts software components such as the Oracle WebLogic Server and Oracle Business Intelligence Enterprise Edition (EE).
Database - The Oracle Database stores large amounts of data that are queried while generating Oracle BI reports. The report query processing is heavily dependent on the hardware sizing decision. Operational Reports are a light reporting solution which leverages the Retail Merchandising Fusion Application application database schema and directly reports off it.
Sizing is customer-specific. The sizing of the Operational Insights dashboards and reports application is sensitive to a wide variety of factors. Therefore, sizing must be determined on an individual installation basis. The database sizing is driven mostly by the base Retail Merchandising Fusion Application requirements.
Testing is essential as with any large application. Extensive testing is essential for determining the best configuration of hardware.
The following factors must be considered for sizing:
Application Server
Report Complexity - Reports processed through Oracle BI can range from very simple one-table reports to very complex reports with multiple-table joins and in-line nested queries. The application server receives data from the database and converts it into report screens. The mix of reports that you run heavily influence the sizing decision.
Number of Concurrent Users - The Operational Insights dashboards and reports embedded in Retail Merchandising Fusion Application are designed for multiple concurrent users. When more users are running reports simultaneously, more resources are necessary to handle the reporting workload. For more details on Clustering and Load Balancing, see the Oracle Business Intelligence Enterprise Edition Deployment Guide.
Hardware Architecture
Number and Speed of Processors - More and faster processors speed report query processing in the database. The application server needs fewer resources than the database.
Memory - More memory enables a larger SGA in the database and will reduce the processing time for report queries.
Network - Since the data from the report queries needs to go from the back-end database to the application server, a faster network is better than a slower network, but this is a relatively low priority.
The Operational reports can be divided into following three categories:
The Dashboard Reports - The dashboard surfaces information in a manner that help users like Allocators, sales auditors, finance managers, etc, prioritize their day-to-day activities as well as quickly identify areas of concern. The dashboard allows you to look at a consolidated view of their to-dos and then directly contextually launch into the corresponding application screens to take an action thus enabling actionable and closed loop BI.
Contextual BI Reports - Contextual BI Reports are displayed in the contextual pane of the Retail Merchandising Fusion Application windows. Contextual BI reports provide additional in context insights to the data being viewed in the application screen. This kind of pervasive BI reports enable you to take quicker and more informed actions thus driving workforce efficiencies.
Adhoc Reports - Adhoc reporting of Oracle Retail Operational Insights metrics and attributes through OBIEE Answers is supported in 15.0 release. Adhoc reporting privilege through standalone OBIEE Answers is limited to Administrator role in current release. Due to transactional nature of the underlying schema for Operational Insights, the adhoc reporting requirements and their performance impact on base transactional schema should be carefully analyzed by Administrator. Performance tuning of adhoc reports against Oracle Retail Operational Insights metrics and attributes is not supported in current release. For more information on details related to the metrics usage for adhoc reporting, see the Oracle Retail Operational Insights User Guide.
For more information, see the Oracle Retail Operational Insights User Guide.
|
Note: The Operational Insights dashboard can be accessed in a standalone OBIEE environment. Use of the Operational Insights contextual reports in standalone OBIEE is not supported due to dependencies on application input parameters. |
Operational Insights dashboards and reports provide pervasive Business Intelligence when implemented in a Single Sign-On environment. To provide a seamless user experience, they are designed to be embedded within the Retail Merchandising Fusion Applications like Allocation, ReIM, and ReSA.
|
Note: The Single Sign-On (SSO) implementation for Oracle Retail Operational Insights dashboards and reports is mandatory in production environments because it has contextual BI reports and in context launches into application screens apart from dashboard reports. Because accessing the Operational Insights reports from the application UI in the absence of SSO poses a security risk, the use of integrated Operational Insights reports in Retail Merchandising Fusion Application UI without SSO is not supported in this release. In the absence of SSO, the Oracle Retail Operational Insights dashboard can be accessed in a standalone Oracle Business Intelligence Enterprise Edition (OBIEE) environment. The use of the Operational Insights contextual reports in a standalone OBIEE environment is not supported due to dependencies on application input parameters. |
For more information on security configuration and implementation, see the Oracle Retail Merchandising Operations Management Security Guide.
Internationalization is the process of creating software that can be translated more easily. Changes to the code are not specific to any particular market. Operational Insights dashboards and reports has been internationalized to support multiple languages.
|
Note: Operational Insights dashboards and reports use ISO codes for all the supported languages. Oracle Retail Operational Insights dashboards and reports look up RMS language codes. In the case a language supported by Oracle Retail Operational Insights dashboards and reports is not available in the source system, then the Primary language of RMS is used. |
This section describes configuration settings and features of the software that ensure that the base application can handle multiple languages.
Translation is the process of interpreting and adapting text from one language into another. Although the code itself is not translated, components of the application that are translated include the following:
Graphical User Interface (GUI)
Data translations for Item description, Store name, Tender Type Group, and item differentiators
Report titles
The user interface for Operational Insights dashboards and reports has been translated into:
Chinese (simplified)
Chinese (traditional)
Croatian
Dutch
French
German
Greek
Hungarian
Italian
Japanese
Korean
Polish
Portuguese (Brazilian)
Russian
Spanish
Swedish
Turkish
Operational Insights Dashboards and reports displays the reports in the same language as the base Retail Merchandising Fusion Application by accepting the language and locale parameters from the application. The language and locale can be set for a user using the My Account OBIEE preferences as shown below. The language and locale setting in OBIEE My Account preferences is however overwritten by the language and locale parameter passed from the Retail Merchandising Fusion Application once the reports are accessed from within the application (embedded in application).
Oracle Retail Operational Insights dashboards and reports are supported in eighteen languages. This section provides details on the various scenarios that one may come across during implementation.
Since multi-language data support in Oracle Retail Operational Insights is dependent on the availability of the multi-language data in the source system, it is important to understand various scenarios one may encounter. Before proceeding review the following facts about multi-language support:
Operational Insights dashboards and reports programs extract multi-language data from the source systems.
Depending on the implementation, the source system may or may not have data for a particular supported language(s). For example, RMS supports Item Descriptions in multiple languages but the item's description may not be available in the translated languages. For source system released languages, see the Oracle Retail Merchandising System Operations Guide.
Scenario 1
All the supported languages are implemented in Operational Insights dashboards and reports and are the same set of languages that are supported in the source system as well. Multi-lingual data sets are enabled in both Operational Insights and the source Retail Merchandising Fusion Application.
Data Scenario 1a
Translated data exists for all records in Source System: This is an ideal scenario where the source system supports data for the same set of languages as Oracle Retail Operational Insights and data for the required column exists in all the languages in the source system. In this scenario, the attributes that are supported for multi-languages get all the multi-language data in Oracle Retail Operational Insights.
Data Scenario 1b
Translated data does not exist for some of the records in the source system. For the attributes for which data is not available in the source system, Operational Insights dashboards and reports display the attribute in the source system's primary language. For example, Operational Insights dashboards and reports request data in German and English languages. In RMS, the Item Attribute description is not available in the German language but is available in the English language. Operational Insights dashboards and reports display Item description in English to a user who is logged into Oracle BI EE (assuming English is the primary language of RMS for that implementation).
Currency Conversion
Operational Insights supports both primary currency and local currency. The Operational Insights reports support this in the following way:
Oracle Retail Operational Insights for ReSA - For the following reports where amounts are aggregated across stores, if the auditor has stores assigned that have varied local currencies, the amounts are displayed in primary currency only. If all auditor stores have the same common local currency, the amounts are displayed in local currency.
Over/Short Summary Report on Dashboard
Over/Short History Report on Store Day Search Window
For the following reports where amounts are displayed for a single store selected in the ReSA window, the values are displayed in the currency selected in the currency toggle of the corresponding ReSA window (Primary or Local). On window launch, Local Currency is the default.
Cashier/Register Over Short Report on Store Day Summary Window
Tender Summary Report on Tender Summary Window
Oracle Retail Operational Insights for ReIM - In ReIM, data is displayed in primary or supplier currency depending on the report.
In the supplier detail report, data is displayed in supplier currency
In the invoice detail report, data is displayed in primary currency
Oracle Retail Operational Insights for Allocation - In Allocation, top sales and bottom sales report are displayed in primary currency although the data stored in the database is in the local currency.
Number Format
This is not a user preference in OBIEE. This format is set at report level that is common for all users.
Date Format
The date format is based on the users language/locale and is independent of the date format selected within the Retail Merchandising Fusion Application.
Operational Insights dashboards and reports is a light weight reporting solution and provides efficient access to operational data through the delivered pre-defined reports and dashboards that are embedded in the application ADF User Interface along with adhoc reporting capabilities. For any transactional reporting solution, including Operational Insights, smart decisions on how to implement and run your operational reporting system ensure that you are getting the most out of it. This section contains information that helps you get the best performance out of Operational Insights and identifies common contributors that can weaken performance, as well as best practices that ensure Operational Insights is running in the most optimal manner. All implementations are unique and the factors that are beneficial for one implementation may not have the same effect for all the implementations. It is a good practice to test several settings/approaches for the factors and recommendations listed below and use the ones that work best for your environment. The factors listed in this chapter are the key factors that impact performance but no absolute values or settings can be provided for implementation purposes due to the uniqueness of each environment.
Operational Insights uses Oracle Business Intelligence (OBIEE) for operational reporting purposes. The recommendations in this section focus on front end (OBIEE) components of Operational Insights dashboards and reports.
Operational Insights is an extensible and customizable solution and customers can customize the reports and dashboards in OBIEE. The pre-defined reports and dashboards that are delivered for the different Retail Fusion Applications are meant to be a reference implementation of how customers can leverage the power of BI integrated into the applications. The performance of these reports and dashboards may vary from one implementation to another and the reports can be easily modified to account for any performance concerns at the time of implementation. Customers are advised to consider their data profiles and volumes to decide how to best configure and customize the reports to meet their functional and operational needs and account for any performance issues.
The following key factors exist:
Based on the complexity of the report, OBIEE sometimes generates complex SQL, causing the Oracle Database to pick a less than optimized execution plan. In order to avoid this scenario, it is recommended that you enable the SQL Plan Baseline functionality of the Oracle 11gR2 (it is disabled by default). For more details, see the Oracle 11gR2 Performance Tuning Guide.
Operational reporting queries sometimes require retrieval of large amounts of data. Since Operational Insights dashboards and reports are embedded within application window, thus all caching is disabled at installation time. This enables any change to data in application to be immediately reflected in the reports. For example in the Oracle Retail Operational Insights for ReSA application, when one updates the item quantity for a particular store, the status of the store changes from partially loaded to fully loaded. Hence, to reflect this change immediately it is essential that the OBIEE cache is disabled. However if the implementation does not require real time data updates for effective usage of Oracle Retail Operational Insights then caching can be a powerful performance enhancement technique.
The Oracle BI server can save the results of a query in cache files and then reuse those results later when a similar query is requested. Using the middle-tier cache permits a query to be run one time for multiple requests of a report and not necessarily every time the query is run. The query cache allows the Oracle BI Server to satisfy many subsequent query requests without having to access back-end data sources (such as the Oracle database). This reduction in communication costs can dramatically decrease query response time.
To summarize, query caching has the following advantages only when the same report is run repeatedly:
Improvement of query performance
Less network traffic
Reduction in database processing and charge back
Reduction in Oracle BI server processing overhead
For more details on caching, see the Oracle Business Intelligence System Administration Guide.
Data Base Configuration/Partitioning strategy/ Purging and Archiving Strategy - Oracle Retail Operational Insights dashboards and reports are built on Retail Merchandising Fusion Application (Allocation/ReIM/ReSA/RMS) database which is based on Oracle Database 12c Enterprise Edition Release 12.1.0.1.4 and must be optimized and configured for a retailers' needs. Adequate Hardware ResourcesDatabase Connections
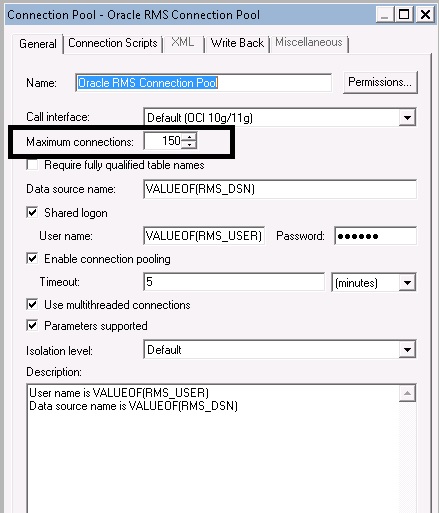
Establishing a optimum number of connections settings to the database is a step that must be completed prior to using any of the Operational Insights reports. The number of concurrent sessions set in the database must be according to the retailer's size and usage of the product. The number of connections within OBIEE rpd for Operational Insights must be set to an optimum.
Set the maximum connections for a Connection Pool to a reasonable level. In general, you can use the rule that one connection consumes about 1 MB of server memory. Note that connections are only started when needed. The maximum connections property specifies how many connections are maintained after they have been started. The time out property tells the Oracle BI Server how long to maintain unused connections in the pool.
It is recommended that you set the maximum connections to 20% of the simultaneous users multiplied by the maximum number of reports open on any given dashboard. For example, assuming you have 100 users and only 20% are going to be logged on at any one time and running reports, and the maximum number of reports on any given dashboard is four, then the maximum connections should be set to 80. Keep in mind that four reports could use more than four connections if any report (Logical SQL) generates multiple physical SQL queries, because one connection is used for each physical SQL statement. For more information, see Setup and Configuration.
For more information on calculating the optimum number of database connections, see the Max Connections Formula for Connection Pools by OBIEE (Doc ID 795846.1).
The maximum connections are set within the rpd connection pool as follows:
This section describes leading practices.
From release 15.0, changes to pre-packaged Oracle Retail Operational Insights dashboards and reports and Operational Insights rpd meta data model are subject to standard customization support policies. Any customizations made should follow an extensive analysis to ensure no performance impacts to transactional system users. Changes and modifications to the Operational Insights delivered code or development of new code is considered customization. Operational Insights does not support custom code developed by clients unless the issue related to customization can be recreated using Operational Insights delivered objects.
The following recommendations should help you in maintaining the Operational Insights code:
Naming convention - It is recommended that you use a good and consistent naming convention when customizing Operational Insights dashboards and reports code or when building a new code in the Oracle Retail Operational Insights dashboards and reports environment.
As a best practice, keep all the documentation up-to-date for capturing any changes or new code that has been developed at a site.
While creating custom reports, refer to the following guidelines:
Understand capabilities of adhoc reporting. For more information, see the Oracle Retail Operational Insights User Guide.
Report developers should be trained in Oracle BI to learn how to design reports in the most optimal manner.
Design reports at the highest level possible and allow drill down to more detailed levels when required.
Design reports in a manner that allows multiple users to utilize a single report output rather than multiple users running the same report. A best practice is to run one report and distribute that report to multiple users. For more information on how to distribute reports, see the Oracle Business Intelligence Enterprise Edition User Guide and the Oracle Business Intelligence System Administration Guide.
Do not design reports to request data at a level lower than the minimum level that a metric can be reported. In addition, drilling must not be performed at these levels. This ensures that reports do not produce misleading or invalid results.
Evaluate and purge reports periodically to eliminate any outdated or duplicate reports.
Design reports to use the least amount of fact areas necessary. This reduces the number of fact table joins and in turn reduces the risk of poor report performance. Try creating separate reports with one or two fact areas on the report at a time and combining the results after these reports have run successfully.
Design reports with the least number of metrics necessary.
Schedule reports according to priority. This ensures that critical reports are available when needed. For more information on how to schedule reports, see the Oracle Business Intelligence System Administration Guide.
Oracle Retail Operational Insights dashboards and reports is built on Oracle Database 12c Enterprise Edition Release 12.1.0.1.4 and must be optimized and configured for a retailers' needs.
The following are the Oracle BI EE best practices:
Create aliases for the objects created in the physical layer for usability purposes.
Any level key on ident's must be set to non-drillable.
In the presentation layer, fact folders (presentation tables) must contain only metrics and dimension folders (presentation tables) must contain only attributes.
For a development environment, it is recommended that you use a multi-user environment. For more information on setting up a multi-user environment, see the Oracle Business Intelligence System Administration Guide.
The following issues may be encountered while implementing Oracle Retail Operational Insights dashboards and reports. The accompanying solutions should help you work through these issues.
Issue:
Why am I getting the Login Denied error with the following message when I try to run a report using Oracle BI Presentation Services?
ORACLE ERROR CODE: 1017, MESSAGE: ORA-01017: INVALID USERNAME/PASSWORD; LOGON DENIED
Solution:
Ensure that the repository connection pool has the right login credentials in the Oracle BI Administration Tool and check the tnsnames.ora file.
Issue:
I am getting the following error when I performed the Update all Row Counts task from the Oracle BI Administration tool.UNABLE TO CONNECT DATABASE USING CONNECTION POOL
Solution:
Ensure the repository connection pool has the right login credentials in Oracle BI Administration tool or check the tnsnames.ora entry.
Issue:
Why can't I see the query activity at the individual user level in the NQQUERY.LOG file?
Solution:
Check the Logging Level field in the User window in the User tab. If the logging level is set to zero, the administrator may have disabled query logging. Contact the Oracle BI Administrator to enable query logging.
Issue:
When a user logins to the portal, the reports do not show data.
Solution:
Check if the user has stores assigned to him.
Accessibility involves making your application usable for persons with disabilities such as low vision or blindness, deafness, or other physical limitations. This means creating applications that can be used without a mouse (keyboard only), used with a screen reader for blind or low-vision users, and used without reliance on sound, color, or animation and timing. Application Development Framework (ADF) Faces user interface components have built-in accessibility support for visually and physically impaired users. User agents such as a Web browser rendering to nonvisual media such as a screen reader can read component text descriptions to provide useful information to impaired users.
Operational Insights uses OBIEE for embedding dashboards and reports in Retail Merchandising Fusion Application ADF screens. Users need to set the accessibility parameter within the Retail Merchandising Fusion Application. This parameter is then passed to OBIEE which then renders all dashboards and reports in accessibility mode.
ADF Faces provides two levels of application accessibility support:
Default: By default, ADF Faces generates components that have rich user interface interaction, and are also accessible through the keyboard. Note that in the default mode, screen readers cannot access all ADF Faces components. If a visually impaired user is using a screen reader, it is recommended to use the Screen Reader mode.
Screen Reader: ADF Faces generates components that are optimized for use with screen readers. The Screen Reader mode facilitates the display for visually impaired users, but will degrade the display for sighted users (without visual impairment).
Additional fine grained accessibility levels as described below are also supported:
High-contrast: ADF Faces can generate high-contrast–friendly visual content. High-contrast mode is intended to make ADF Faces applications compatible with operating systems or browsers that have high-contrast features enabled. For example, ADF Faces changes its use of background images and background colors in high-contrast mode to prevent the loss of visual information. Note that the ADF Faces high-contrast mode is more beneficial if used in conjunction with your browser's or operating system's high-contrast mode. Also, some users might find it beneficial to use large-font mode along with high-contrast mode. Faces high-contrast mode is more beneficial if used in conjunction with your browser's or operating system's high-contrast mode. Also, some users might find it beneficial to use large-font mode along with high-contrast mode.
Large-fonts: ADF Faces can generate browser-zoom-friendly content. In default mode, most text and many containers have a fixed font size to provide a consistent and defined look. In large-font mode, text and containers have a scalable font size. This allows ADF Faces both to be compatible with browsers that are set to larger font sizes and to work with browser-zoom capabilities. Note that if you are not using large-font mode or browser-zoom capabilities, you should disable large-font mode. Also, some users might find it beneficial to use high-contrast mode along with the large-font mode.
Applications provide the ability to switch between the above accessibility support levels in the application, so that you can choose the desired type of accessibility support, if required. Applications expose a user preferences window in which you can specify the accessibility preferences/mode which allows you to operate in that mode.
You can configure the session to the accessibility mode by setting user preferences on the home page of the application.
Perform the following procedure to configure a user preference in a screen reader mode:
Log into the Application Portal.
From the application home page, select Preferences from the logged in User menu. 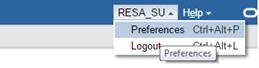
From the Tasks pane, click Accessibility to open the Accessibility tab.
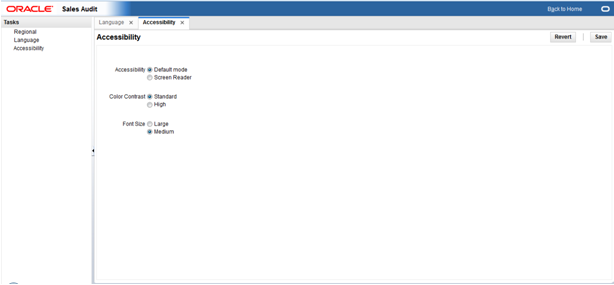
Select Screen Reader to enable accessibility mode and click Save.

Click Back to Home to return to the application home page.
The application is now enabled in the screen reader mode to assist a visibly challenged user. Some of the graphical content of Operational Insights is also displayed in a tabular mode.
To set Accessibility mode to Default mode, take the following steps:
From the application home page, select Preferences from the logged in User menu.
From the Tasks pane, click Accessibility to open the Accessibility tab.
Select Default mode.
Click Save to save the settings.
Click Back to Home to return to the application home page. The application is returned to default mode and you can view the graphical reports.
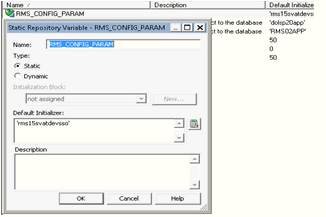
Set up the RMS_CONFIG_PARAM in the RPD for in-context launches into the RMS windows. RMS_CONFIG_PARAM is a repository variable that stores the configuration parameter of the RMS forms application. This variable is then internally used in reports to contextually launch into RMS forms applications from the Allocation dashboard.
To configure the variable:
Configure the Rpd variable for the RMS forms In-context launch. Change the value of Rpd Variable. Open the Rpd, go to Manage -> Variable -> Repository -> Statics, and change the value of Repository variable to RMS_CONFIG_PARAM.
|
Note: If your RMS URL is as follows: http://hostname:port/forms/frmservlet?config= rms15svatdevsso, then the value of the RMS_CONFIG_PARAM variable is rms15svatdevsso. |
Oracle Retail Operational Insights dashboards and reports are across Retail Merchandising Fusion Applications. This section details the application specific configurations required for use of Operational Insights for individual Retail Merchandising Fusion Application. The reports that are displayed in the application specific (Allocation or ReIM) dashboards as well as some data reported in some of the reports is configurable via the following database table.
The ALC_SYSTEM_OPTIONS_OI table drives the configuration parameters for the Allocation Operational Insights dashboards reports and is present in the Allocation application database schema. This following table describes the configuration parameters for OI reports for Allocation:
| System Option | Definition | Column Name |
|---|---|---|
| Allocate By | The retailer may either choose to allocate based on incoming purchase orders or based on ASNs. Based on this value, either the PO Arrival Report or the Shipment Arrival report is the first report displayed on the dashboard.
Values - PO; ASN |
ALLOCATE_BY |
| Need Calculation Type | The PO Arrival/Shipment Arrival report, WH Inventory report and the Allocated to Plan/Forecast have the ability to support using either Forecast or Plan data.Retailers should configure this parameter based on the data that they have available for their items and wish to see in these reports.
Values - P (plan); F (forecast) |
NEED_CALC_TYPE |
| Simple Promo Only | When set to 'Y' the promotion flag is displayed only for simple promotions in the PO Arrival/Shipment Arrival reports.
When set to 'N' the promotion flag is displayed for both simple and complex promotions in the PO Arrival/Shipment Arrival reports. |
SIMP_PROMO_ONLY |
| PO Allocation Time threshold | Number of days before the not after date of the purchase order that the retailer expects a quantity greater than the 'Percentage Allocated PO Threshold' to be allocated. | PO_ALC_TIME_THRESHOLD |
| Percentage Allocated PO Threshold | The percentage of the warehouse order quantity against the given PO that is expected to be allocated within the 'PO Allocation Time Threshold' defined. | ALLOCATED_PO_THRESHOLD |
| ASN Allocation Time threshold | Number of days before the estimated arrival date of the ASN that the retailer expects a quantity greater than the 'Percentage Allocated ASN Threshold' to be allocated. | ASN_ALC_TIME_THRESHOLD |
| Percentage Allocated ASN Threshold | The percentage of the shipped quantity against the given ASN that is expected to be allocated within the 'ASN Allocation Time Threshold' defined. | ALLOCATED_ASN_THRESHOLD |
| Inventory Tolerance to Plan/Forecast | The tolerance percentage by which the inventory (current + inbound) can differ from the forecast/plan before raising an alert. | INV_TOL_TO_FORECAST_PLAN |
The IM_OI_SYS_OPTIONS table drives the configuration parameters for the REIM Operational Insights Dashbaords and reports and is present in the ReIM application database schema. The weightages are stored in a Configuration table in ReIM. The weightages must add to 100%.
| System Option | Definition | Column Name |
|---|---|---|
| Weightage for exact match | Weightage in percentage for invoices to be of exact match. | WEIGHT_EXACT_MATCH |
| Weightage for non discrepancy | Weightage in percentage for invoices to be non descrepant. | WEIGHT_NON_DISREPANCY |
| Weightage for timely shipment | Weightage in percentage for invoices to be timely shipped | WEIGHT_TIMELY_SHIP |

