| Oracle® Retail Warehouse Management System Operations Guide Release 14.1 E58976-01 |
|


 Previous |
 Next |
| Oracle® Retail Warehouse Management System Operations Guide Release 14.1 E58976-01 |
|
Previous |
Next |
The DBA Administration module allows the DBA Administrator to monitor database information such as table locks, tablespace, indices, and errors.
The chapter describes how to display locks on tables, table information, tablespace information, rollback information, index information, sequence information, and the error log.
The following procedures are included in this section:
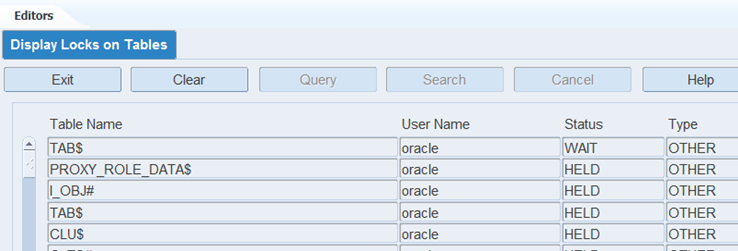
The user can use the Display Locks on Tables to display the status of the tables.
Select the DBA Administration menu.
Select the Display Locks on Tables option. The Display Locks on Tables is displayed.
Click the Exit button to close the window.
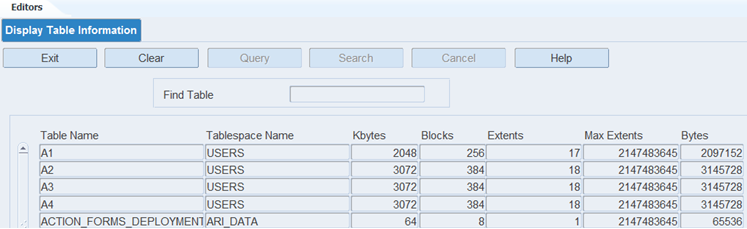
The user can use the Display Table Information option to display specific table information.
|
Note: The user can monitor the number of extents to detect table growth. A large extent value indicates possible table fragmentation. If the number of extents approaches the maximum, the table should be rebuilt. |
Select DBA Administration > Display Table Information.
In the Display Table Information window, click the Query button.
In the Find Table field, enter the name of the table, or click the LOV button and select the table.
Click the Search button. The details of the selected table appear.
The fields on the Display Table Information screen are explained in the Table 3-1:
Table 3-1 Fields on the Table Information Screen
| Field Name | Field Description |
|---|---|
|
Find Table |
Table name for table to be queried. |
|
Table Name |
Name of the database table. |
|
Tablespace Name |
Tablespace name. |
|
Kbytes |
Number of (K) bytes in the table. |
|
Blocks |
Number of blocks the table is using. |
|
Extents Cur. |
Current table extents. |
|
Extents Max |
Maximum allowable table extents. |
|
Note: If the user wants to display information about a particular table, enter the specific table name at the Find Table field. The user can also enter a partial table name. For example, the user can enter APP to display all tables that begin with these letters. |
Click the Exit button to close the Display Table Information screen.
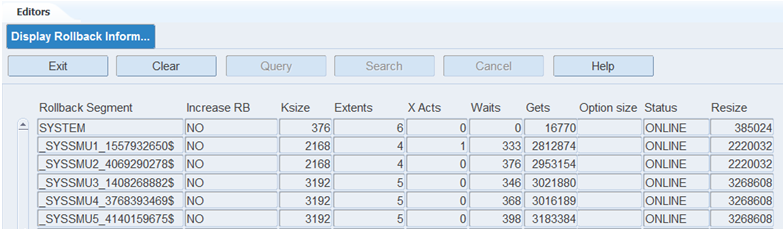
The user can use the Display Rollback Information option to display information about rollbacks. The user can also use this information to determine whether the rollback segments need to be enlarged for a specific installation.
Select the DBA Administration > Display Rollback Information. The Display Rollback Information screen is displayed, along with all rollback segments.
The fields on the Display Rollback Information screen are explained in the Table 3-2:
Table 3-2 Fields on the Display Rollback Information Screen
| Field Name | Field Description |
|---|---|
|
Rollback Segment |
Name of the rollback segment. |
|
Increase RB |
Indicates when additional rollback segments need to be added. YES = rollback segments should be added. NO = rollback segments do not need to be added. |
|
KSize |
Size of rollback segments in bytes. |
|
Extents |
The number of times that the rollback segment had to acquire a new extent |
|
XACTS |
Number of Active Transactions |
|
WAITS |
The number of rollback segment header requests that resulted in waits |
|
GETS |
The number of rollback segment header requests |
|
OPTSIZE |
The value of the optimal parameter for the rollback segment |
|
STATUS |
Status (Online/Offline) |
|
RRSIZE |
Rollback Size |
Click the Exit button to return to the Display Rollback Information screen.
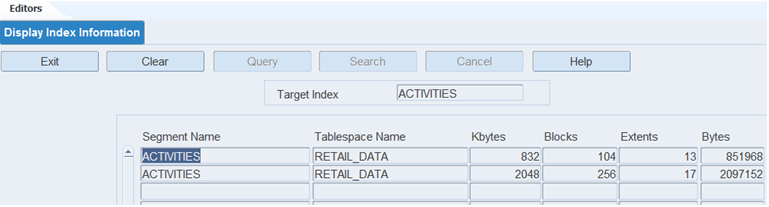
The user can use the Display Index Information option to display sizing information for the database indexes. The user can use this information to analyze the growth of the database indexes, which can indicate table growth.
Select DBA Administration > Display Index Information.
Click the Query button. In the Target Index query field, enter the name of the index or click the LOV button and select the index. Select the The Display Index Information screen is displayed.
Click the Search button. The details of the selected index appear.
The fields on the Display Index Information screen are explained in the Table 3-3:
Table 3-3 Fields on the Display Index Information Screen
| Field Name | Field Description |
|---|---|
|
Target Index |
Index name user wishes to query. |
|
Segment Name |
Name of index. |
|
Tablespace Name |
Tablespace name where the index resides. |
|
Kbytes |
Size of index in kilobytes. |
|
Blocks |
Number of blocks the index is using (1 block = 4096 bytes). |
|
Extents |
Current number of index extents. |
|
Bytes |
Size of index in bytes. |
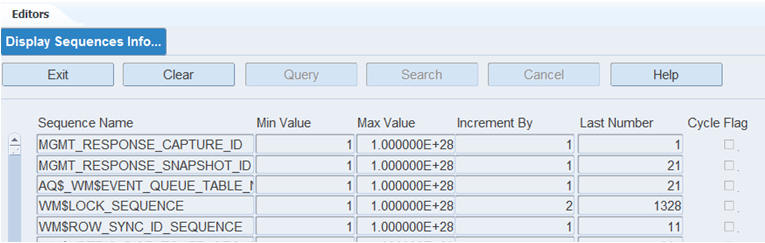
The user can use the Display Sequence Information option to display sizing information specific to the sequences used by the system. The user can use this information to determine whether a sequence is being called as many times as originally planned.
Select DBA Administration > Display Sequences Information. The Display Sequences Information screen is displayed, along with the sequence information already entered into the system.
The fields on the Display Sequences Information screen are explained in the Table 3-4:
Table 3-4 Fields on Display Sequences Information Screen
| Field Name | Field Description |
|---|---|
|
Sequence Name |
Name of the database sequence. |
|
Min Value |
Minimum value of the sequence. |
|
Max Value |
Maximum value of the sequence. |
|
Increment By |
Increment, amount the sequence increases after each use. |
|
Last Number |
Last sequence value used. Some sequences cache the values in memory so this number does not increase until the cache is empty and a new group of numbers is cached into memory. |
|
Cycle Flag |
Cycle, whether the sequence rolls back to minimum value when the maximum value is reached. |
Click the Exit button to close the Display Sequences Information screen.
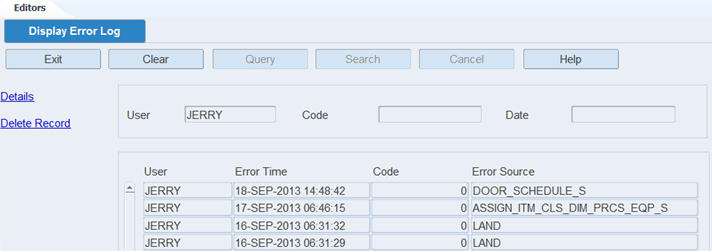
Display Error Log option to display, view details, and delete logged errors. These are unanticipated errors or errors occurring in background processes. You can generate the Error Log report. The report provides the following information for each error: user ID, error time, code, source, location, and message.
Select DBA Administration > Display Error Log.
Click the Query button.
The fields on the Display Error Log screen are explained in the Table 3-5:
Table 3-5 Fields on the Display Error Log Screen
| Field Name | Field Description |
|---|---|
|
User, Code, Date |
Enter any combination of user, error code, or error date to search for records. |
|
User |
User identification. |
|
Error Time |
The date and time the error was logged. |
|
Code |
The error code. |
|
Error Source |
Program where the error originated |
Click the Search button to display a list of all existing errors. To display the errors for a particular user, enter the user name in the User field.
To display a specific error for a particular user, enter the user name in the User field and the error code in the Code field.
To display a specific error for a specific user for a particular date, enter the user name in the User field, the error code in the Code field, and the date in the Date field.
|
Note: RWMS accepts any combination of the above fields. |
Select DBA Administration > Display Error Log.
Enter the user, error code, or date to view and click the Search button.
Select the record to view in more detail, using the keypad arrow keys to move up and down the list, and then click the Details button. The Error Log screen is displayed.
The fields on the Details screen are explained in the Table 3-6:
Table 3-6 Fields on the Error Log screen
| Field Name | Field Description |
|---|---|
|
User |
Identification of the user who had the error. |
|
Time |
Date and time the error was logged. |
|
Code |
The error code. |
|
Source |
The program in which the error originated. |
|
Location |
The location within the source program where the error occurred. |
|
Message |
Full text of the error message. |
Click the Cancel button to close the Details screen.
You can use the batch purge_rwms_tables.sh to remove records from the ERROR_LOG table.
You can also use the batch purge_rwms_tables.sh on PURGE_TABLE_SETUP table to purge just the records you want to use one or multiple columns from the table.
You can also delete the error log records using the GUI. Use the following steps:
Select DBA Administration > Display Error Log.
Click the Query button or the LOV button to enter the options in the user, error code, or date to delete.
Click the Search button. A list of all errors are displayed.
Select the record to delete, using the keypad arrow keys to move up and down the list, and then click the Delete Record link. A message box asks to confirm the deletion. The message reads:
Confirm Delete Operation (Yes/No)
Click Yes to delete the error log record.
The Manual Script Launch Editor allows the user to submit a real-time batch job with its required parameters within the RWMS application. The user can browse through the latest batch job run histories.
Select DBA Administration > Manual Script Launch Editor.
Click the Program Name drop down to select the appropriate batch job.
The fields on the Program Details panel are explained in Table 3-7.
Table 3-7 Fields on the Program Details Panel
| Field Name | Field Description |
|---|---|
|
Program Name |
The name of the batch program that the user has privileges to execute. |
|
Description |
The description of the batch program name. |
|
Number of Arguments |
The number of input parameters required to execute the batch program. |
|
Program Created On |
Date the batch program was made available for execution from this screen. |
Based on the Program Name selected in the Program Details panel, the Program Parameters panel displays the required parameters for the batch program. Parameters such as Facility ID and User ID are defaulted.
Click the Run Now button in order to execute the batch program. The status of the execution of the batch program is displayed on the screen.
The Program Execution History section allows the user to browse through the latest batch executions for the selected batch program. The user can view the jobs sorted by job run dates, job run status, completion time and can drill into further details such as the actual parameters used in the run and log file details. The user can also search for all job requests submitted between a Start Date and End Date. The job status green denotes success and red denotes failure. The View Log hyper link displays logged messages from the actual job run.
The Program Execution Details section displays the input parameters for the job selected in the Program Execution History section.