| Oracle® Retail Merchandise Financial Planning Cost User Guide for the RPAS Fusion Client Release 14.1 E55568-01 |
|

 Previous |
 Next |
| Oracle® Retail Merchandise Financial Planning Cost User Guide for the RPAS Fusion Client Release 14.1 E55568-01 |
|
Previous |
Next |
The bottom up role is usually associated with the merchandise planner in the merchandise planning organization. The bottom up user receives department targets from the middle out user. The bottom up user references those targets when creating the department, class, and subclass targets. After the bottom up user has created these targets, the user submits them to the middle out user for approval.
When bottom up users open MFP in the RPAS Fusion Client, they are presented with the preseason activity called Create Merchandise Financial Plan. The third and fourth tasks in the list, Develop Department Plans and Original Plan Submit, belong solely to bottom up users. The Develop Department Plans has six steps.
After bottom up users develop the department plan, they submit their plan to the middle out user for approval using the Original Plan Submit task. This task has two steps:
Submit Plan for Approval
Review Plan Approval Status
These tasks and steps are shown in Figure 5-1.
|
Note: The bottom up user can see the tasks of the top down and middle out roles, but the bottom up user cannot open or create workbooks within those tasks. This is denoted by the grayed out icons on the right of the taskflow. |
The bottom up user must complete these seven steps on the Develop Department Plans task to create the department plans and submit them for approval to the middle out user. To do this, the bottom up user must first build the workbook.
To build the bottom up role workbook, perform the following steps.
Click the Create New Workbook icon in the Develop Department Plans task.
The workbook wizard opens at the Calendar Selection step. Select the halves you want to plan and move them to the Selected Items box. Click Next.
The Product Selection step of the workbook wizard appears. Select the departments that you want to plan and move them to the Selected Items box. Click Next.
The Location Selection step of the workbook wizard appears. Select the channels you want to plan and move them to the Selected Items box. Click Finish.
The Bottom Up Role workbook is built, and the Initialize view opens.
The first step that bottom up users perform after they build the workbook is to seed the plan with the Initialize Plan view.
The following table lists the measures available on this view.
Table 5-1 Initialize View Measures
| Measure | Description |
|---|---|
|
Seed Source |
The seed source used to seed the working plan. Use this option to seed or not seed the working plan. You can seed with Last Year's (Ly) or Adjusted Last Year's data. Or, you can choose the Do Nothing option if you do not want to seed the working plan. |
|
Last Seed Source |
The last type of seed that was performed in this workbook. One of three options is shown:
|
|
Last Seeded Date |
The last time the working plan was seeded. |
With this view, you can choose to seed your plan with Last Year (Ly) or Adjusted Last Year (Adj Ly) data to create a demand curve on which to spread the new plan's initial targets. Or, you can instead choose to not seed the plan, which allows you to create a plan that is not influenced by last year's performance.
In the example above, both the Half1 FY2009 and Half2 FY2009 halves have been selected to be seeded with Ly data.
When seeding the plan, you can choose which information is seeded. For instance, you can seed just one half or all halves in the workbook. You can also choose what locations and products to seed.
There are two ways you can seed. You can seed each level individually, or you can seed several levels at once by changing the dimension level shown in the view.
As shown in Figure 5-6, only the Brick & Mortar channel and the 100 Men's Footwear department have been selected to be seeded with Ly data. This means that the other Product departments have not been selected to be seeded yet. To seed the next department in the Product dimension within the Brick & Mortar channel, perform the following steps:
Click within the dimension field that you want to change, as shown in Figure 5-7.
Click the Next or Previous arrow, as shown in Figure 5-7.
The page refreshes and the next department in the Product dimension appears in the page edge. Note that the Seed Source measure is no longer populated.
Select the half that you want to seed with Ly or Adj Ly data.
Click the Next arrow to view and seed the next department.
When you have selected all the data you want to seed, click Seed in the top, right corner.
A confirmation message appears, stating that the data has been successfully seeded. Click OK.
After you have seeded, the view refreshes and the Last Seed Source and Last Seed Date measures contain the source and date of the last seed.
If you want to seed several locations and several products at once, you may want to change the level of the dimensions shown in the page edge.
The default setting of the Initialize view is set to show the Calendar dimension at the half level, the Location dimension at the channel level, and the Product dimension at the department level.
To change the dimension level shown in the page edge or grid, perform the following steps:
Click the dimension tile of the dimension level you would like to change.
The dimension window appears. Select the level of the dimension that you want to appear in the page edge. If you want to view more than one level at a time in the page edge or grid, select multiple levels. In Figure 5-11, Channel was deselected and all [Location] was selected instead.
Click OK when finished.
Repeat steps 1 through 3 for other dimensions if desired.
After the dimensions are at the level you want, select the halves that you want to seed.
In Figure 5-12, both the Location and Product dimensions are at All, and the halves Half1 FY2009 and Half2 FY2009 have been selected.
When you have selected all the data you want to seed, click Seed in the top, right corner, as shown in Figure 5-12.
The view refreshes and the Last Seeded Source and Last Seed Date measures measures contain the source and date of the last seed. A confirmation message appears, stating that the data has been successfully seeded. Click OK.
After you have seeded, set the Beginning of Season (BOS) inventory. By entering the BOS inventory that you project for the season, you can set the BOS markup for that inventory, which allows the BOS cost to be calculated.
To set the BOS, perform the following steps:
In the Initialize Plan view, change the measure profile to Seed and Set BOS Inventory.
The view is refreshed and the Seed and Set BOS Inventory measures are visible.
Change the calendar level to year.
Enter data in the BOS Inv C, BOS Inv U, and Wp BOS Inv AUC measures.
Click Calculate.
After the BOS is planned, the cost and AUC is calculated.
After you have seeded and set the BOS, continue to the next step: Review Department Targets.
After you have seeded, you need to review the department targets that the middle out user has created for you. The purpose of reviewing the targets is so that you can understand the goal that your plan should meet.
The Target Overview view contains the middle out target (MO Tgt) measures as well as last year (Ly) measures.
Use this view to compare the MO Tgt measures to the corresponding Ly measures. By understanding how the middle out targets compare to last year's metrics, you can better understand what your plan needs to achieve.
|
Note: All measures in the Target Overview view are read-only. The measures that you edit are in other views. |
The following table lists the measures available on this views.
Table 5-2 Target Overview View Measures
| Measure | Description |
|---|---|
|
MO Tgt Sales R |
The middle out target for sales. |
|
Ly Sales R |
Last year's sales. |
|
MO Tgt Sales var Ly R% |
The middle out target for variance between target sales value and last year's sales value, expressed as a percentage of the last year value. |
|
MO Tgt Gross Profit |
The middle out target for gross profit. |
|
MO Tgt Gross Profit % |
The middle out target for gross profit expressed as a percentage of total sales. |
|
Ly Gross Profit |
Last year's gross profit. |
|
Ly Gross Profit % |
Last year's gross profit expressed as a percentage of total sales. |
|
MO Tgt Gross Profit Var Ly R% |
The middle out target for variance between the target gross profit and last year's gross profit, expressed as a percentage of the last year value. |
|
MO Tgt Sales C |
The middle out target cost. |
|
Ly Sales C |
Last year's cost. |
|
MO Tgt Sales var Ly C % |
The middle out target for variance between the target cost and last year's cost, expressed as a percentage of the last year value. |
|
MO Tgt BOP Inv C |
The planned beginning of period inventory cost. The period can be a week, month, or any other calendar period. |
|
Ly BOP Inv C |
Last year's beginning of period inventory cost. The period can be a week, month, or any other calendar period. |
|
MO Tgt Receipts C |
The middle out target cost for receipts. |
|
Ly Receipts C |
Last year's receipts cost. |
|
MO Tgt Receipts var Ly C% |
The middle out target variance between the target receipt cost and last year's actual receipt cost, expressed as a percentage of last year. |
|
MO Tgt EOP Inv C |
The middle out target for end of period inventory, expressed in cost value. The period can be a week, month, or any other calendar period. |
|
Ly EOP Inv C |
Last year's end of period inventory, expressed in cost value. The period can be a week, month, or any other calendar period. |
|
MO Tgt EOP Inv var Ly C% |
The middle out target variance between the target end of period inventory cost and last year's actuals, expressed as a percentage of last year. |
|
MO Tgt Cum Avg Inv C |
The middle out average cumulative inventory value, expressed in cost value, cumulated from the start of the season. |
|
Ly Cum Avg Inv C |
Last year's average cumulative inventory value, expressed in cost value, cumulated from the start of the season. |
|
MO Tgt Cum Turn C |
The middle out cumulative inventory turns (cost) target. It is cumulated from the start week of the workbook. |
|
Ly Cum Turn C |
Last year's cumulative inventory turns (cost). It is cumulated from the start week of the workbook. |
|
MO Tgt GPROI |
The middle out target for gross profit return on inventory. |
|
LY GPROI C % |
Last year's gross profit return on inventory. |
|
MO Tgt Sell Thru U % |
The middle out target sell through unit value, expressed as a percentage of sales to the total receipts and beginning inventory. |
|
Ly Sell Thru C % |
Last year's sell through cost value, expressed as a percentage of sales to the total receipts and beginning inventory. |
|
MO Tgt Forward Cover C |
The middle out target number of weeks of forward cover for the period. Using the cost values sales of future weeks, this measure indicates how many weeks of sales can be fulfilled with the ending inventory of the period. |
|
Ly Forward Cover C |
Last year's forward cover for the period. |
|
MO Tgt Publish Targets Date |
The date that the middle out target was published. |
|
MO Tgt Publish Info |
Additional information about the middle out targets. This information was entered by the middle out user who published the targets. |
If the middle out user updates the department targets after you have created your class and subclass plans, retrieve those new targets in one of two ways. You can build a new workbook which uses the updated department targets from the domain. Or, if you want to bring the new targets into one of your existing workbooks, you can refresh the workbook.
When refreshing a workbook, you can run a refresh group that has been configured to retrieve data from the master database.
To refresh a workbook, click Refresh in the toolbar. Or, choose the Refresh option from the Edit menu. Since only one rule group exists for this workbook template, there are no options to choose from. The one refresh rule group runs, and measures configured in that rule group are updated.
For more information about the refresh option, see the Oracle Retail Predictive Application Server User Guide for the Fusion Client. For information about creating refresh rule groups, see the Oracle Retail Predictive Application Server Configuration Tools User Guide.
One you have reviewed and compared the middle out targets to the last year metrics, continue to the next step: Develop Sales and Profit Plan.
After you have seeded the groups and reviewed the middle out department targets, you can develop the sales and profit targets for the classes and subclasses within those departments using the Plan Sales/Profit view.
Use the following best practices to plan the sales and profit.
Review and compare the total sales to the forecast.
Enter the planned sales in the Wp Sales R measure.
Enter the gross profit by editing either the Wp Gross Profit or Wp Gross Profit % measure.
Enter the sales cost in the Wp Sales C measure.
The following table lists the measures available on the default measure profile of this view.
Table 5-3 Plan Sales / Profit View Measures
| Measure | Description |
|---|---|
|
Wp Fcst Pre-Season R |
The preseason forecast. |
|
Wp Sales var Fcst Pre-Ssn R% |
The planned preseason sales variance forecast. |
|
Wp Sales R |
The planned sales retail value. |
|
Ly Sales R |
Last year's sales retail value. |
|
Wp Sales var Ly R% |
The planned sales retail variance to last year expressed as a percentage. |
|
Wp Gross Profit |
The planned gross profit value. |
|
Wp Gross Profit % |
The planned gross profit expressed as a percentage of total sales. |
|
Ly Gross Profit |
Last year's gross profit value. |
|
Ly Gross Profit % |
Last year's gross profit value expressed as a percentage of total sales. |
|
Wp Gross Profit var Ly R% |
The planned variance between the target gross profit value and last year's actual gross profit, expressed as a percentage of last year. |
|
Wp Sales C |
The planned sales cost. |
|
Ly Sales C |
Last year's actual sales cost. |
|
Wp Sales var Ly C % |
The planned sales cost variance to last year expressed as a percentage. |
After you have adjusted the sales and profit plan, continue to the next step: Reconcile to Department Targets.
After you have developed the sales and profit plan, develop a receipts and inventory plan that can support the sales and profit plan. The purpose of this step is to ensure that you have a receipt and inventory plan that supports the sales that you are projecting.
Like the Plan Sales and Profit View, the Plan Receipts/Inventory view contains several Ly metrics that you can reference when setting your targets. There are also additional measures for adjusting your inventory targets. Note that the adjustments you made to the Wp Sales R measure in the Plan Sales and Profit view are visible in this view if you have calculated.
Use the following best practices to plan the receipts and inventory.
Ensure that you have set the beginning of season (BOS) inventory in the Getting Started - Seed Plan step. The BOS measures must be set before planning the receipts and inventory. To set the BOS measures, see the Setting Beginning of Season Inventory.
Plan the receipt flow and then evaluate the average inventory and turn.
Adjust the Wp Stock to Sales C measure accordingly. These adjustments affect the receipts for both the current month and prior month. However, the total plan period receipts do not increase or decrease; they only shift from month to month.
The following table lists the measures available on this view.
Table 5-4 Plan Receipts / Inventory View Measures
| Measure | Description |
|---|---|
|
Wp BOS Inv C |
The planned beginning of season inventory cost. |
|
Wp BOS Inv AUC |
The planned beginning of season average unit cost. |
|
Wp BOP Inv C |
The planned beginning of period inventory cost. The period can be a week, month, or any other calendar period. |
|
Ly BOP Inv C |
Last year's beginning of period inventory cost. The period can be a week, month, or any other calendar period. |
|
Wp BOP Inv var Ly C % |
The planned variance between the target beginning of period inventory cost and last year's actuals, expressed as a percentage of last year. |
|
Wp Sales C |
The planned sales cost value. |
|
Ly Sales C |
Last year's sales cost value. |
|
Wp Sales var Ly C % |
The planned sales cost variance to last year expressed as a percentage. |
|
Wp Receipts C |
The planned receipt cost. |
|
Ly Receipts C |
Last year's receipt cost. |
|
Wp Receipts var Ly C % |
The planned variance between the target receipt cost and last year's actual receipt cost, expressed as a percentage of last year. |
|
Wp Devaluation C |
The planned devaluation cost. |
|
Wp Devaluation C % |
The planned devaluation cost expressed as a percentage of total sales. |
|
Ly Devaluation C % |
Last year's devaluation cost expressed as a percentage of total sales. |
|
Wp EOP Inv C |
The planned end of period inventory cost. The period can be a week, month, or any other calendar period. |
|
Ly EOP Inv C |
Last year's end of period inventory cost. The period can be week, month, or any other calendar period. |
|
Wp EOP Inv var Ly C % |
The planned variance between the target end of period inventory cost and last year's actual end of period cost, expressed as a percentage of last year. |
|
Wp Cum Avg Inv C |
The planned average cumulative inventory turns (cost). It is cumulated from the start week of the workbook. |
|
Ly Cum Avg Inv C |
Last year's cumulative average inventory value (cost), corresponding to the start week of the workbook until the current week. |
|
Wp Cum Avg Inv var Ly C % |
The planned variance between the target cumulative average inventory cost and last year's actuals, expressed as a percentage of last year. |
|
Wp Cum Turn C |
The planned cumulative inventory turns (cost). It is cumulated from the start week of the workbook. |
|
Ly Cum Turn C |
Last year's cumulative inventory turns (cost). |
|
Wp Stock to Sales R Ratio |
The planned ratio of the BOP inventory to the sales for the same period. |
|
Ly Stock to Sales R Ratio |
Last year's ratio of the BOP inventory to the sales for the same period. |
|
Wp Forward Cover R |
The planned number of weeks of forward cover for the period. Using the retail values sales of future weeks, this measure indicates how many weeks of sales can be fulfilled with the ending inventory of the period. |
|
Ly Forward Cover R |
Last year's forward cover for the period. |
After you have determined that the value and unit plans you created are achievable, continue to the Reconcile to Department Targets step.
After you have created a plan, compare your plan to the middle out targets to see if you meet the goals that the middle out user has created for you.
This step contains two views: Reconcile Targets and All Measures. All Measures contains all the measures contained in the workbook. For details on the All Measures view, see All Measures.
Use the Reconcile to MO Target measure profile to compare your plans to the MO targets. Note that this view is at the department level of the Product dimension. When using this profile, set the calendar level to month.
If you need to alter your plan shown in this view, return to the step where you created them and edit them there.
After you are satisfied that the plan you have created sufficiently meets the middle out targets, you can submit your plan to the middle out user. For more information about submitting the plan, see Original Plan Submit. Or, you could perform an optional step before submitting it: Review/Reconcile to Item Plan.
The Review/Reconcile to Item Plan step is optional. If your company uses Oracle Retail Item Planning (IP), you can review and reconcile your subclass plan to the approved item plan that was created with that product.
The approved item plan is loaded into MFP from IP through nightly or weekly batch processing. Approved data is exported from IP and loaded into MFP at the subclass level. The aggregation takes place within IP when exporting. Only the plans that have been approved since the last export in IP are imported into MFP.
You can compare your plan to the Original Plan (Op) item plan or to the Current Plan (Cp) item plan. This step provides a view for each of these.
When you are ready to submit your working plan to the middle out user for approval, continue to Original Plan Submit task.
In the taskflow, click the Open icon in the Original Plan Submit task.
|
Note: You can either open a workbook or create a new workbook. If you have committed the workbook used in the previous task, build a new one and see the data you need. If you did not commit that one, you must open it to complete this process. |
The Open Workbook dialog box opens. Select the workbook that you want to submit and click Open Workbook.
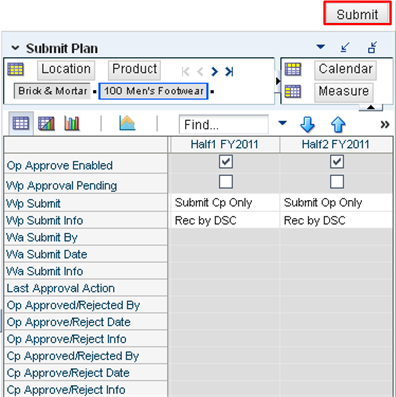
The workbook opens at the Submit Plan view.
When you are ready to submit your working plan to the middle out user for approval, use the Submit Plan view.
|
Note: When the Op Approve Enabled measure is selected, you can submit a plan for the Op version. This measure is set by an administrator in the Enable OP Approval administration workbook. The administrator can select or deselect this option at any time. If the administrator deselects it during the in-season, you will not be able to submit a plan for the Op. The administrator may choose to do this after the planning process has been finalized in order to lock down the Op. If this occurs, you will be unable to submit a plan for the Op and the middle out user will be unable to approve a plan for the Op. |
Select what you want to submit the working plan to using the Wp Submit measure. Options are Submit Op Only, Submit Cp Only, or Submit Op and Cp.
Optional: Enter information about the working plan in the Wp Submit Info measure.
Click the Submit button at the top right of the view, as shown in Figure 5-25.
A success message appears. Click OK to close it.
As a result of the submit custom menu running, the Wp Submit and Wp Submit Info measures are cleared and the Wp Approval Pending check boxes are checked. The Wa Submit By, Wa Submit Date, and Wa Submit Info measures are populated. In addition, your working plan is copied into a Waiting for Approval (Wa) plan.
After the middle out user approves or rejects the Wa plan, you can see the approval or rejection information by accessing the Review Plan Approval Status view in the Original Plan Submit step.
The following table lists the measures available on this view.
Table 5-5 Submit Plan View Measures
| Measure | Description |
|---|---|
|
Op Approve Enabled |
When selected, the bottom up user can submit a plan to the Op. |
|
Wp Approval Pending |
When selected, the approval of the working plan is pending. |
|
Wp Submit |
Used to select what the working plan is submitted to. Options are Submit Op Only, Submit Cp Only, and Submit Op and Cp. |
|
Wp Submit Info |
Used to input information about the submitted plan. |
|
Wa Submit By |
Displays the username of the user who submitted the plan. |
|
Wa Submit Date |
Displays the date that the plan was submitted. |
|
Wa Submit Info |
Displays the information that the user entered about the plan. |
|
Last Approval Action |
Displays the last approval action that occurred. |
|
Op Approved/Rejected By |
Displays the username of the user who approved or rejected the Original Plan. |
|
Op Approve/Reject Date |
Displays the date that the plan was approved or rejected. |
|
Op Approve/Reject Info |
Displays the information that the user entered about why the Original Plan was approved or rejected. |
|
Cp Approved/Rejected By |
Displays the username of the user who approved or rejected the Current Plan. |
|
Cp Approve/Reject Date |
Displays the date that the plan was approved or rejected. |
|
Cp Approve/Reject Info |
Displays the information that the user entered about why the Current Plan was approved or rejected. |
If you want to commit your working plan (Wp) measures to the database, you need to perform a separate commit in addition to submitting your plan for approval. For more information about committing, see the Oracle Retail Predictive Application Server User Guide for the Fusion Client.
To commit your Wp measures, in the workbook that you have published the targets, click Commit in the toolbar. Or, from the File menu, select the Commit option.
After you have submitted your plan to the middle out user, the middle out user approves or rejects your submitted plan. If rejected, adjust your plan using the steps described in this chapter and submit it again. Since you have already created a working plan, there is no need to seed the workbook again unless you want to start again with Ly (Last Year) data.
To learn about how the middle out user approves or rejects your plan, see the Original Plan Approval chapter.
The All Measures view contains all the measures contained in the workbook; however, only the Wp Sales R measure is visible in the default measure profile. The purpose of this workbook is to allow you to create a view of workbook measures that you may not be able to view all at once in other views.
To see the other measures in this view, perform the following steps:
Click the Measure dimension tile. The All Measures - Measure window appears.
Move the measures you want to see in the view from the Hidden Measures box to the Visible Measures box.
When finished, click OK.
For more information about hidden and visible measures, see the Oracle Retail Predictive Application Server User Guide for the Fusion Client.