13 Monitoring Oracle Mediator Service Components and Engines
This chapter describes how to monitor Oracle Mediator (Mediator) service components and engines.
This chapter includes the following topics:
13.1 Monitoring Mediator Service Components
This section describes how to monitor Mediator components. It contains the following topics:
13.1.1 Monitoring Instance Statistics
You can use the Dashboard tab of the Mediator Component Home page to view the instance summary, recent instances list, and instance per minute data.
To view the instance statistics of a Mediator component:
-
Open the Mediator Component Home page.
-
Click Dashboard.
-
View the Recent Instances and Instance Rate Per Min sections.
Note:
To view the Instance Rate Per Min section, you may have to expand the panel by clicking on the plus (+) icon appearing to the left of the section title.
Description of the illustration med_rec_inst.gif

Description of the illustration med_inst_rate.gif
13.1.1.1 About the Instance Information Sections in the Dashboard Tab
This section describes the instance information sections in the Dashboard tab.
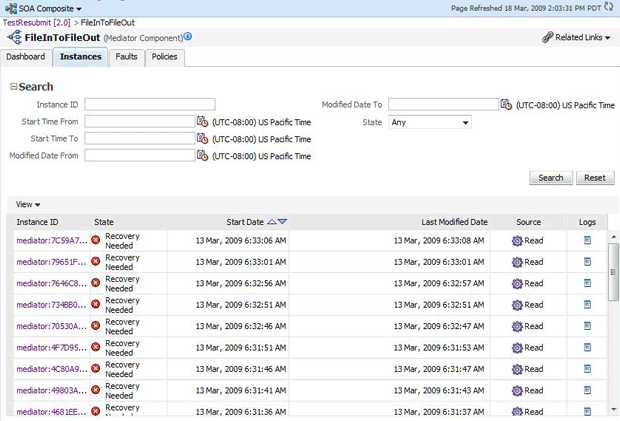
The Recent Instances section provides the following information about the recent Mediator component instances:
-
Instance ID - The unique instance ID of a specific Mediator component instance.
-
State - The state of the specific Mediator component instance. It has the following values:
Stale,Terminated by user,Faulted,Suspended,Completed successfully,Recovery required, andRunning.-
Stale - Composite, for which this Mediator instance was created, is undeployed.
-
Terminated by User - The instance was aborted manually through Enterprise Manager, or automatically by a fault policy.
-
Faulted - Instance is faulted and cannot be recovered.
-
Completed successfully - Everything is fine with this instance and it ran successfully.
-
Recovery required - Instance is faulted and can be recovered through Oracle Enterprise Manager manually.
For more information about recovering a fault, refer to Section 14.2, "Managing Mediator Faults".
-
Running - One or more routing rules of the Mediator component are still running.
-
-
Start Date - The date when the specific Mediator component instance was started.
-
Last Modified Date - The date when the specific Mediator component instance was modified for the last time.
-
Source - The operation or event that triggered the Mediator component.
-
Logs - The location of the Log file that has the log message related to the Mediator component instance.
This section provides information only about recent instances. To view all instances of a component, click Instances or Show All on Dashboard tab to navigate to the Instances tab. To view only those instances that are in running state, select Show Only Running Instances.
The Instances tab of the Mediator Component Home page enables you to search for a Mediator Component instance or view a Mediator Component instance based on the criteria specified.

Description of the illustration med_comphome_inst.gif
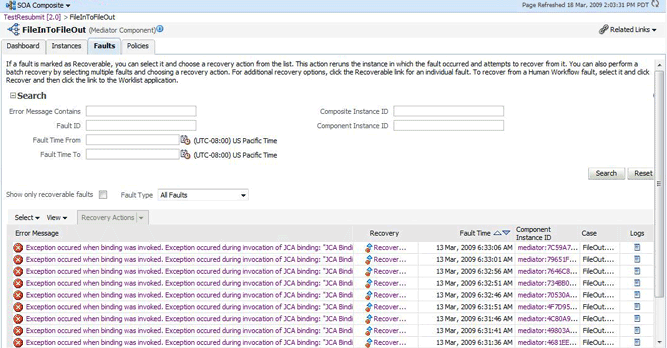
The Recent Faults section provides the following information about the recent faults that occurred while executing the Mediator component:
-
Error Message - The detailed error message associated with the faulted instance.
-
Recovery - Identifies whether the fault is recoverable or not. If a fault is marked as recoverable, you can select it and choose a recovery action from the Recovery Actions list. You can also click Recover for that fault to access more recovery options at the component instance level.
-
Fault Time - The time when the specific fault occurred in the specific Mediator component instance.
-
Component Instance ID - The unique instance ID of a specific Mediator component instance.
-
Case - The routing source case, where the fault occurred.
-
Logs - The log location that has the log message related to the fault. Click this link to find more details about the fault and potential causes of the fault.
This section provides information only about recent faults. To view all faults of a component, click Faults or Show All on Dashboard tab to navigate to the Faults tab. If you want to view only the faults caused by a system error, then click Show only system faults. System faults are related to system failure issues, such as a database or network being inaccessible.
The Faults tab of the Mediator Component Home page enables you to search for faults based on the specified criteria and to recover or abort multiple faults.

Description of the illustration med_comphome_flt1.gif
For more details about the information available on Faults tab, refer to Section 14.2, "Managing Mediator Faults".
Routing Statistics section enables you to view the routing data of a source operation or subscribed event. For more information, refer to Section 13.1.2, "Monitoring Routing Statistics".
The Instance Rate per Min (Realtime Data) section provides information about the execution rate of the Mediator instances per minute. This section displays a graph that shows real-time data for successful, faulted, and incoming instances in the last five minutes.
You can have a tabular view of the instance rate for last five minutes by clicking Table View.
The References section provides information about the references used by the Mediator component and any recent faults:
-
Name - The name of the references associated with the Mediator component.
-
Faults - The number of faults for this reference.
-
Message Count - Total number of times this reference was invoked.
-
Average Response Time - The average Processing time in milliseconds for the reference.
13.1.2 Monitoring Routing Statistics
You can use the Routing Statistics section of the Dashboard tab in the Mediator Component Home page to view the routing data of a source operation or subscribed event.
To view the routing statistics of a Mediator component:
-
Open the Mediator Component Home page.
-
Click Dashboard.
-
In the Routing Statistics section, select a routing source from the Select Route Source list.

Description of the illustration med_rout_stats.gif
-
Expand the Route Target table.

Description of the illustration med_rout_stat2.gif
-
View the routing statistics for all targets in the Route Target table.
The Route Target section under the Routing Statistics section enables you to view statistics of the target routes of the Mediator component. This section provides the following information about a Mediator component instance:
-
Name - The name of the Route Target of the Mediator component.
-
Error - The number of errors that occurred during routing.
-
Average Processing Time - The average processing time for the instances of the specific Mediator component. This field has two subfields, Success and Failure. The Success subfield shows the average processing time for the instances of the specific Mediator component that executed successfully. The Failure subfield shows the average processing time for the instances of the specific Mediator component that failed to execute successfully.
-
Average Invocation Time - The average Invocation Time for the instances of the specific Mediator Component.
13.1.2.1 What You May Need to Know About Monitoring Routing Statistics
The Routing Statistics section provides the following information about the routing source and its various targets:
-
Number of successfully processed messages
-
Average processing time for successful messages
-
Number of faulted messages
-
Average processing time for faulted messages
-
Number of incoming messages
13.2 Monitoring Mediator Service Engine
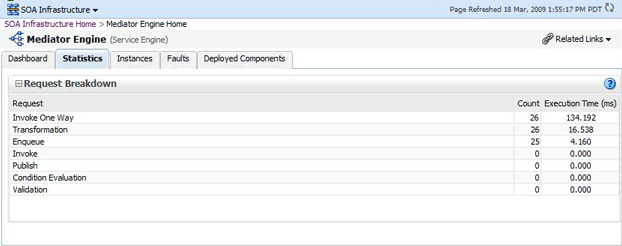
You can assess the efficiency level of the Mediator Service Engine by monitoring the request breakdown statistics.
13.2.1 Monitoring Request Breakdown Statistics
To view the request breakdown statistics of the currently deployed Mediator components:
-
Open the SOA Infrastructure Home page.
-
From the SOA Infrastructure menu, select Service Engines and then Mediator.
The Mediator Service Engine Home page is displayed.
-
Click the Statistics tab.
-
View the Request Breakdown statistics.

Description of the illustration med_srveng_stat.gif
13.2.1.1 What You May Need to Know About Request Breakdown Statistics
The Request Breakdown section provides information about the count and the average time taken for processing the following actions:
-
Invoke One Way - One-way invocations from Mediator Service Engine.
-
Transformation - Transforming messages in Mediator Service Engine.
-
Enqueue - Dehydrating messages for parallel routing rules.
Note:
Dehydrating of messages means storing the incoming messages in database for parallel routing rules, so that they can be processed later by worker threads. -
Invoke - Request-response invocations from Mediator Service Engine.
-
Publish - Publishing events from Mediator Service Engine.
-
Condition Evaluation - Filter conditions evaluation by Mediator.
-
Validation - Message validations by Mediator Service Engine.