3.3 Part 3: Building Reports with Special Formatting
This part of the manual explains how you can build reports with special formats.
3.3.1 Building a wrapped field report
In this example, you will build a break report where the line wraps on word boundaries if it is too long to fit on one line.
Figure 3-12 Final output of the wrapped field report example
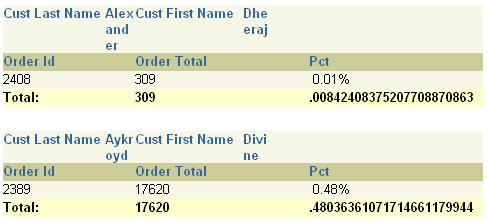
Description of "Figure 3-12 Final output of the wrapped field report example"
For more information on building this example, refer to Chapter 15, "Building a Wrapped Field Report".
3.3.2 Building a header and footer report
In this example, you will build a report that has a page header printed in the upper margin area of every page of the report, and a footer printed at the end of the list of employee information for each department.
Figure 3-13 Final output of the header and footer report example
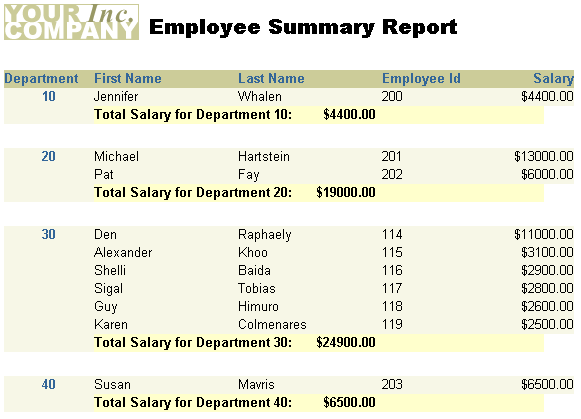
Description of "Figure 3-13 Final output of the header and footer report example"
For more information on building this example, refer to Chapter 16, "Building a Header and Footer Report".
3.3.3 Building a header with database values report
In this example, both the first and last department numbers found on each page are displayed in the page header.
Figure 3-14 Final output of the header with database values report example
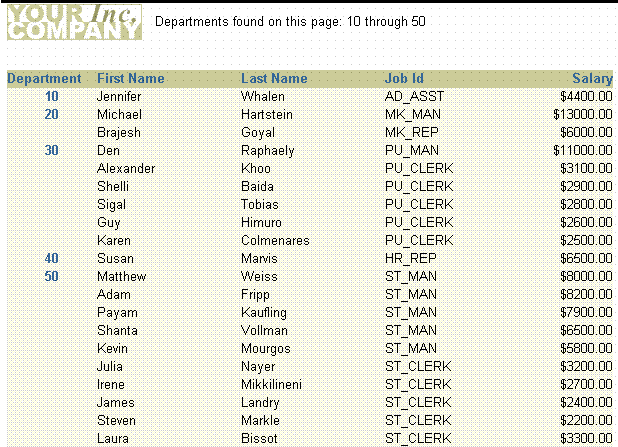
Description of "Figure 3-14 Final output of the header with database values report example"
For more information on building this example, refer to Chapter 17, "Building a Header with Database Values Report".
3.3.4 Building a report with graphics, text, and color
In this example, you will build a report and enhance it by adding an image to the margin, a title, and a border. You will also change the look of the report by applying different fonts and text styles.
Figure 3-15 Final output of the graphics, text, and color example
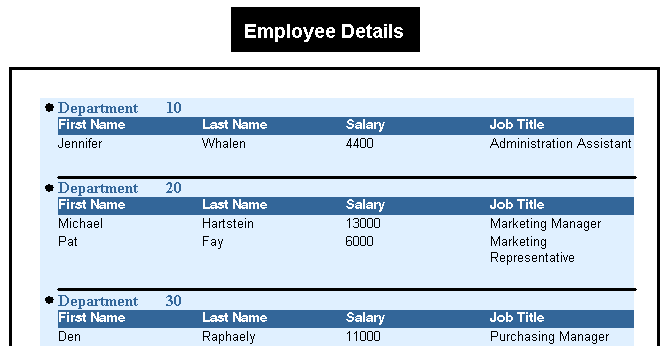
Description of "Figure 3-15 Final output of the graphics, text, and color example"
For more information on building this example, refer to Chapter 18, "Building a Report with Graphics, Text, and Color".
3.3.5 Building a report that renumbers pages by repeating frame
In this example, you will build a report that numbers pages using the format "Page X of Y Pages". The first number (X) corresponds to the current page for each parent record (that is, each sales representative). This page number is reset to "1" for each sales representative, thus tracking the statistics of each representative separately.
Figure 3-16 Final output of the renumbering pages by repeating frame example
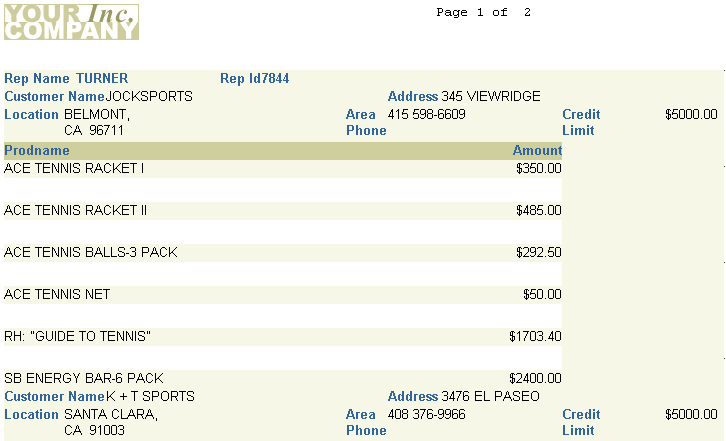
Description of "Figure 3-16 Final output of the renumbering pages by repeating frame example"
For more information on building this example, refer to Chapter 19, "Building a Report that Renumbers Pages by Repeating Frame".
3.3.6 Building an intermixed fields report
In this example, you will build a report where the group field appears between its related fields. Normally, a group (break) field appears to the left of (in group left report) or above (in group above report) its related fields.
Figure 3-17 Final output of the intermixed fields report example
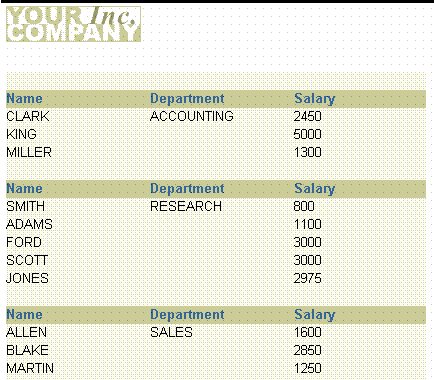
Description of "Figure 3-17 Final output of the intermixed fields report example"
For more information on building this example, refer to Chapter 20, "Building an Intermixed Fields Report".
3.3.7 Building a report that suppresses labels
In this example, you will build a master/detail report that fetches a master record with no associated details. In the sample output below, notice how the field labels for Department 40 do not display because no detail records were found. In this chapter, you will learn how to suppress the detail information for a single record, but allow the other master/detail records to display.
Figure 3-18 Final output for the suppressing labels example
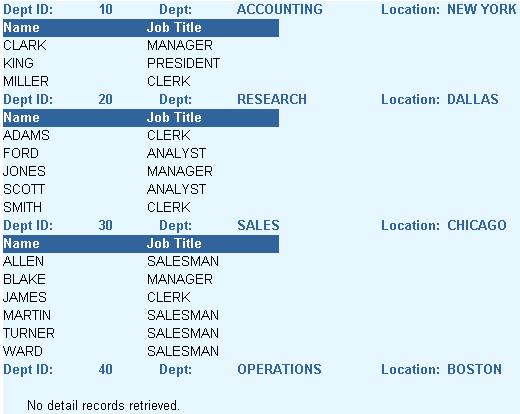
Description of "Figure 3-18 Final output for the suppressing labels example"
For more information on building this example, refer to Chapter 21, "Building a Report that Suppresses Labels".
3.3.8 Building a conditional form letter report
In this example, you will build two form letters from the same report, as shown in the sample output below. As you can see, the two letters share a number of features. Hence, it is more convenient to create a base form letter and then apply conditions to certain parts to determine whether they should be displayed for the current record, in this case, employees.
Figure 3-19 Final output for the first conditional form letter report example

Description of "Figure 3-19 Final output for the first conditional form letter report example"
Figure 3-20 FInal output for the second conditional form letter report example
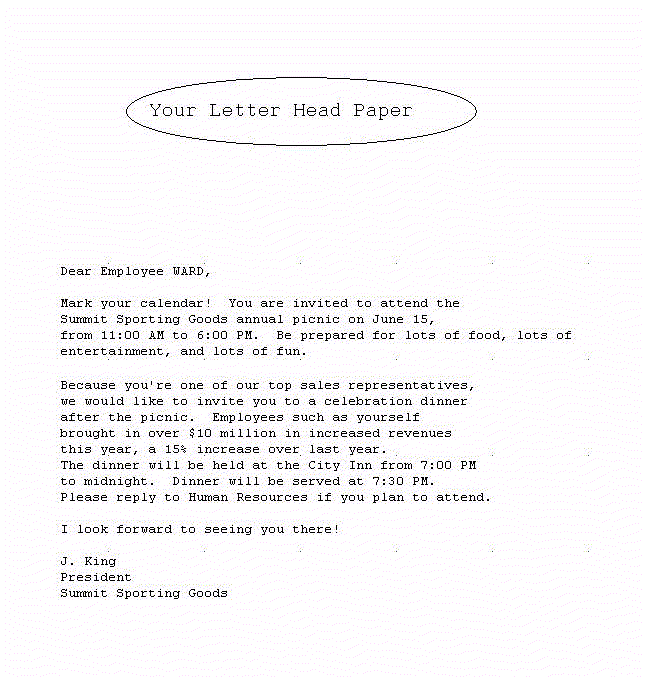
Description of "Figure 3-20 FInal output for the second conditional form letter report example"
For more information on building this example, refer to Chapter 23, "Building a Conditional Form Letter Report".
3.3.9 Building a report with conditional highlighting
In this example, you will learn how to highlight data in your report. In this report that shows employee salaries, salaries that are greater than or equal to 10,000 are displayed in bold and in red color, and values that are between 4,999 and 10,000 are displayed in bold. Using the Conditional Formatting dialog box in Reports Builder, you can create format triggers that will change the appearance of retrieved data depending on factors you define.
Figure 3-21 Final output of the conditional highlighting report example
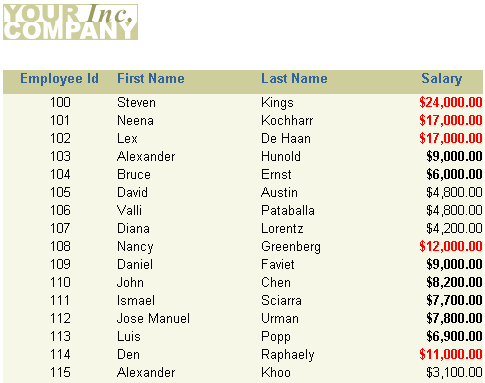
Description of "Figure 3-21 Final output of the conditional highlighting report example"
For more information on building this example, refer to Chapter 22, "Building a Report with Conditional Highlighting".
3.3.10 Building a report with dynamic graphics
In this example, you will build an employee report with a bar graph that displays monthly revenues for the company. Since the data in it changes monthly, you cannot import or draw the graph.
Figure 3-22 Final output of the dynamic graphics report example

Description of "Figure 3-22 Final output of the dynamic graphics report example"
For more information on building this example, refer to Chapter 24, "Building a Report with Dynamic Graphics".