12 Using conditional formatting
This chapter explains how to use Discoverer Plus Relational's conditional formatting to answer typical business questions, and contains the following topics:
12.1 What is conditional formatting?
Conditional formatting is the use of conditional formats and stoplight formats or (or traffic light formats) to highlight worksheet values.
12.1.1 What is a conditional format?
A conditional format enables you to highlight worksheet values that meet a specific condition. For example, you might want to highlight profit values greater than 30,000.
Note: In Discoverer Desktop, conditional formats are known as exceptions.
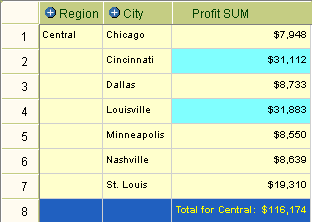
In the example below, a conditional format highlights Profit SUM values greater than 30,000. The Profit SUM figures for Cincinnati and Louisville are displayed with a blue background because they are greater than 30,000.
12.1.2 What is a stoplight format?
A stoplight format (or traffic light format) enables you to categorize numeric worksheet values as unacceptable, acceptable, and desirable using different colors. The default stoplight format uses the familiar red, yellow, and green color scheme to represent unacceptable, acceptable, and desirable values.
For example, you might want to categorize performance based on profit values where:
-
values below 10,000 are unacceptable, and are shown in red
-
values between 10,000 and 30,000 are acceptable, and are shown in yellow
-
values greater than 30,000 are desirable, and are shown in green
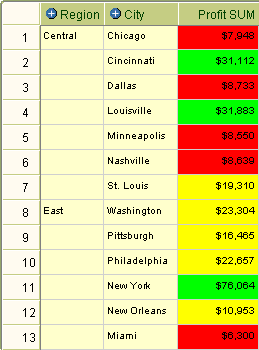
In the example below, a stoplight format based on the above values is used to categorize Profit SUM values. Values in the unacceptable category are show in red (for example, Chicago and Dallas). Values in the acceptable category are shown in yellow (for example, St. Louis and Washington). Values in the desirable category are shown in green (for example, Cincinnati and Louisville).
12.2 About managing conditional formatting
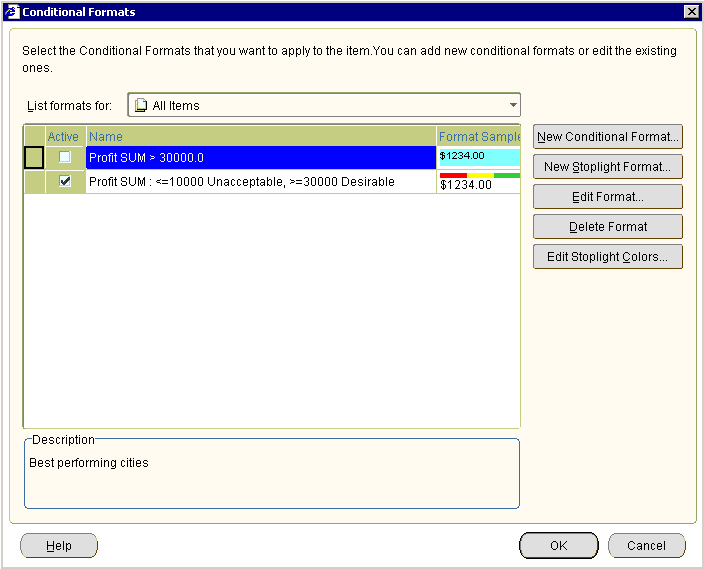
You use the Conditional Formats dialog to manage conditional formats and stoplight formats. The Active column indicates whether formats are active (that is, currently applied to the worksheet).
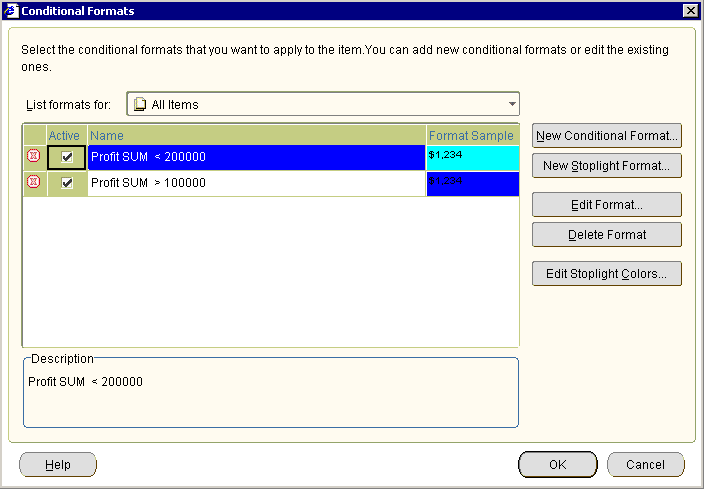
You can create conflicting conditional formats for a worksheet item, providing that they are not active on the same worksheet at the same time. For example, the follow conditional formats overlap:
-
display Profit SUM values greater than 100,000 in dark blue
-
display Profit SUM values less than 200,000 in light blue
In the example below, Discoverer displays a red cross next to conflicting conditional formats. You must deactivate (that is, clear the Active check box next to) one of the conflicting conditional formats to continue. In the example below, you must deactivate either the Profit SUM > 10000 format or the Profit SUM < 200000 format to continue.
You cannot activate a conditional format and a stoplight format on the same worksheet item at the same time. For example, to activate a stoplight format on a worksheet item that has a active conditional format, you must de-activate the existing conditional format for that worksheet item.
12.3 Notes on using conditional formats and stoplight formats
When you use conditional formats and stoplight formats, note the following points:
-
Conditional formats that you create in Discoverer Plus Relational are available in Discoverer Viewer and Discoverer portlets (that is, created using Discoverer Portlet Provider). You can also change the thresholds for stoplight formats in Discoverer Viewer and Discoverer portlets. For example, in Discoverer Plus Relational you might create a stoplight format that displays profit increases of more than 25% as desirable (that is, in green). When an end user accesses this worksheet in Discoverer Viewer, they can change the threshold for the desirable category from 25% to 30%.
-
Conditional formats created in Discoverer Plus Relational are visible in Discoverer Desktop.
-
You can create conditional formats on both numeric and non-numeric worksheet items (for example, text worksheet items). For example, you can create a conditional format for Location = "New York", or Profit SUM > 30,000.
-
You can only create stoplight formats on numeric worksheet items.
-
Stoplight colors are applied to all stoplight formats in a worksheet. If you change the stoplight colors, Discoverer applies the changes to existing and new stoplight formats in the current worksheet (for more information, see "How to change the color of stoplight formats").
12.4 How to activate and deactivate conditional formats and stoplight formats
You activate conditional formats and stoplight formats when you want to highlight worksheet values. For example, you might want to highlight profit values greater than 30,000 using a conditional format.
You deactivate conditional formats and stoplight formats when you no longer want to highlight worksheet values, but you do not want to delete the format being used. Or you might want to resolve a conflict between two conditional formats. For example, to activate a stoplight format on a worksheet item that has a active conditional format, you must de-activate the existing conditional format for that worksheet item.
Note: To remove a conditional format permanently from a worksheet, delete the conditional format (for more information, see "How to delete conditional formats and stoplight formats").
To activate and deactivate conditional formats and stoplight formats:
-
Display the worksheet you want to format.
-
Choose Format | Conditional Formats to display the "Conditional Formats dialog".

The Conditional Formats dialog displays a list of existing conditional formats and stoplight formats that are available in the worksheet. The check box in the Active column next to each format indicates whether the format is activated in the current worksheet.
-
Activate or deactivate the conditional format as follows:
-
To activate a conditional format or stoplight format, select the check box in the Active column next to the format.
-
To deactivate a conditional format or stoplight format, clear the check box in the Active column next to the format.
-
-
Click OK to save the changes that you have made and close the Conditional Formats dialog.
The worksheet is updated with the formatting changes that you have made.
-
You can also activate or deactivate conditional formats in the following way:
-
Right-click on the worksheet data area, select the Conditional Formats option to display the "Conditional Formats dialog", and select or clear the Active check box next to the format.
-
12.5 How to create conditional formats
You create a conditional format when you want to highlight worksheet values that meet a specific condition. For example, you might want to highlight percentage values greater than 75% by displaying them with a blue background.
Note: To categorize worksheet values as unacceptable, acceptable, and desirable using color and text formatting, you create a stoplight format and not a conditional format (for more information, see "How to create stoplight formats").
To create a conditional format:
-
Display the worksheet you want to format.
-
(optional) Select the worksheet item you want to format by clicking on the worksheet column or row.
-
Choose Format | Conditional Formats to display the "Conditional Formats dialog".

-
Click New Conditional Format to display the "New Conditional Format dialog".
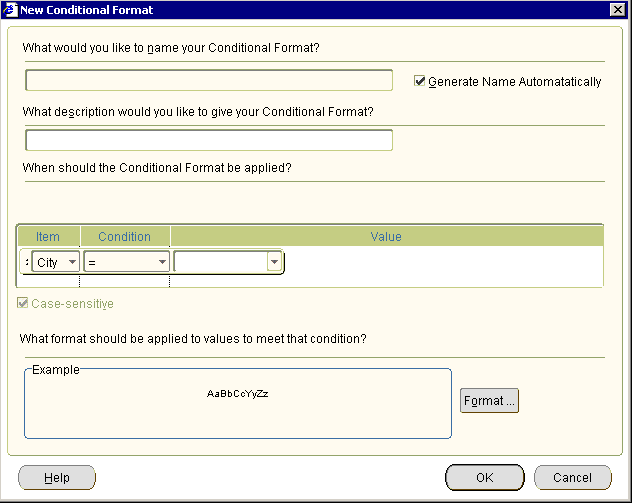
Note: If you first selected a worksheet item in step 2, the worksheet item is selected by default in the Item field.
-
Specify how you want to highlight worksheet values, as follows:
-
(Optional) Use the What would you like to name your Conditional Format? field to create a user-friendly name for the format to be used throughout Discoverer.
-
Use the When should the Conditional Format be applied? fields (that is, Item, Condition, and Value) to create the condition you want to apply.
Hint: Use the Item field to select the worksheet item you want to format. Use the Format field to select the conditional operator (for example, = for equals, > for greater than, < for less than) you want to use. Use the Value field to enter the value you want to match against. For example, choose Profit SUM > 30,000 to highlight Profit SUM values that are greater than 30,000.
-
Click Format to display the "Format Data dialog: Format tab" dialog, which enables you to change the color of and text style for the worksheet value specified in the Item field.
-
-
Click OK to save changes that you have made and close the New Conditional Format dialog.
-
Click OK to close the Conditional Formats dialog.
The worksheet is updated with the formatting changes that you have made.
-
You can also create a conditional format in the following ways:
-
Select the Conditional Format option on the Formatting toolbar to display the "New Conditional Format dialog". For more information about toolbars, see "About the Formatting toolbar".
-
Right-click on the worksheet data area, and select the Conditional Format option to display the "Conditional Formats dialog", and click New Conditional Format.
-
12.6 How to create stoplight formats
You create a stoplight format when you want to categorize numeric worksheet values as unacceptable, acceptable, and desirable using text and color formatting. For example, you might want to display low cost values in green, medium cost values in yellow, and high cost values in red.
To create a stoplight format:
-
Display the worksheet you want to format.
-
(optional) Select the worksheet item you want to format by clicking on the worksheet column or row.
-
Choose Format | Conditional Formats to display the "Conditional Formats dialog".

-
Click New Stoplight Format to display the "New Stoplight Format dialog".
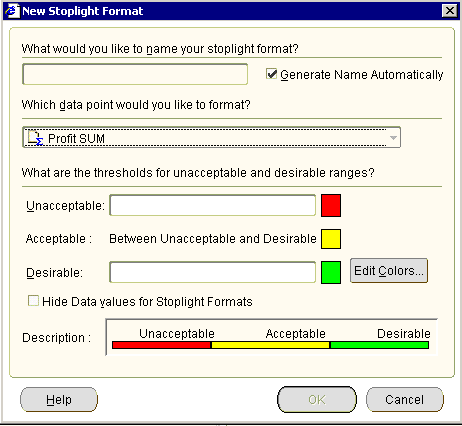
Note: If you first selected a worksheet item in step 2, the worksheet item is selected by default in the Which data point would you like to format? field.
-
Specify how you want to categorize worksheet values, as follows:
-
(Optional) Use the What would you like to name your stoplight format? field to create a user-friendly name for the format to be used throughout Discoverer.
-
If you did not select a worksheet item in step 2, use the Which data point would you like to format? field to select the worksheet item you want to format.
-
Use the Unacceptable? field to specify the value for the lower threshold. For example, enter 100000 to highlight values less than 100,000 as unacceptable.
-
Use the Desirable? field to specify the value for the higher threshold. For example, enter 500000 to highlight values greater than 500,000 as desirable.
-
To change the default stoplight colors (that is, red, yellow, and green), click Edit Colors to display the "Stoplight colors dialog" dialog, which enables you to edit the stoplight colors.
-
-
Click OK to save changes that you have made and close the New Stoplight Format dialog.
-
Click OK to close the Conditional Formats dialog.
The worksheet is updated with the formatting changes that you have made.
-
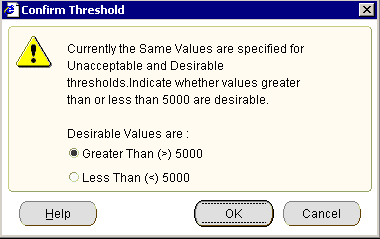
If you enter the an invalid value in either the Unacceptable and the Desirable fields, the "Confirm Threshold dialog" is displayed, which prompts you to specify a threshold correctly. For example, if you enter the same value in both the Unacceptable field and the Desirable field, Discoverer prompts you to specify the thresholds correctly as follows:
-
You can also create a stoplight format in the following ways:
-
Select the Stoplight Format option on the Formatting toolbar to display the "New Stoplight Format dialog". For more information about toolbars, see "About the Formatting toolbar".
-
Right-click on the worksheet data area, and select the Conditional Format option to display the "Conditional Formats dialog", and click New Stoplight Format.
-
12.7 How to edit conditional formats and stoplight formats
You edit an existing conditional format or stoplight format to change how Discoverer highlights worksheet values. For example, you might want to change a stoplight color to improve a printed report.
To edit a conditional format or stoplight format:
-
Open the workbook that contains the worksheet you want to edit.
-
Choose Format | Conditional Formats to display the "Conditional Formats dialog".

-
Select a conditional format or stoplight format in the conditional format list.
-
Click Edit Format to display either the Edit Conditional Format dialog or the Edit Stoplight Format dialog (depending on the type of conditional format you selected).
-
Make changes to the format as required.
-
Click OK to save the changes that you have made.
-
Click OK to close the Conditional Formats dialog.
The worksheet is updated with the formatting changes that you have made.
-
You can also edit a conditional format in the following way:
-
Right-click on the worksheet data area, and select the Conditional Format option to display the "Conditional Formats dialog", and click New Stoplight Format.
-
12.8 How to delete conditional formats and stoplight formats
You delete a conditional format or stoplight format to remove it permanently from a worksheet. For example, you might want to remove conditional formats that you no longer need.
Hint: If you think you might need a conditional format or stoplight format later, consider deactivating it (for more information, see "How to activate and deactivate conditional formats and stoplight formats").
To delete a conditional format:
-
Open the workbook that contains the worksheet you want to format.
-
Choose Format | Conditional Formats to display the "Conditional Formats dialog".

-
Select a conditional format or stoplight format in the conditional format list.
-
Click Delete Format to remove the format from the worksheet.
-
Click OK to close the Conditional Formats dialog.
The worksheet is updated with the formatting changes that you have made.
-
You can also delete a conditional format in the following ways:
-
Right-click on the worksheet data area, and select the Conditional Format option to display the "Conditional Formats dialog", select a format in the list and click Delete Format.
-
If the Selected Items pane is displayed, either select the item and select the Delete option on the Selected Items pane toolbar, or right-click over the item and select the Delete option from the right-click menu.
-
12.9 How to change the color of stoplight formats
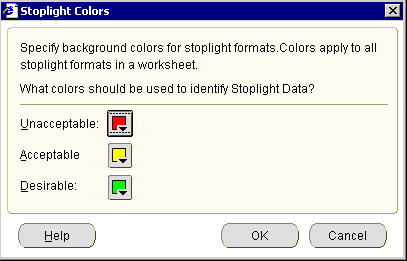
You change the color of stoplight formats to change the default colors that categorize worksheet values as unacceptable, acceptable, and desirable. For example, you might want to change the color for the acceptable category from the default color (that is, yellow) to blue. Discoverer applies colors that you specify to all existing and new stoplight formats in the current worksheet.
Note: To change the default stoplight colors for all stoplights in Discoverer Plus Relational, choose Tools | Options | Formats and select the Stoplight Color Format option.
To change the color of stoplight colors:
-
Open the workbook that contains the worksheet you want to format.
-
Choose Format | Conditional Formats to display the "Conditional Formats dialog".
-
Click Edit Stoplight Colors to display the "Stoplight colors dialog".
-
Change the color of the categories as required.
-
Click OK to save changes that you have made.
-
Click OK to close the Conditional Formats dialog.
The worksheet is updated with the formatting changes that you have made.
-
You can also edit stoplight colors in the following way:
-
Right-click on the worksheet data area, and select the Conditional Format option to display the "Conditional Formats dialog", and click Edit Stoplight Colors.
-
12.10 Examples of conditional formatting
This section includes examples of conditional formats and stoplight formats in Discoverer.
12.10.1 Example 1: Conditional format to highlight Profit SUM values greater than 30000
In this example, you want to analyze performance by highlighting Profit SUM values greater than 30,000 with a blue background.
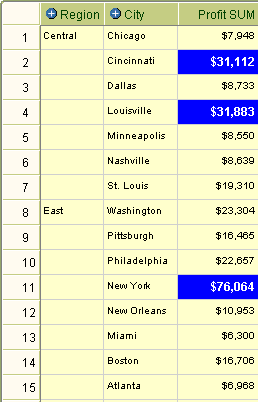
You create a conditional format on the Profit SUM worksheet item. In the worksheet example below, the Profit SUM values for Cincinnati, Louisville, and New York are highlighted with a blue background because they are greater than 30,000.
12.10.2 Example 2: Stoplight format to categorize Profit SUM values on a table worksheet
In this example, you want to analyze performance by categorizing profit values on a table worksheet, as follows:
-
display profit values less than 10,000 in the unacceptable category (with a red background)
-
display profit values between 10,000 and 30,000 in the acceptable category (with a yellow background)
-
display profit values greater than 30,000 in the desirable category (with a green background)
You create a stoplight format on the Profit SUM worksheet item. In the worksheet example below, a stoplight format based on these categories is applied to Profit SUM values in a table worksheet. Values in the unacceptable category are show in red (for example, Chicago and Dallas). Values in the acceptable category are shown in yellow (for example, St. Louis and Washington). Values in the desirable category are shown in green (for example, Cincinnati and Louisville).
12.10.3 Example 3: Stoplight format to categorize hidden Profit SUM values on a crosstab worksheet
In this example, you want to analyze performance by categorizing regions based on profit values that are hidden on a crosstab worksheet, as follows:
-
display profit values less than 60,000 in the unacceptable category (with a red background)
-
display profit values between 60,000 and 100,000 in the acceptable category (with a yellow background)
-
display profit values greater than 100,000 in the desirable category (with a green background)
You want to display stoplight colors but not the worksheet values. Therefore, you select the Hide data values for stoplight formats check box on the New/Edit Stoplight format dialog.
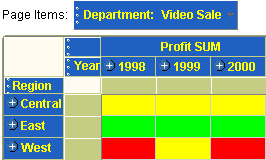
You create a stoplight format on the Profit SUM worksheet item. In the worksheet example below, a stoplight format based on these categories is applied to Profit SUM values in a crosstab worksheet. Values in the unacceptable category are show in red (for example, West in 1998 and West in 2000). Values in the acceptable category are shown in yellow (for example, Central in 1998, 1999, and 2000, and West in 1999). Values in the desirable category are shown in green (for example, East in 1998, 1999, and 200).
