Chapter 2:
A Tour of the Main Window


BEA TUXEDO now provides a convenient graphical user interface (GUI), on the World Wide Web, for administering any BEA TUXEDO application. To perform your administrative tasks, invoke a browser, download the GUI from the Web, and choose the appropriate activity from a friendly series of icons and prompts.

This chapter describes the structure of the GUI's main window. It defines the components of the main window, explains the functions of each, and shows you which of those components are visible in the window when you first invoke the GUI and then proceed to build domains through it. With a thorough understanding of the various menus and buttons provided in the main window, you will be able to administer your BEA TUXEDO application more easily than ever!

Structure of the Main Window

The main window of the Web GUI is divided into a few functional areas supported by various menus and screen buttons. This section describes the GUI's structure.

The Menu Bar, Power Bar, Tree, and Configuration Tool

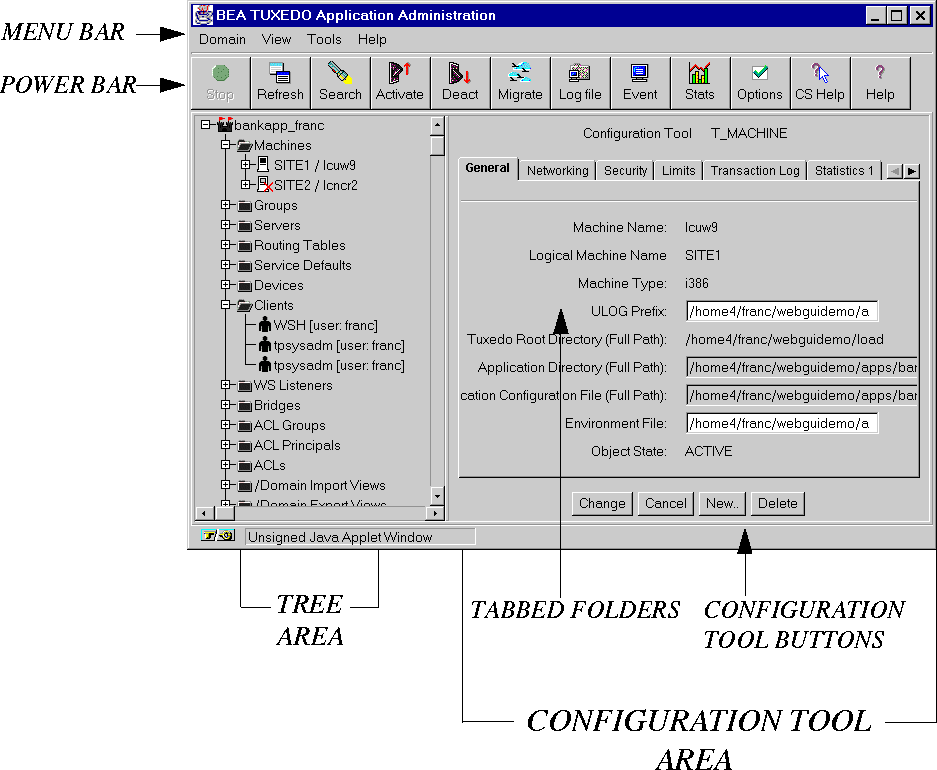
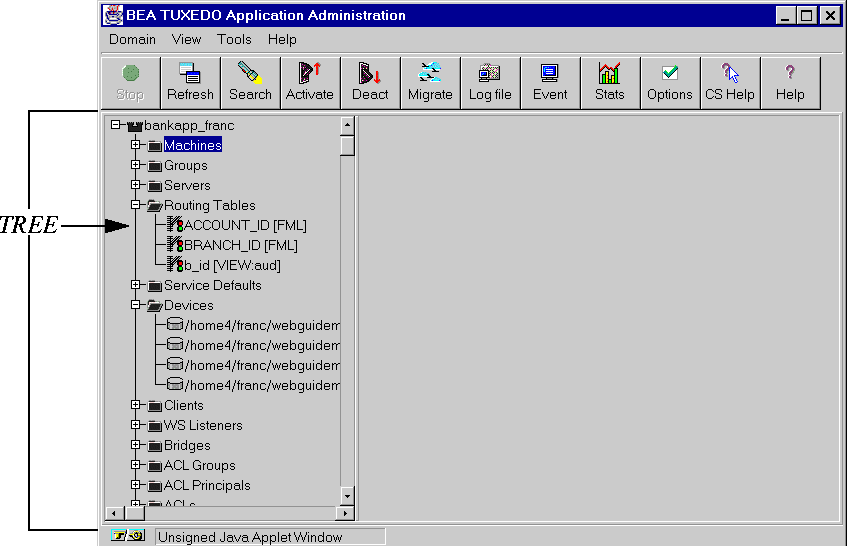
When you first bring up the Web and invoke the GUI for BEA TUXEDO application administration, the main window is displayed on your screen. It is divided into four major sections, as shown in Figure 2-1.
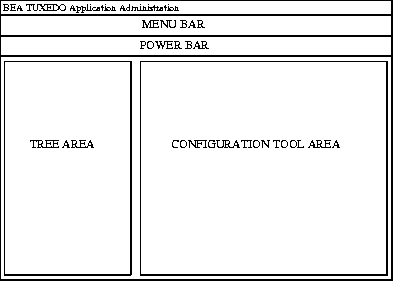
Figure 2-1: Main Sections of the Main Window

The four major sections of the main window are:
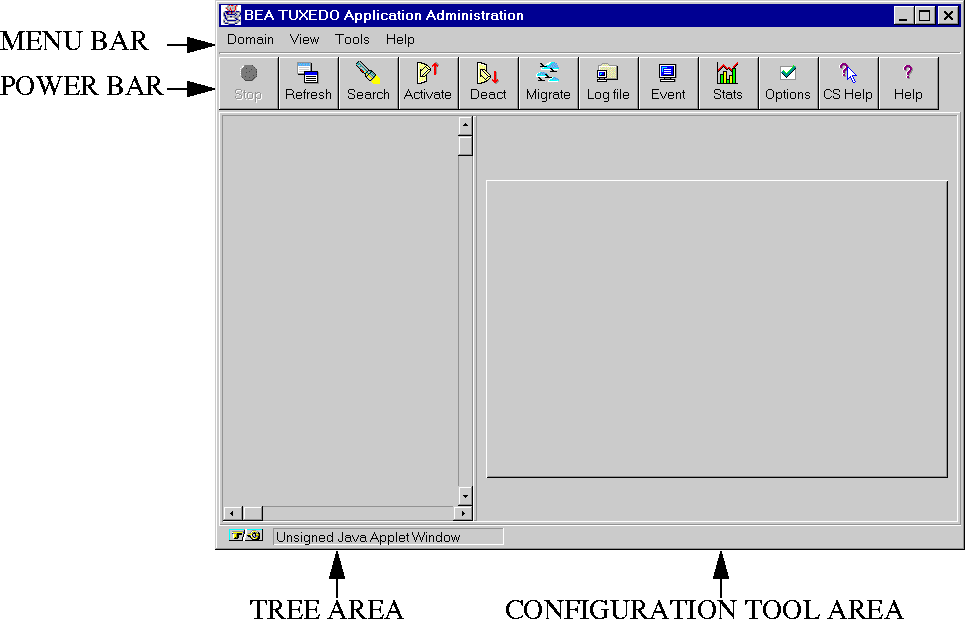
The Tree and Configuration Tool in an Active Domain

After you have set up and activated a domain, the Tree will be populated with labeled icons, representing the administrative class objects in your domain. In addition, as soon as you start using the Configuration Tool, the right-hand column dedicated to that tool will be populated with tabbed folders in which you enter information needed for configuration. Figure 2-3 shows how the main window will look in such circumstances.

Figure 2-3: Appearance of the Main Window during Configuration Session for a Domain

When the Configuration Tool area is populated, another row of buttons is displayed in the main window, just below the tabbed folders. These four buttons allow you to control modifications to the configuration work done in the folders.

Re-sizing the Tree and Configuration Tool Areas

Once you have activated your domain, you may want more display space for the Tree or the Configuration Tool. You can adjust the width of either area by doing the following:

  1. Put the cursor on the gray line that separates the two columns (immediately to the right of the scrollbar in the Tree column).

  2. Hold down the left mouse button until the cursor is replaced by a double-headed arrow.

  3. Drag the double-arrow cursor to the right (to widen the Tree column) or to the left (to widen the Configuration Tool column).

The Quick Menu

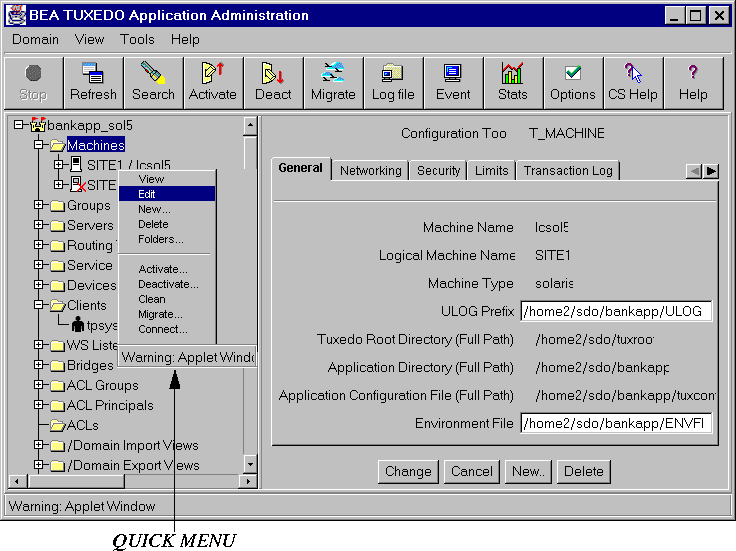
Finally, there is one more menu that is sometimes displayed in the main window: the Quick Menu. This is a menu of frequently performed tasks, such as adding an object to a domain.

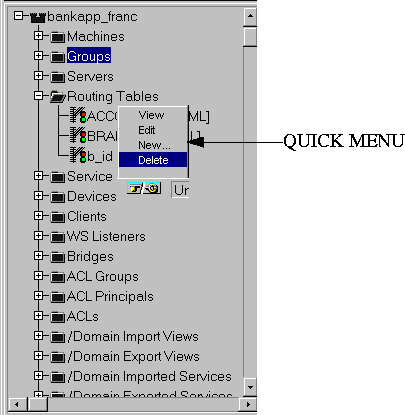
To display this menu, select an object (or class of objects) in the Tree and click on the right mouse button. Figure 2-4 shows where (in the Main Window) the Quick Menu appears when you open it.

Figure 2-4: Quick Menu in the Main GUI Window

Summary

We have now introduced all the components of the main GUI window:

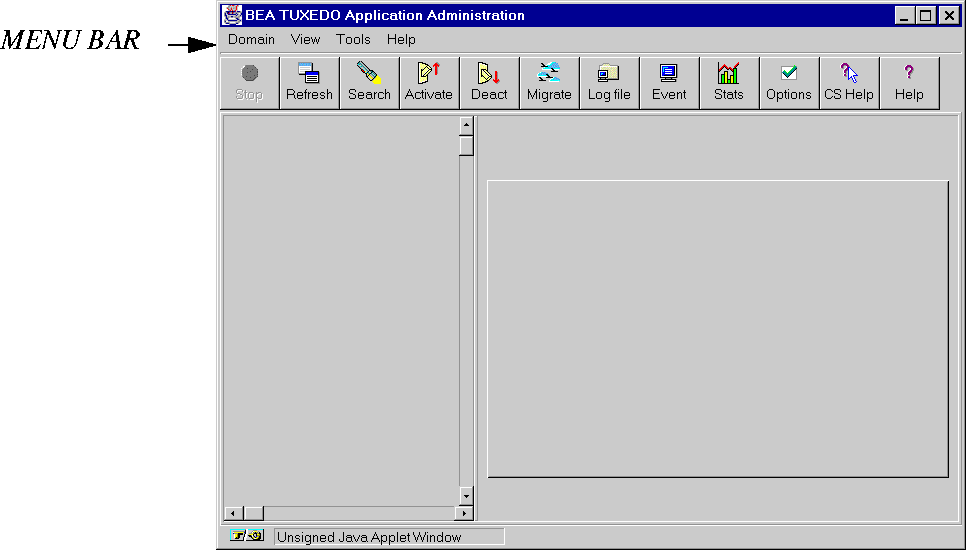
The Menu Bar

The Menu Bar appears in the upper left-hand corner of the main GUI window.

Figure 2-5: The Menu Bar in the Main GUI Window

It consists of four menus:

The Domain Menu

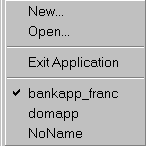
This menu lets you specify the application (or "domain") on which you are going to work. To specify a domain:

  1. Click on "Domain" in the Menu Bar. A pop-up menu will be displayed:

    Figure 2-6: Sample Domain Menu

  2. Select the appropriate menu item and enter any required information.

    This Item . . . Lets you . . .
    New Create a new domain. Use this option if the domain you want is not listed on the menu. After clicking on "New," enter the pathname of the tuxconfig file for your domain. The GUI will then invoke the specified domain and add its name to the menu for future reference.
    Open . . . Display an existing domain that is not listed on the menu
    Exit Application Close the Tree for the application currently being displayed
    bankapp_franc Select the domain called "bankapp_franc."
    domapp Select the domain called "domapp."
    NoName Select the domain to which no name has yet been assigned.

    Unless we specify otherwise, you should assume that all instructions in this book to "click" refer to the left mouse button.

The View Menu

The "View" menu enables you to specify three important parameters of your working environment:

The Tools Menu

The "Tools" menu provides an alternative way of accessing the utilities offered by the Power Bar:

The Help Menu

The "Help" menu provides an alternative way of accessing the two help utilities offered by the Power Bar:

The Power Bar

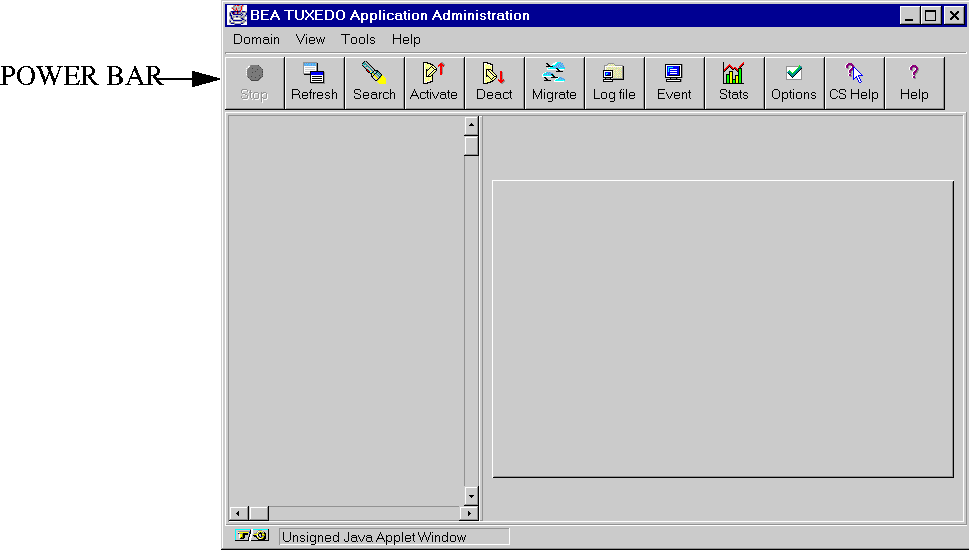
The Power Bar appears across the top of the main GUI window, immediately below the Menu Bar.

Figure 2-7: The Power Bar in the Main GUI Window

The Power Bar is a row of 12 buttons that allow you to invoke tools for frequently performed administrative operations. They are labeled with both icons and names, as shown in Figure 2-8.

Figure 2-8: The Power Bar Buttons

The names and functions of the Power Bar buttons are listed in the following table.

Press . . . To . . .
Stop

Interrupt the current operation and return control to the administrator (who can then request a new operation).

Refresh

Re-draw the current window to clarify text and graphics.

Search

Look for a particular object class or object in the Tree.

Activate

Activate the entire BEA TUXEDO configuration or a selected part of it.

Deactivate

Deactivate the entire BEA TUXEDO configuration or a selected part of it.

Migrate

Migrate a server group or machine to an alternative location, or swap the Master and Backup machines.

Logfile

Display the ULOG file from a particular machine in the active domain.

Event Tool

Monitor system events.

Stats

View a graphical representation of BEA TUXEDO System activity.

Options

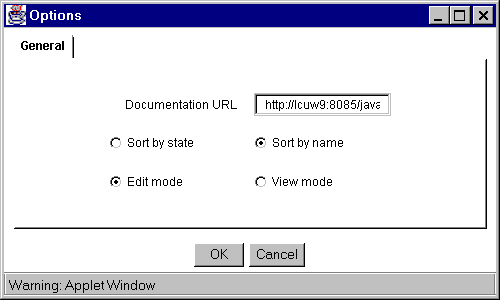
Assign parameters for your administrative GUI session: (a) specify the location of online documentation; (b) have objects sorted by name or class; and (c)
specify view-only or edit mode as your default working mode.

CS Help

Get context-sensitive help. Click on a designated area in a GUI window and a help window will open, displaying text about the selected topic.

Help

Open the BEA TUXEDO Administrator's Guide to the Web-based GUI on the screen.

The following sections describe each Power Bar button in detail.

Stop Button

The "Stop" button allows you to interrupt the process currently underway, thus regaining control of the GUI. You can then start a new process.

You may not assume that a process you interrupt with the Stop button has been completed; it may or may not be completed before control of the GUI is returned to you.

Refresh Button

The "Refresh" button allows you to have the contents of the current window "re-drawn" on your screen.

Search Button

The "Search" button allows you to find a particular administrative object class or object in the expanded portion of the Tree. To launch a search, click on the button; a pop-up window will be opened; enter the name of the object for which you are searching. If necessary, the Tree will scroll to display your target object.

Activate Button

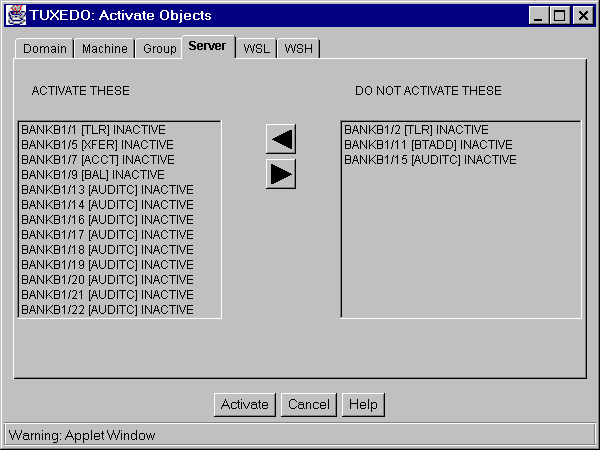
The "Activate" button allows you to activate all or part of a BEA TUXEDO application. To activate your application:

  1. Select "Activate." A new window opens, displaying a set of class-specific folders.

  2. Select the appropriate folder by clicking on its tab.

  3. The "Domain" folder provides one option: "Only Activate Administrative Servers."

  4. Every other folder has two columns labeled "ACTIVATE THESE" and "DO NOT ACTIVATE THESE."

    Figure 2-9: Sample Activate Window

  5. Check the objects listed in each column and move any objects for which you disagree with the listing to the other column. To move an object from one column to another, highlight its name and click on the appropriate arrow button between the two columns.

  6. To implement your changes, click on the "Activate" button at the bottom of the window.

Deactivate Button

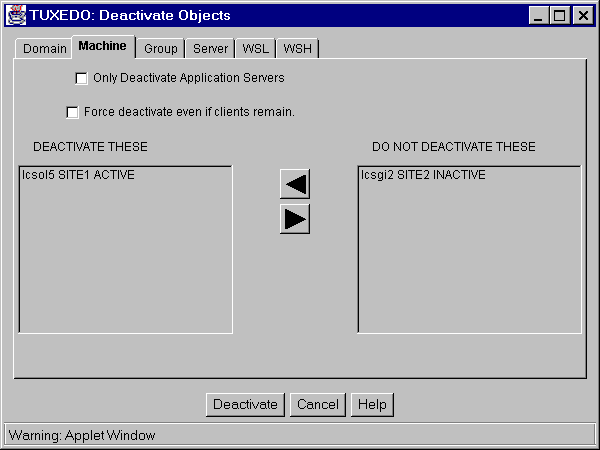
The "Deactivate" button allows you to deactivate all or part of a BEA TUXEDO application. To deactivate your application:

  1. Select "Deactivate." A new window opens, displaying a set of class-specific folders.

  2. Select the appropriate folder by clicking on its tab.

  3. The "Domain" folder offers the following two prompts; click in the choice box in front of the desired prompt.

  4. Every other folder has two columns labeled "DEACTIVATE THESE" and "DO NOT DEACTIVATE THESE."

    Figure 2-10: Sample Deactivate Window

  5. Check the objects listed in each column and move any objects for which you disagree with the listing to the other column. To move an object from one column to another, highlight its name and click on the appropriate arrow button between the two columns.

  6. To implement your changes, click on the "Deactivate" button at the bottom of the window.

Migrate Button

The "Migrate" button allows you to move groups of servers and groups of services from one machine to an alternate. By doing so you can schedule downtime maintenance for the original machine. A server group is the smallest unit that can be migrated to an alternate location.

To migrate a server group from one machine to another, complete the following steps:

  1. Click on the Migrate icon in the Power Bar. The "Migrate Objects" screen is displayed.

  2. Select the name of the server group you want to move, using the drop-down menu in the "Migrate Group" field.

  3. Enter the name of the machine on which that server group is currently located (source) in the "From Machine" field.

  4. Enter the name of the machine to which you want to migrate the server group (destination) in the "To Machine" field.

  5. Click on the "Migrate" button. The "Progress of Migrate" screen is displayed. For more information about this screen, see the section called "Introducing the Progress of Migrate Screen" in Chapter 5.

    For more information, see "Migrating Server Groups and Machines" in Chapter 5.

  6. Your next steps depend entirely on the applications you are running. You may need to drain queues, shut down groups, migrate databases using tools provided by the database vendor, and so on, to ensure an orderly migration.

Logfile Button

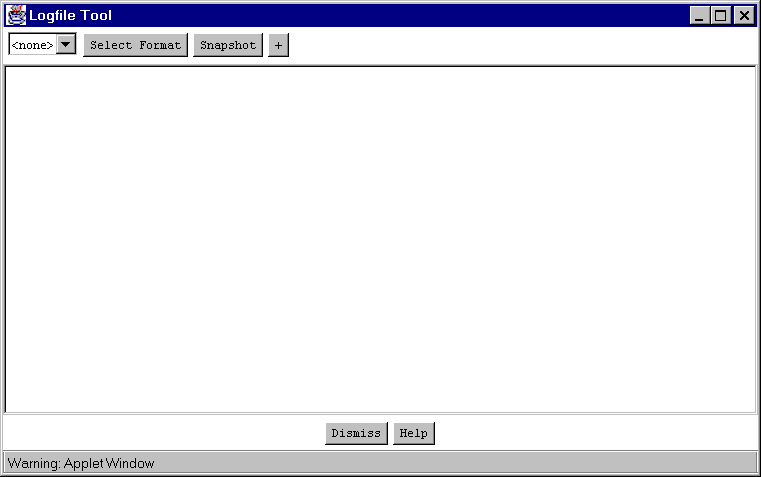
The "Logfile" button displays the ULOG file from a particular machine in the active domain. When the Logfile Tool is first invoked, a window for it opens on your screen, as shown in Figure 2-11.

Figure 2-11: Initial Logfile Tool Window

Four buttons are displayed in the upper left-hand corner:

How to View a ULOG File

  1. In the main GUI window, click on the Logfile button in the Power Bar; a new window (labeled "Logfile Tool") opens on your screen, as shown in Figure 2-11.

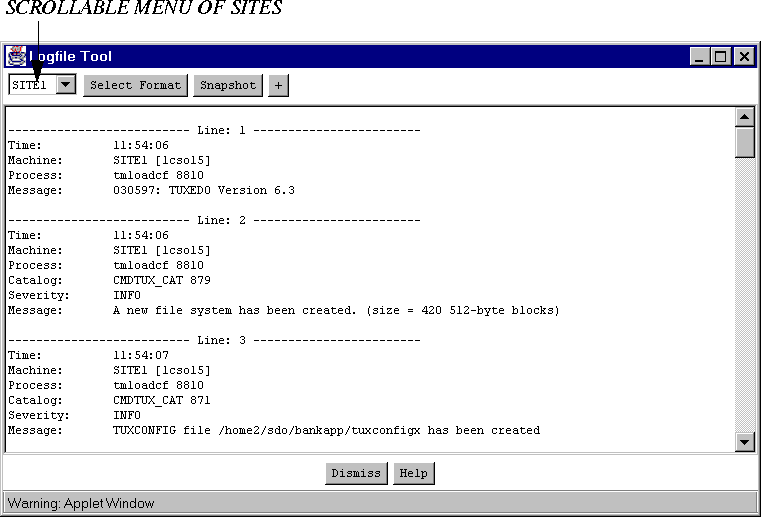
  2. Select the machine for which you want to see the ULOG file by bringing the appropriate machine name into the scrollable menu in the top left-hand corner of the main Logfile window. The appropriate logfile will scroll down the main display area of the Logfile window, as shown in Figure 2-12.

    Figure 2-12: Sample ULOG File in Logfile Tool Window

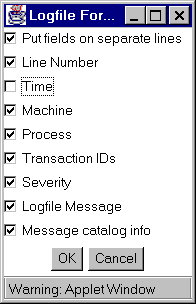
  3. If you want to modify the contents or format of the display, click on the "Select Format" button. The following window will be displayed:

    Figure 2-13: The "Select Format" Menu for the Logfile Tool

    Select the information and format you want to view by clicking on the appropriate items.

Taking a Snapshot of the ULOG File

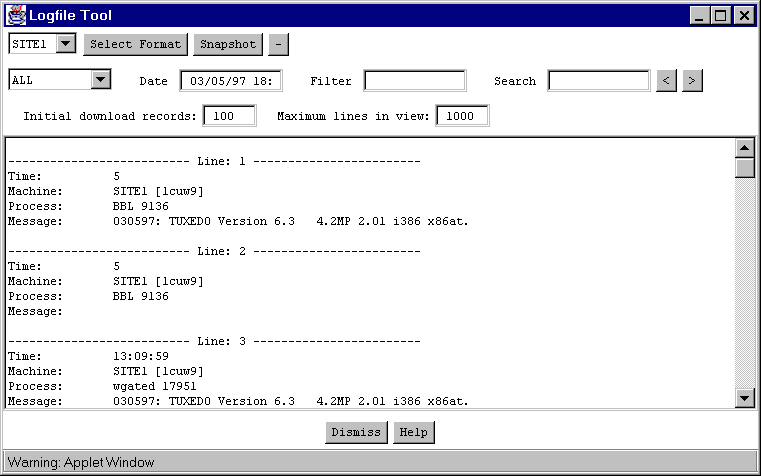
If you want a record of the ULOG file being displayed, click on the "Snapshot" button at the top of the "Logfile Tool" window.

Figure 2-14: Sample Snapshot of a ULOG File

Customizing Your Use of the Logfile Tool

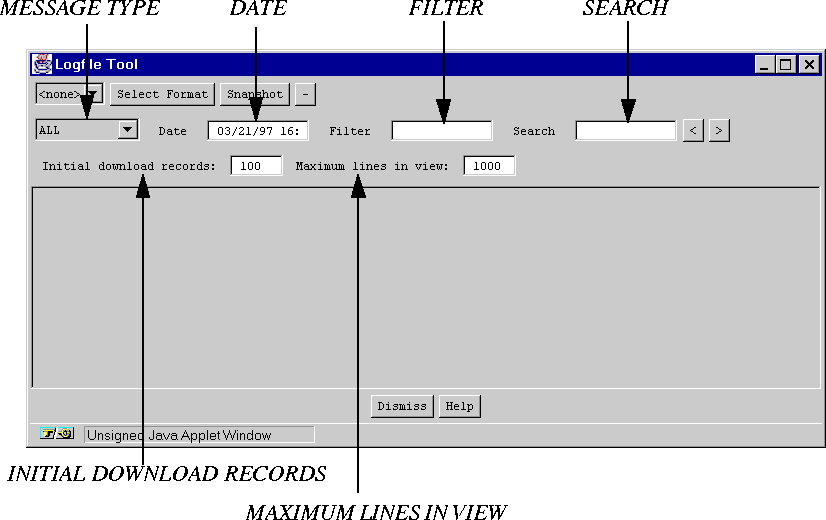
As you may have noticed by examining the fields across the top of Figure 2-14, the Logfile Tool provides more functionality than is apparent when you first open this tool (as shown in Figure 2-11). When you first invoke the Logfile took only a single row of buttons appears in the upper left-hand corner of the Logfile Tool window. If, however, you click on the + sign button (at the far right end of that row) additional options for using the tool are displayed, as shown in Figure 2-15.

Figure 2-15: Logfile Tool with All Options Displayed

The six fields that are then displayed allow you to choose a ULOG file and specify which parts of it you want to see.

Use the . . . To . . .
"Message Type" scrollable menu To choose the types of messages (such as error messages and warnings) you want to view.
Date field To specify the date of the ULOG file you want to view. By default, the ULOG file for the current day (on the server) is displayed.
Filter field To request a subset of entries (within the set of lines you request through the "Initial Download Records" field) that match a string that you specify in this field.
Search field To look for a particular record (in the portion of the ULOG file that you are viewing) by matching a string that appears in that record. Enter the string to be matched in this field.
Initial download records field To specify the number of records you want to view when you download the ULOG file. (The default is 100.)
Maximum lines in view field To specify the highest number of lines you want to have available for display in the window at a given time. (The default is 1000.)

Event Tool Button

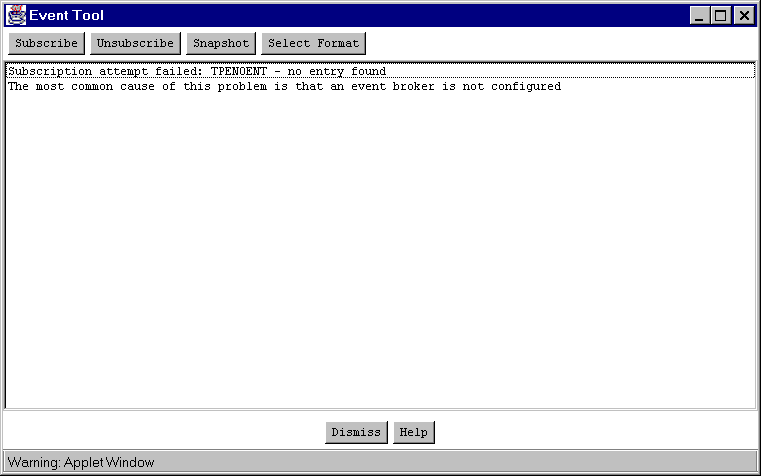
The "Event Tool" allows you to monitor system-generated events. To launch the Event Tool:

  1. Click on the "Event Tool" button in the Power Bar. A pop-up window will be displayed.

    Figure 2-16: Sample Initial Event Tool Window

    The menu bar across the top of this window offers four options.

    Select This Button . . . To . . .
    Subscribe Request notification of specified system events
    Unsubscribe Reject further notification of specified system events
    Snapshot Create a record of the data currently held by the Event Tool
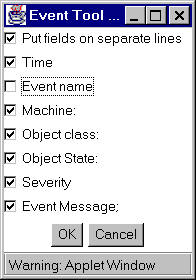
    Select Format Choose parameters for the information being collected by the Event Tool, as shown in Figure 2-17

    Figure 2-17: "Select Format" Menu for the Event Tool

  2. Select the options you want by clicking on the choice box before each one; when finished, click on OK to close the menu.

Stats Tool Button

The Stats Tool button gives you a tool for viewing statistics on various classes of objects in an active domain.

To view the current statistics for a class of administrative objects:

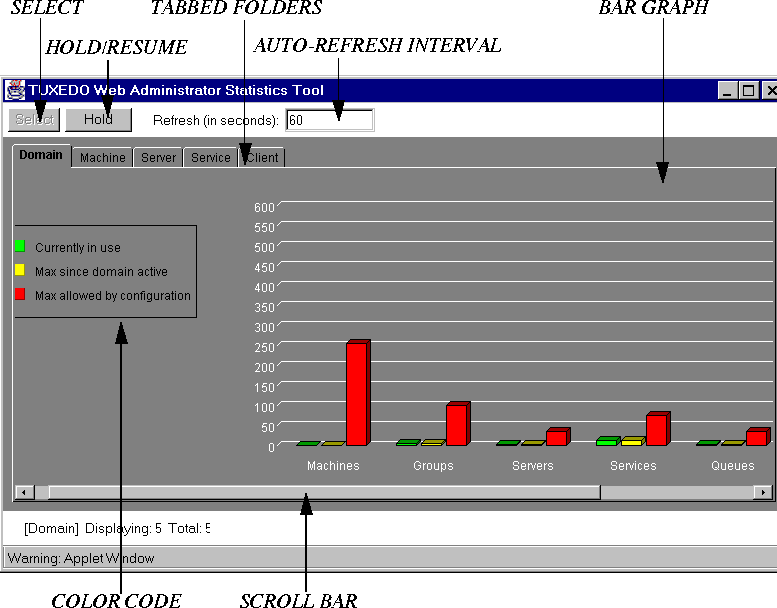
  1. Click on the "Stats Tool" button. A new window opens, displaying a set of class-specific folders for which statistics are available. By default, the "Domain" folder is open, displaying statistics (in the form of a bar chart) as shown in Figure 2-18.

    Figure 2-18: Sample Statistics Tool Window

    The "Domain" folder, unlike the other four folders, always provides statistics for the same set of administrative classes: Machines, Groups, Servers, Services, and Queues.

    The bar graph can be displayed as either a two-dimensional or three-dimensional illustration. To toggle between these two views, put the cursor in the bar graph, hold down the left mouse button, and move the cursor around within the bar graph until you find the presentation style you prefer.

    Statistics are updated periodically, at a regular interval specified in the "Refresh" field at the top of the window. The default interval for refreshing the statistics is 60 seconds, as shown here. You can change the refresh interval by entering a different number (representing seconds) in this field.

  2. To temporarily stop your statistics from being updated, click on "Hold" in the upper left-hand corner of the window. The word "Hold" will be replaced by the word "Resume" and the bar graph will remain unchanged until you request resumption of updating.

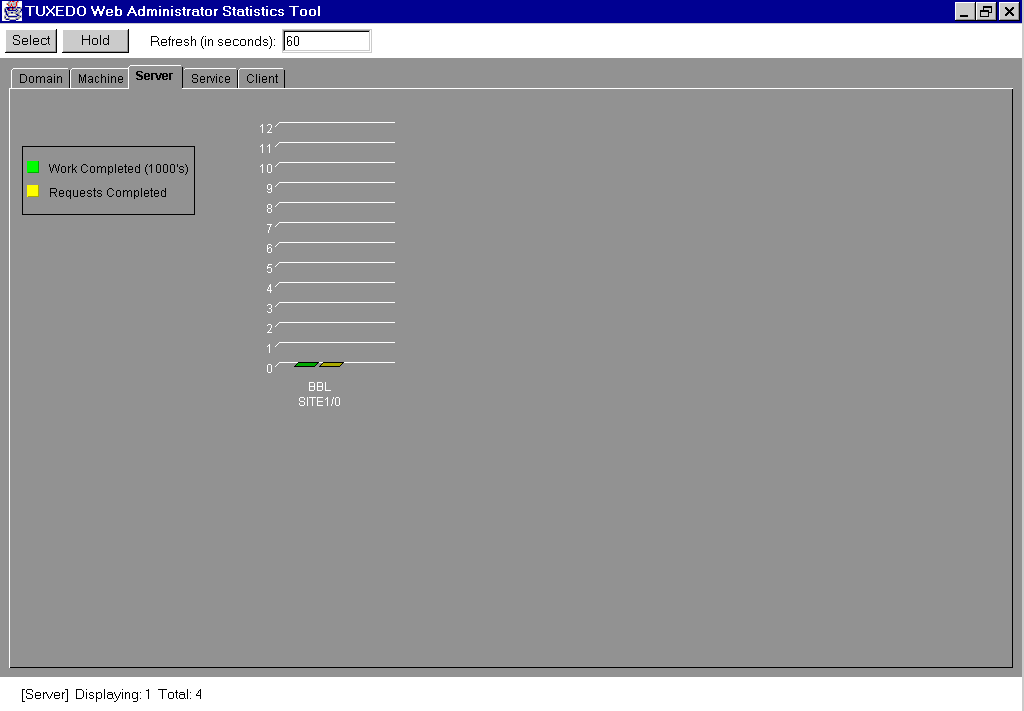
  3. To view the statistics for any of the other classes for which statistics are available (Machine, Server, Service, and Client), click on the appropriate tabbed folder. For example, if you select the "Server" folder, the window shown in Figure 2-19 is displayed.

    Figure 2-19: Sample Server Statistics

  4. To request the display of more statistics in this class of objects (such as servers, in this example), you need to see a list of objects for which statistics are available.

    Statistics are available for the number of objects listed in the line labeled "[Server]" that appears below the tabbed folder. This line specifies the number of objects for which statistics are currently displayed ("1" in Figure 2-19) and the total number of objects of this type for which statistics are available ("4" in Figure 2-19).

    To get a list of all the objects for which statistics are available, click on "Select" in the upper left-hand corner of the window. A new window will be displayed, offering a list of objects for which you can view statistics.

  5. To select one or more items from the list, highlight them and press either "OK" or "Apply" at the bottom of the window. (If you press "OK," the current window with the list of objects will be closed; if you press "Apply," it will remain open so you can make further selections.) The bar graph will be expanded to include statistical information for the specified objects.

Options Button

The Options button lets you set three parameters for your administrative GUI session:

CS Help Button

The Context Sensitive (CS) Help button lets you request information about a specific GUI tool or administrative task while you are using the tool or doing the task.

Context-sensitive help for the Configuration Tool is available as follows:

  1. Click on the CS Help button. The cursor will change to a cross-hairs icon.

  2. Put the cross-hairs icon on the part of the screen for which you want help and click. A new window will open on the screen, displaying information about the area you have just highlighted.

    Example

    Suppose you are configuring the machines in your application. You have opened the "General" folder (in edit mode) for the first machine listed in the "Machines" class in the Tree. Now you need to enter values in the fields presented on that folder, but you do not know what type of value is expected.

  3. Click on the "CS Help" button. The cursor will be changed into a cross-hairs icon.

  4. Select the appropriate field on the "General" folder by putting the cross-hairs cursor on it and clicking. A new window will open on your screen, displaying the information you need.

    The procedure for using the CS Help button while you are adding an object to your domain with the "New" menu option differs from the procedure used while using the Configuration Tool. To get context-sensitive help while using the "New" menu option, begin in the usual way: click on the "CS Help" button and, when the cursor changes to a cross-hairs icon, move it to the current ("New") window. The window will collapse into an icon at the bottom of the screen and the cross-hairs cursor will be replaced by the standard cursor. Click on the iconified window to re-open it on the screen. Then move the cursor to the target object in that window. A new window will open, displaying context-sensitive help.

Help Button

The Help button takes you to the beginning of the BEA TUXEDO Administrator's Guide to the Web-based GUI, so you can choose the information that will be most helpful.

The Tree

The Tree appears in the left-hand column of the main GUI window.

Figure 2-21: The Tree in the Main GUI Window

Structure of the Tree

The Tree is a hierarchical representation of the administrative objects in a single BEA TUXEDO domain. The GUI graphically depicts the relationship between each object and the others by showing its nesting level and parent objects. You can choose to view a complete Tree (comprising all configurable objects of all types in the domain) or a subset of objects.

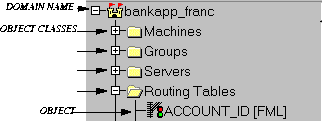
Figure 2-22 shows the top part of the sample tree shown in Figure 2-21.

Figure 2-22: Sample Tree

DOMAIN NAME

The name of the domain or application ("bankapp_franc") appears at the top of the tree beside a castle, the symbol of a domain. Here the castle is pictured with its door open and flags rampant, which means you are connected to the domain. (When you are not connected to a domain, the castle is shown with a closed door and no flags are visible.)

OBJECT CLASS

The name of each class of administrative objects (such as "Machines" or "Groups") is listed beside a folder icon. The folder symbolizes the collection together, in one place, of all the objects belonging to the relevant class.

An object class folder is depicted as closed or open, depending on whether the objects within it are also being displayed in the Tree. For example, in Figure 2-22:

OBJECT

The name of each class in the Tree serves as a heading for a list of the objects included in that class. For example, suppose your domain includes two machines (both at SITE1) named "goofy" and "sleepy." Both machines will be listed in the Tree below the name of the class to which they belong: "Machines." Thus they will be listed as follows:

Using the Tree

This section explains how to:

Searching for Objects

  1. Click on the "Search" button in the Power Bar. A pop-up menu of administrative class objects will be displayed.

  2. Click on the name of the desired object; the cursor will move to it.

Traversing the Tree

To display the Tree for a particular domain:

  1. Specify the domain through the "Domains" menu in the Menu Bar. (See "The Domains Menu" earlier in this chapter, for instructions on specifying a domain.) The domain symbol (a castle) will appear at the top of the Tree area, followed by the name of the domain.

  2. Open the Tree for this domain by clicking on the + (plus) sign to the left of the castle. A list of the classes of administrative objects will be displayed below the castle.
    The name of each class is preceded by a folder, the symbol of a class. To the left of each folder icon, you will see a plus sign, like the one, shown above, that marks the domain entry.

  3. To display a list of the objects in a class, select that class by clicking on the + (plus) sign preceding the name of the appropriate class. For example, to see which machines are used in your application, select "Machines."

    When all the objects in a class are being displayed (that is, when no objects remain to be displayed), the + (plus) sign that precedes the class name is replaced by a - (minus) sign.

    Example

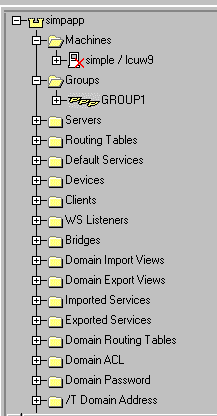
    Let's traverse the Tree for a sample domain called "simpapp."

  4. Click on the + sign in front of the domain name ("simpapp"); 13 classes of administrative objects (Machines, Groups, Servers, Routing Tables, Default Services, and so on) are listed in this domain. The + sign is replaced by a - sign, indicating that no more classes remain unlisted for the "simpapp" domain.

  5. Click on the + sign in front of the "Machines" class name; one object (a machine called lcuw9) is listed in this class. The + sign is replaced by a - sign, indicating that no more objects remain unlisted for the "Machines" class.

  6. Click on the + sign in front of the "Groups" class name; one object (a group called GROUP1) is listed in this class. The + sign is replaced by a - sign, indicating that no more objects remain unlisted for the "Groups" class.

    Figure 2-23 shows how your tree appears in the main window after you have traversed it as described above.

    Figure 2-23: Sample Tree Traversal

Controlling the Content of the Tree

By default, all administrative classes available for your domain are displayed in the Tree. You have the option, however, of having the Tree display a different set of classes.

Also, if you subsequently decide to restore some dropped classes to the Tree, the GUI allows you to add them back. In other words, you always have the choice of expanding or contracting the Tree being displayed.

Example

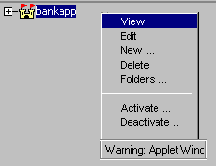
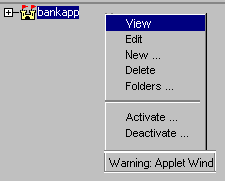
  1. Invoke the Quick Menu by putting the cursor on the name of the domain (bankapp) and clicking the right mouse button.

    Figure 2-24: Quick Menu

    The items listed in this menu vary, depending on which type of object you select. Figure 2-24 shows the menu displayed for domains.

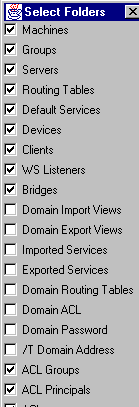
  2. Select "Folders . . ."; a list of classes that may be included in the Tree is displayed.

    Figure 2-25: Partial Menu of Folders

    Which list of folders you see depends on which type of object you have requested.

  3. To select a class, click on the box in front of its name; a check mark will appear in the box.

  4. When you have finished selecting classes, click on OK (at the bottom) to close the menu.

  5. Now click on the + (plus) sign in front of the domain name; the top of the tree you have just specified will be displayed.

The Configuration Tool

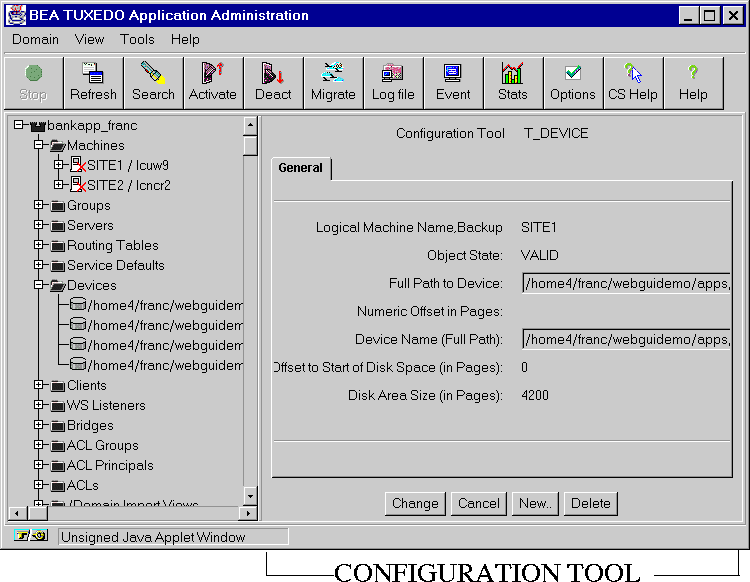
The Configuration Tool appears in the right-hand column of the main GUI window.

Figure 2-26: The Configuration Tool in the Main GUI Window

The Configuration Tool consists of a set of tabbed folders and a row of buttons for controlling the changes you make in those folders.

Chapter 4 is a detailed reference guide to the Configuration Tool.

The Tabbed Folders

The tabbed folders in the Configuration Tool area are electronic forms that display and solicit (from you) information about the attributes of an administrative object.

A set of folders is provided for each administrative class of objects (such as machines and servers). The number of attributes associated with a class varies greatly, depending on the class. Therefore, you may find anywhere from one to eight folders displayed when you invoke the tabbed folders for a selected object.

To display a set of tabbed folders:

  1. Select an object in the Tree by clicking on its name.

  2. Click the right mouse button to pop open the Quick Menu.

  3. Click on "View."

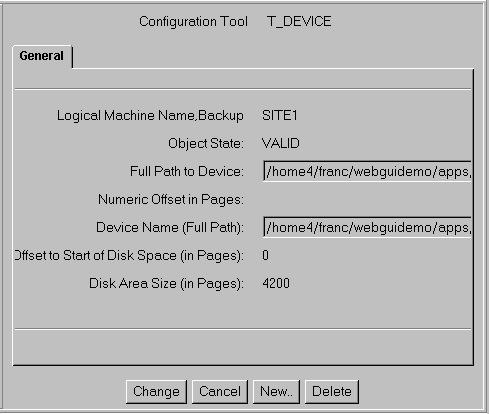
    The tabbed folders available for the object you have selected will be displayed in the Configuration Tool area, as shown in Figure 2-27.

    Figure 2-27: Tabbed Folder in the Configuration Tool Area

The Configuration Tool Buttons

The row of buttons below the tabbed folders allows you to implement the changes you make in those folders.

Use This Button . . . To . . .
Change Implement the changes you have made in the tabbed folders
Cancel Nullify changes you have made in the tabbed folders
(as long as you have not pressed "Change")
New . . . Add an administrative object to the current domain
Delete Remove an object from the current domain

The Quick Menu

The Quick Menu appears in the Tree area when it is invoked.

The GUI provides a Quick Menu of frequently performed tasks for every administrative object and class of objects in the Tree. The contents of the menu depend on (a) whether the menu is being invoked for a class or an object, and (b) the specific class or object for which it is being invoked.

Invoking the Quick Menu

To invoke this menu:

  1. Click on the name of a class or an object in the Tree.

  2. Click the right mouse button.

    The appropriate Quick Menu will be displayed, such as the sample menu shown in Figure 2-28.

    Figure 2-28: Sample Quick Menu

  3. If you want to perform an operation listed on the menu, click on the entry for it.

  4. If you do not want to perform any of the operations listed, you can close the menu (without making any selections) by clicking anywhere outside it.

Quick Menu Operations

The following table briefly describes the operations available through Quick Menus. No single Quick Menu offers all these operations; each menu contains a subset.

Use This Quick Menu Option . . . To . . .
View Display the tabbed folders containing information about a selected object
Edit Change one or more parameters for a selected object
New Add a new BEA TUXEDO object
Delete . . . Delete a BEA TUXEDO object
Folder . . . Indicate which classes of objects you want to see represented in the tree
Activate . . . Activate a selected object
Deactivate . . . Deactivate a selected object
Swap Migrate the Master and Backup servers in a distributed configuration
Clean Detect and remove dead clients and servers; remove partitioned machines
Migrate Move groups of servers to an alternate processor
Connect Establish a connection (bridge) between two machines
Advertise Advertise a service
Unadvertise Hide a currently advertised object from other applications
Suspend Prevent the application from accessing a service
Resume Make a currently suspended service available
Kill Terminate a BEA TUXEDO client or service
Abort Stop a transaction that is currently in progress and roll back all affected data
Open Allocate and initialize shared memory and semaphores for a /Q queue space
Close Remove shared memory and other IPC resources for a /Q queue space

View

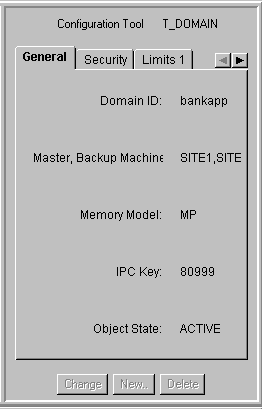
Select "View" to request a display (in the Configuration Tool area) of the tabbed folders containing the attributes of the current domain. Figure 2-29 shows an example: the first set of attributes for the "bankapp" domain are displayed in the "General" tabbed folder.

Figure 2-29: The "General" Attributes of the Active Domain

Edit

Select "Edit" to create or modify parameters for the active domain by editing the appropriate fields in the relevant tabbed folders in the Configuration Tool area.

Not all the fields on the tabbed folders can be edited; some display information that cannot be changed, such as statistics for the current operation of the domain.

When you select "Edit," the value assigned to each parameter that can be modified is displayed in a white edit box. To change a parameter, simply highlight its current value and enter a new one. When no value exists for a parameter, an empty edit box is your prompt to provide one.

When a piece of information is displayed but cannot be changed, it is not shown inside a white box.

Figure 2-30 shows examples of both editable and non-editable fields.

New . . .

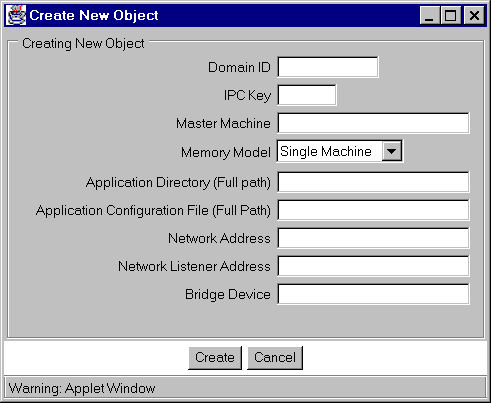
Select "New" to create an object of the type you have highlighted. A pop-up window prompts you to provide three pieces of information for the new object: its IPC key, the master machine for it, and a backup machine for it. The first two are required; naming a backup machine is optional. Figure 2-31 shows a sample pop-up window for creating a new object.

Figure 2-31: Creating an Object by Selecting "New"

Delete

Select "Delete" to remove the current object.

Folders . . .

Select "Folders . . . " to display a list of the folders available for the active domain, and specify which Folders you want included in your Object Tree.

Activate . . .

Select "Activate" to specify objects within the current class that you want to make active. For a detailed description, see "Activate" in "The Power Bar" section earlier in this chapter.

Deactivate . . .

Select "Deactivate" to specify objects within the current class that you want to make inactive. For a detailed description, see "Deactivate" in "The Power Bar" section earlier in this chapter.

Clean

Select "Clean" to clean the Bulletin Board on the specified machine to restart or clean up any servers that may require it. If the machine in question is partitioned, entries for processes and services identified as running on that machine are removed from all non-partitioned Bulletin Boards.

Migrate . . .

Select "Migrate" to move all the servers currently on one machine to another. For details, see the "Migrate" section of "The Power Bar" earlier in this chapter.

Connect . . .

Select "Connect" to link one site to another by activating a bridge between the two. To create such a bridge:

  1. Click on "Connect." A pop-up window prompts you to provide the logical machine ID (LMID) for the machine to which you want the specified machine to be connected.

    The "LMID" is the first of two strings (separated by a "/") that identify a machine in the Tree. The second string is the physical machine ID, or PMID. For example, suppose the "Machines" class in your Tree includes the following entry: "SITE1/rcuw9". In this case, the LMID is "SITE1" and the PMID is "rcuw9".

  2. Enter the appropriate LMID.

  3. Click on "OK" (at the bottom of the window). A pop-up window confirms that the operation succeeded; a bridge now connects the two sites.

Swap Master . . .

Select "Swap Master" if you want to change the machine from which you run your BEA TUXEDO application. To be able to do this, you must have already identified one machine as a "Master" and a second machine as a "Backup."

To swap machines, simply select this item ("Swap Master . . .") from the Quick Menu. A new window is displayed, with a message indicating whether the swap has been successful.

For more information about swapping machines, see Chapter 5.