In this section you will learn to setup a server and run your web application in a web container. You will also learn how to debug your web application using breakpoints in your web pages.
Background
Workshop offers a powerful JSP debugger that
integrates with your existing Eclipse Java debugger. For example you can
set a breakpoint in a JSP page, step into the Java implementation of a
JSP tag, and then back to the page, and so forth. The IDE can automatically
configure, deploy the web application, and start the server for you, or
you can attach to an existing server for debugging.
Undeploy Previous Tutorial Code
WebLogic Server does not support the deployment of projects with the same
name from two different locations on disk.
For this reason, anytime you deploy a sample or run through a tutorial,
you should check your server for previous deployments of the same code.
If your server already has a deployment of the sample or tutorial code,
you should undeploy
any previous code.
Creating a server configuration
Workshop has the ability to run and debug applications on most of the
popular web containers that are in use today. Before you can run this sample
application, you must have a server installed.
Click on the Servers tab (at the bottom region of
the IDE).
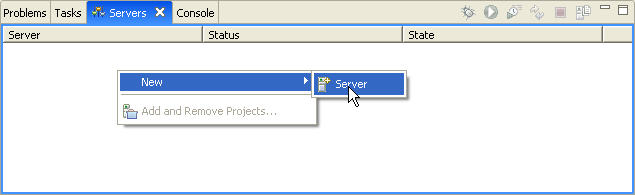
Right-click on the Servers view and choose New > Server.
Choose BEA WebLogic Server v10.0. Click Next.
From the Domain home dropdown select BEA_HOME\wlserver_10.0\samples\domains\workshop_10.1.
Click Next.
Select the Struts tour project in the left pane
and click Add to
move it to the right pane. Click Finish.
The new server is displayed in the Servers view.
Run/Debug the Application
To run the application, right-click on the home.jsp file either in the editor or in Project Explorer or AppXplorer views. Choose Run As > Run on Server.
To debug your application, right-click on the home.jsp file and choose Debug As > Debug on Server.
Using breakpoints with web pages
Double-click searchResults.jsp in the AppXplorer to
open this page in the editor.
In the Source editor, find the line containing the sonic:searchResults tag.
Right-click in the Source editor markers bar at this line location, and
choose the Toggle Breakpoint command.
The markers bar is the gray area at the left side of the Source editor.
In the running web application, click the Rock link under the ‘your
favorite music...’ image.
The JSP debugger stops at the breakpoint set above.
Notice that the JSP debugger added a JSP Variables view
to the Debug perspective. On the JSP
Variables view,
expand the Available
Variables node.
This node shows the variables accessible by this page regardless of their
origin (JSP page, Struts action, and so forth). This saves you time
looking for the variables you are using in the page in the application
server-specific maps!
Select Run > Step Into, and the Java debugger stops in the doStartTag method of the JSP tag.
Select Run > Step Return, and the control returns to the searchResults.jsp page.
You can now continue stepping or select Run > Resume to resume the web application.
Stop the server by clicking the Stop Server icon on the Console view title bar.