Set a Breakpoint
The Design/Source view shows you when HTML tags are mismatched or badly formed. However if you have logic errors in the JSP, you may want to debug your file with standard debugging tools. Workshop extends the Eclipse debugger to allow you to debug JSP code.
To set a breakpoint:
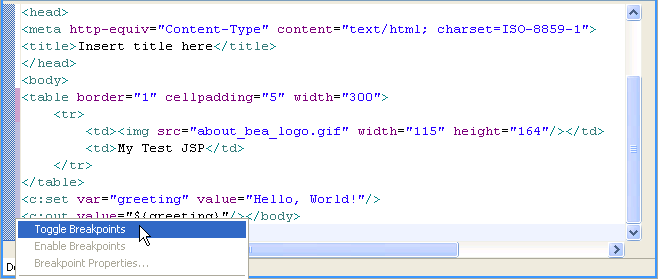
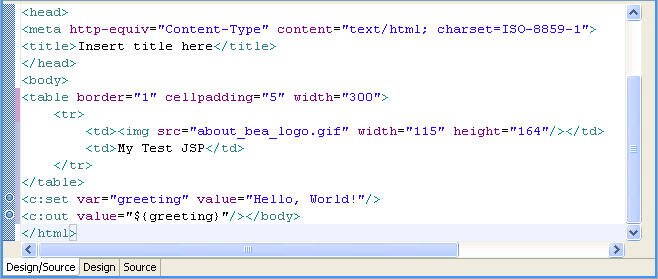
- Right-click in the gutter of the Source view and select Toggle Breakpoints.

In this case, we have only two lines of JSP tags, so set breakpoints on both lines.

Debug the JSP
To debug the application:
- Right-click in Source view and select Debug As > Debug on
Server.
The process is the same as for running an application.
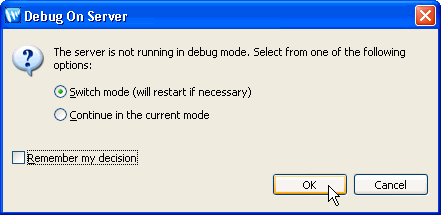
Note that since the server was started before in non-debug mode, you will be prompted to restart the server. - Click OK to restart in Debug mode.

- In the JSP Debugger dialog click Yes.

- The application starts to run. When it hits a breakpoint, it switches to Debug perspective automatically and you can proceed as for a normal debugging session, viewing variable values, stepping through, etc.
Related Topics
Special Considerations When Debugging JSPs
Click the arrow below to navigate through the tutorial: