Before you debug an application, define a server and add the project to the server, as described below for the servers that are supported:
If you are deploying an EAR project that contains multiple web applications, you must update your server definition to specify WAR deployment (not the default "exploded" mode) before debugging your project/application. Click the link for your server (below) for instructions on specifying WAR deployment:
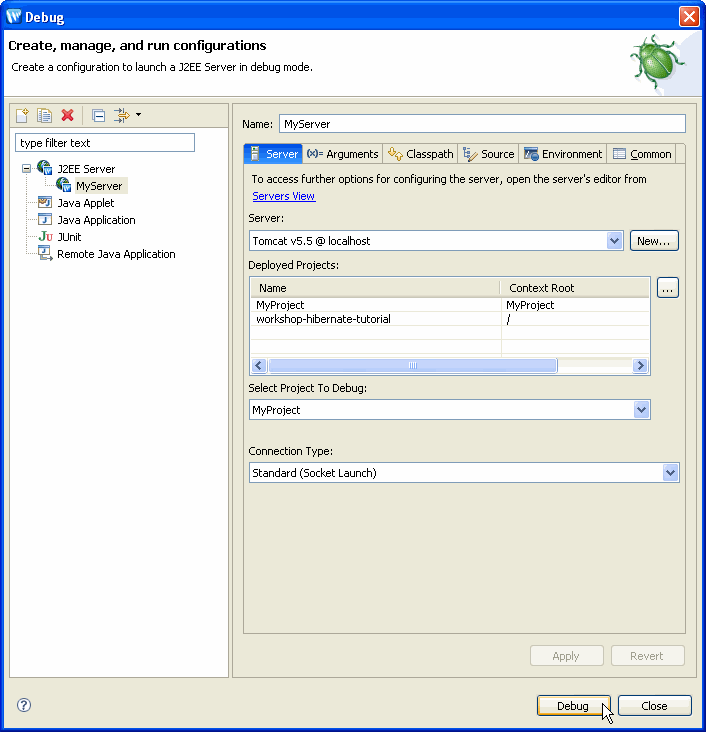
Once your server is defined, to debug an application, choose Run > Debug. The following dialog is displayed.
Once the debugger launches, Debug perspective will open.
For information on using the Eclipse debugger, consult Help > Help Contents > Java Development User Guide. The Workshop Studio family of products extends the Eclipse debugger to provide the following additional features.
The JSP Variables view shows the variables accessible by this page regardless of their origin (JSP page, Struts action, and so forth). This saves you time looking for the variables you are using in the page in the application server-specific maps!
It has five categories:
The JSP breakpoints can be added, removed, enabled or disabled from the vertical ruler of the Workshop editor either by double-clicking on a line or by using the context menu.
JSP breakpoints can be set at the following locations:
The JSP debugger can step through the JSP source or through the server generated Java source. In JSP mode the stepping commands are declared as follows:
The JSP debugger will step over the following elements:
The JSP debugger will step into the following elements:
Step return works exactly like the Java equivalent.
The server generated Java source behind the JSP page can be seen by selecting the "Show Java Source" inside the Debug View pull down menu. When in the mode the debugger steps over the Java lines.