The debugger in the Workshop Studio products is an extension of the Eclipse debugger to allow JSP debugging. In this step, we will set a break point in our JSP and see how you can debug JSPs as easily as Java files.
The tasks in this step are:
The Design/Source editor shows you when HTML tags are mismatched or badly formed. However if you have errors in the JSP, you may want to debug your file with standard debugging tools. Workshop Studio extends the Eclipse debugger to allow you to debug JSP code.
To set a breakpoint:

In this case, we have only two lines of JSP, so set breakpoints on both lines.
To debug the application
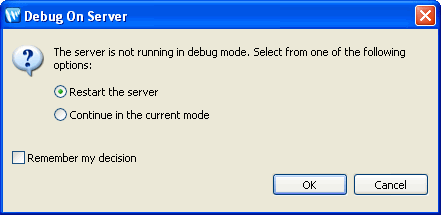
Note that since the server was started before in non-debug mode, you will be prompted to restart the server. Click OK to restart in Debug mode.

Click the arrow below to navigate through the tutorial: