In this section you will learn to setup a server and run your web application in a web container. You will also learn how to debug your web application using breakpoints in your web pages.
Using Workshop for JSP, you can run and debug your web application with any of the major application servers and servlet containers, such as Jakarta's Tomcat, JBoss, BEA's WebLogic, and IBM's WebSphere. Workshop for JSP offers a powerful JSP debugger that integrates with your existing Eclipse Java debugger. For example you can set a breakpoint in a JSP page, step into the Java implementation of a JSP tag, and then back to the page, and so forth. The IDE can automatically configure, deploy the web application, and start the server for you, or you can attach to an existing server for debugging.
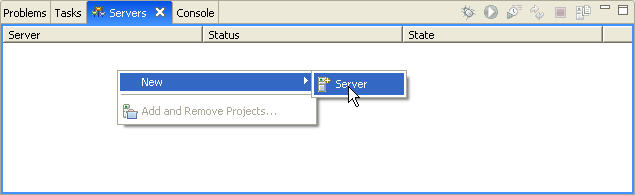
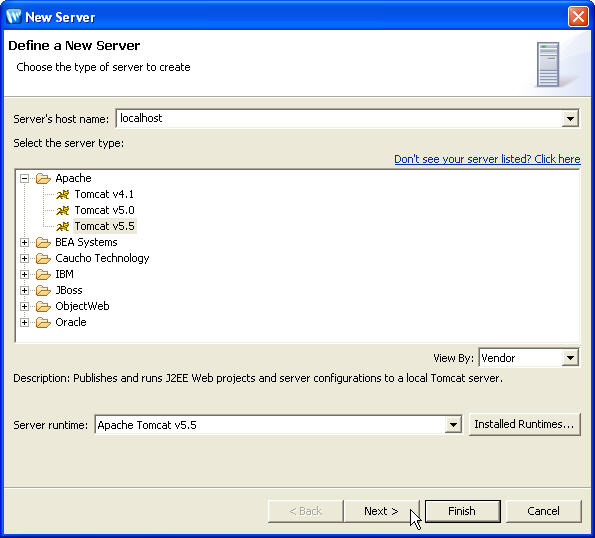
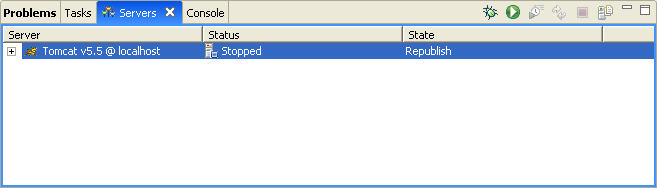
Workshop has the ability to run and debug applications on most of the popular web containers that are in use today. Before you can run this sample application, you must have a server installed.
To run the application, right click on the home.jsp file either in the editor or in Package Explorer or AppXplorer views. Choose Run As > Run on Server.
To debug your application, right click on the home.jsp file and choose Debug As > Debug on Server.
searchResults.jsp in the Package Explorer to open this page in the editor.
<sonic:searchResults id="results" searchId="search"/>
The markers bar is the gray area at the left side of the Source editor.
The JSP debugger stops at the breakpoint set above.
This shows the variables accessible by this page regardless of their origin (JSP page, Struts action, and so forth). This saves you time looking for the variables you are using in the page in the application server-specific maps!
doStartTag method of the JSP tag.
searchResults.jsp page.
![]()
Running and debugging your application
Click one of the following arrows to navigate through the tutorial:
|
|
|