| Oracle® Audit Vault Auditor's Guide Release 10.2.3.1 Part Number E13842-02 |
|
|
View PDF |
| Oracle® Audit Vault Auditor's Guide Release 10.2.3.1 Part Number E13842-02 |
|
|
View PDF |
This chapter contains:
The Oracle Audit Vault reports are automatically generated reports that describe the state of audited activities. They reflect audited data collected from the Oracle Database, Microsoft SQL Server, Sybase ASE, and IBM DB2 source databases that connect to the Audit Vault Server. For all of these products, they track the audit events described in Appendix A through Appendix D.
The default reports are organized into various categories, such as access reports and management reports. You can create user-defined reports that focus on specific areas or audited events.
Any user who has been granted the AV_AUDITOR role can view and modify the reports.
To access the Oracle Audit Vault audit reports:
Log in to the Oracle Audit Vault Console and log in as a user who has been granted the AV_AUDITOR role, as explained in Section 1.4.
The Home page appears.
Click the Audit Reports tab in the upper-right corner of the window.
Do one of the following:
To use the default reports: Click the Default Reports secondary tab. Figure 3-1 shows the Default Reports page. To view a report (for example, Data Access under the Access Reports category), click its link.
To use user-defined reports: Click the Custom Reports secondary tab. If you have created any user-defined reports, click the name of the report in the Report Name column to access the report.
Figure 3-1 shows the Default Reports page.
The default access reports track general database access activities such as audited SQL statements, Oracle Database Vault activities, application access activities, and user login activities. You can create user-defined reports from these reports; see Section 3.8 and Section 3.10.
The access reports are as follows:
The Activity Overview report page displays all audit trail records. Audit records display based on their audit event time in descending order (newest record first). This report can be very large, but you can create a user-defined version that filters specific audit data. By default, 15 audit records are displayed on each page.
Figure 3-2 shows the Activity Overview page.
The Data Access Report displays audited SQL statements, such as Oracle Database data manipulation language (DML) activities (for example, all SELECT, INSERT, UPDATE, or DROP SQL statements).
See Also:
Section A.5 for Oracle Database audit events
Section B.5 for SQL Server audit events
Section C.5 for Sybase Adaptive Server Enterprise audit events
Section D.5 for IBM DB2 audit events
Section 3.6.4 if you want to use the Data Change Report to track changes to row data from INSERT or UPDATE statements
The Database Vault Report displays audited Oracle Database Vault activity. These audit records are collected from the Oracle Database Vault audit trail.
If the Database Vault Report does not show data, then Oracle Database Vault may not be enabled. To check that Oracle Database Vault is enabled, log in to SQL*Plus and then query the V$OPTION table. Any user can query this table. If Oracle Database Vault is enabled, the query returns TRUE; otherwise it returns FALSE. Remember that you must enter the parameter value, Oracle Database Vault, using case-sensitive letters, as in the following example:
SQL> SELECT * FROM V$OPTION WHERE PARAMETER = 'Oracle Database Vault';

PARAMETER                     VALUE
----------------------------- -----------------------
Oracle Database Vault         TRUE
See also Section A.6 for a listing of the Oracle Database Vault audit events.
The Distributed Database Report displays audited distributed database activity, such as Oracle Database CREATE DATABASE LINK or DROP DATABASE LINK statements. (Note that the associated audit events are called peer association events.)
See Also:
Section A.10 for Oracle Database audit events
Section B.9 for SQL Server audit events
Section C.9 for Sybase Adaptive Server Enterprise audit events
Section D.9 for IBM DB2 audit events
The Procedure Executions Report displays audited application access activity, such as the execution of SQL procedures or functions. (Note that the associated audit events are called service and application utilization events.)
See Also:
Section A.12 for Oracle Database audit events
Section B.11 for SQL Server audit events
Section C.11 for Sybase Adaptive Server Enterprise audit events
Section D.11 for IBM DB2 audit events
Section 3.4.4 for information about the Procedure Management Report
The User Sessions Report displays audited authentication events for users who log in to the database. This includes the time the user logged in, the login event, and how the user was authenticated.
See Also:
Section A.15 for Oracle Database audit events
Section B.14 for SQL Server audit events
Section C.14 for Sybase Adaptive Server Enterprise audit events
Section D.14 for IBM DB2 audit events
The default management activity reports track the use of AUDIT SQL statements, changes to user accounts, actions performed on the underlying packages for applications, actions performed on database objects, roles and privileges, and system management activities such as database shutdowns and startups. You can create user-defined reports from these reports; see Section 3.8 and Section 3.10.
The management activity reports are as follows:
The Account Management Report displays account management activity of the user's audited SQL statements. This includes audited changes to user accounts and profiles (setting limits on database resources), for example, when user accounts are created, altered, or deleted, and when database schemas are created.
See Also:
Section A.2 for Oracle Database audit events
Section B.2 for SQL Server audit events
Section C.2 for Sybase Adaptive Server Enterprise audit events
Section D.2 for IBM DB2 audit events
The Audit Commands Report displays the use of audit commands, such as Oracle Database AUDIT SQL statements for other SQL statements and database objects. For example, for Oracle Database, this page tracks AUDIT ALL, AUDIT SELECT ON table_name statements, NOAUDIT statements, and so on.
See Also:
Section A.4 for Oracle Database audit events
Section B.4 for SQL Server audit events
Section C.4 for Sybase Adaptive Server Enterprise audit events
Section D.4 for IBM DB2 audit events
The Object Management Report displays audited actions performed on database objects. For example, these audit records are created for create, alter, or drop operations on database objects that are performed on a database table.
See Also:
Section A.9 for Oracle Database audit events
Section B.8 for SQL Server audit events
Section C.8 for Sybase Adaptive Server Enterprise audit events
Section D.8 for IBM DB2 audit events
The Procedure Management Report displays audited actions that were performed on the underlying procedures or functions of system services and applications. For example, it lists the audit records that were created for Oracle Database ALTER FUNCTION, ALTER JAVA, or ALTER PACKAGE statements. (Note that the associated audit events are called application management events.)
See Also:
Section A.3 for Oracle Database audit events
Section B.3 for SQL Server audit events
Section C.3 for Sybase Adaptive Server Enterprise audit events
Section D.3 for IBM DB2 audit events
Section 3.3.5 for information about the Procedure Executions Report
The Role and Privilege Management Report lists audited role and privilege management activity, such as the creating, granting, revoking, and dropping of roles and privileges. It lists the name of the user performing the action, and the user to whom the action applies.
See Also:
Section A.11 for Oracle Database audit events
Section B.10 for SQL Server audit events
Section C.10 for Sybase Adaptive Server Enterprise audit events
Section D.10 for IBM DB2 audit events
The System Management Report displays audited system management activity. For example, it lists activities such as startup and shutdown operations on a database, enable and disable operations on all triggers, and rollback operations. It also lists user-related operations, such as unlocking a user account.
See Also:
Section A.13 for Oracle Database audit events
Section B.12 for SQL Server audit events
Section C.12 for Sybase Adaptive Server Enterprise audit events
Section D.12 for IBM DB2 audit events
The default system exception reports track audit events, such as exceptions that occur and audit activities that Oracle Audit Vault cannot recognize or place into a category. You can create user-defined reports from these reports; see Section 3.8 and Section 3.10.
The system exception reports are as follows:
The Exception Activity Report displays audited error and exception activity, such as network errors.
See Also:
Section A.7 for Oracle Database audit events
Section B.6 for SQL Server audit events
Section C.6 for Sybase Adaptive Server Enterprise audit events
Section D.6 for IBM DB2 audit events
The Invalid Audit Record Report displays audited activity that Oracle Audit Vault cannot recognize, possibly due to a corrupted audit record.
See Also:
Section A.8 for Oracle Database audit events
Section B.7 for SQL Server audit events
Section C.7 for Sybase Adaptive Server Enterprise audit events
Section D.7 for IBM DB2 audit events
The Uncategorized Activity Report displays audited activity that cannot be categorized. For example, it lists events such as Oracle Database COMMENT, CREATE SUMMARY, or NO-OP events.
See Also:
Section A.14 for Oracle Database audit events
Section B.13 for SQL Server audit events
Section C.13 for Sybase Adaptive Server Enterprise audit events
Section D.13 for IBM DB2 audit events
The default compliance reports show compliance-related information that may appear in other Oracle Audit Vault reports. They track activities that are typically required to meet standard compliance regulations, such as changes to the database structure or its objects, failed logins, administrator activities, system events, and user logins or logoffs. You can create user-defined reports from these reports; see Section 3.8 and Section 3.10.
The compliance reports are as follows:
The Account and Role Changes - Blocked Report displays audited activity that identifies all failed attempts to perform security administration changes in the database. For example, these audit records are generated when you enable privilege auditing to audit failed attempts to grant system and table privileges.
The Account and Role Changes Report displays audited activity that identifies all successful attempts to perform security administration changes in the database. For example, these audit records are generated when you use statement or object auditing to audit changes to users that were successfully added, dropped, or altered in the database.
The Changes to Audit Report displays audited activity of audit setting changes (for example, changes to the AUDIT ALL SQL statement).
The Data Change Report displays changes to row data when an insert or update operation occurs in Oracle Database. This report is especially useful if you are using the redo collector to extract the before and after values of data updates.
The DDL Report displays audited data definition language (DDL) activities (for example, changes to the database structure that result from SQL ALTER, CREATE, or DROP statements).
The Login Failures Report displays audited failed login attempts. These audit records are generated for failed login, proxy authentication only, and super user login attempts.
The Login/Logoff Report displays audited login and logoff operations of users. For example, these audit records are generated when you audit events, such as login, logoff, super user login, logoff by cleanup, and proxy authentication only.
The Object Access Report displays audited SQL statements that have been performed on database objects, such as insert or update operations on a specific table.
The critical and warning alert reports track critical and warning alerts. An alert is raised when data in a single audit record matches a predefined alert rule condition. Alerts are grouped by associated source, by event category, and by the severity level of the alert (either warning or critical). You can create user-defined reports from these alerts; see Section 3.8.
The alert reports are as follows:
You can control the display of data in a default or user-defined report to focus on a particular set of data. Oracle Audit Vault automatically saves the report settings so that if you leave the page, the report settings are still in place when you return. Optionally, you can save the report to a user-defined report.
When you hide or show columns in a report, you still can perform operations on hidden columns, such as filtering data based on a column that you have hidden.
This section contains:
To hide the currently selected column:
In the report, select the column that you want to hide.
In the Column Heading menu, click the Hide Column button.
To hide or show columns in a report:
Access the report that you want.
Section 3.2 explains how to access a report.
Select the Actions menu (gear) icon on the Search bar.
The Actions menu appears.
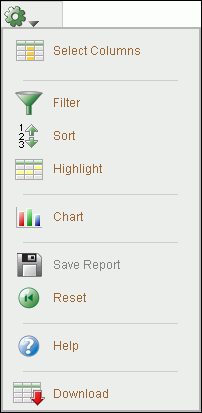
From the Actions menu, select Select Columns.
The Select Columns dialog field appears under the Search bar.
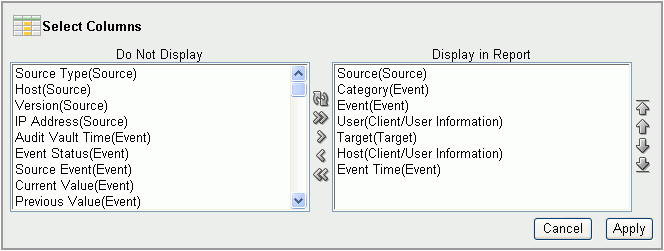
To move column names between the Do Not Display and Display in Report boxes:
Select the column names to move and then click the move to the left symbol (<) or the move to the right symbol (>) between the column name boxes.
Move all columns left or right by using the >> and << buttons.
Use the top button (the arrows in a circle) to reset the columns to their original locations in the two boxes.
To set the order of appearance in the report for displayed columns, in the Display in Report box, select the column name, then click the up arrow or down arrow on the right side of the box to reorder its position in the list.
Report columns names are arranged in a report from left to right by their top-to-bottom order in the Display in Report box.
Click Apply.
You can filter the report to show all rows based on a particular column, or a subset of of rows, using an expression.
If you must perform subquery, join, and AND SQL operations, you can create multiple filters as needed. For example, if you want to filter all SYS users who are being audited for the SUPER USER LOGON event, you would create one filter to catch all SYS users, and then a second filter to catch all SUPER USER LOGON events. If two or more of the filters for a report are enabled, then Oracle Audit Vault uses both or all of them (as in an AND operation). You can toggle specific filters on or off, depending on the results that you want.
This section contains:
This filtering method lets you filter data in all rows based on the currently selected column (for example, all rows that only contain SYS in the User column).
To filter all rows based on data from the current column:
Access the report that you want.
Section 3.2 explains how to access a report.
Under the report name, select the column that you want to use as a basis for the filter.
The Column Heading menu appears. This menu shows the row data used in the column that you selected. For example, if you select the User column, it will list user names found in the source database for this column, such as users APPS, OE, and SH.
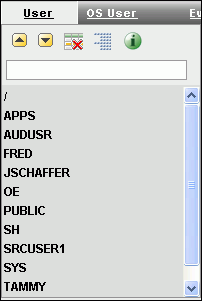
In the Column Heading menu, select the row data on which you want to base the filter, or enter the row data item in the text area field.
For example, to only show rows for users SYS and SYSTEM, select SYS and SYSTEM from the Column Heading menu. Oracle Audit Vault filters the display to only show the data in the filter you created. The filter definitions for the current user session are added above the report columns.
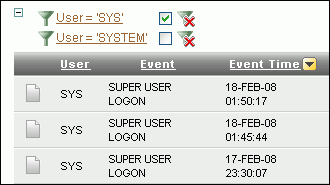
To enable or disable the display of the filtered data, select its corresponding check box. To remove a filter, click its Remove Filter icon.
You can use the Search bar to search for row data in one or all columns in the report (for example, all rows that contain the letters SYS, such as SYS and SYSTEM, in the User column).
To search for row data in one or all columns:
Access the report that you want.
Section 3.2 explains how to access a report.
If you want to focus the search on a specific column, in the Search bar, use the Search icon to select from the list of available columns.
By default, Oracle Audit Vault searches all columns.
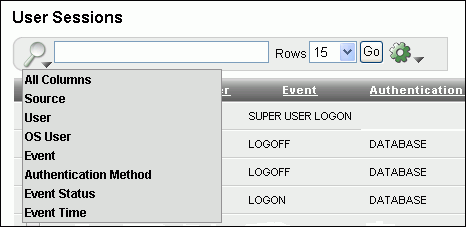
In the Search bar text area, enter all or part of the text in the column row that you want.
For example, enter SYS to find all user names that contain the letters SYS.
The search is not case-sensitive.
In the Rows list, select the number of rows that you want to appear on each page.
The default is 15 rows.
Click Go.
This method lets you select all rows that meet a WHERE condition, such as all users who are not user SYS. You can create the expression for all columns in the source database table, even those that are not shown in the current report.
To filter row data using an expression:
Access the report that you want.
Section 3.2 explains how to access a report.
Select the Actions menu (gear) icon on the Search bar.
Select Filter.
The Filter dialog box appears under the Search bar.
Enter the following information:
Column: Select the name of the column from the list. Note that you can select all columns, including hidden columns.
Operator: Select a SQL operator from the list, for example, > for "greater than" or = for "equals."
Expression: Select an expression from the list. The expression lists the row data (for example, names of users found in the User column). If you type the expression in the Expression field, remember that the expression is case-sensitive. In most cases, use uppercase letters.

Click Apply.
Oracle Audit Vault filters the display of row data based on the expression you created, and then adds the filter definition before the report columns. From here, you can disable or enable the display of the filtered data, or remove the filter, if you want.

You can sort data in ascending or descending order for all columns at once, or sort data on a selected column.
This section contains:
To sort row data for the current column:
Select the column on which you want to base the sort.
In the Column Heading menu, select either the Sort Ascending or Sort Descending icon.
To sort row data for all columns:
Access the report that you want.
Section 3.2 explains how to access a report.
Select the Actions menu (gear) icon on the Search bar.
In the Actions Menu, select Sort.
The Sort dialog box appears under the Search bar.
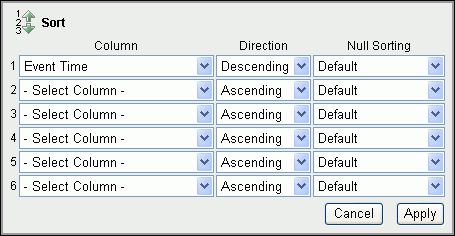
Enter the following information:
Column: For up to six columns, select the columns to sort. By default, the first sort column is Event Time, which is sorted in descending order.
Direction: Select either Ascending or Descending.
Null Sorting: Select the Null sorting rule for each column (Default, Nulls Always Last, or Nulls Always First). The default is to not sort nulls.
Click Apply.
You can highlight specific rows in a report by assigning them colors. This enables anyone viewing the report to quickly find areas that are of particular interest.
To highlight rows in the report:
Access the report that you want.
Section 3.2 explains how to access a report.
Select the Actions menu (gear) icon on the Search bar.
In the Actions menu, select Highlight.
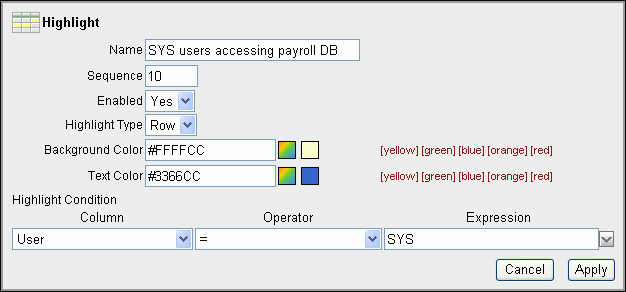
The Highlight dialog box appears under the Search bar.
Enter the following information:
Name: Enter a name for this highlight instance. (Optional)
Sequence: Enter a sequence number to determine the order in which the highlight filter rules are to be applied when two or more highlight filter rules are in effect. The default value is 10.
Enabled: Select Yes to enable the highlight or select No to disable it.
Highlight Type: Select Row to highlight a row or select Cell to highlight a cell.
Background Color: Select a background color for the row or cell. Click a color to display color options, or click the colored icon to the right of the color selection field to display a color selection box from which to choose a different color. Alternatively, you can manually enter the HTML code for a color.
Text Color: Select a text color for the row or cell using the same method you used for the background color. (Optional)
Highlight Condition: Edit the highlight filter rule expression by identifying the column, the operator, and the expression for each of the three fields in the highlight condition.
Column: Select any column name, including hidden columns.
Operator: Select an operator from a list of standard Oracle Database operators, such as =, !=, NOT IN, and BETWEEN.
Expression: Enter the comparison expression (without quotation marks) based on a known value for that column name to complete the filter expression. For example, entering the filter expression EVENT=SUPER USER LOGON filters for all values in the Event column that contain the value SUPER USER LOGON.
Click Apply.
You can select from four chart styles to chart data in a report. After you create the chart, you can access it whenever you access the report.
To chart data in a report:
Access the report that you want.
Section 3.2 explains how to access a report.
Select the Actions menu (gear) icon on the Search bar, and then select Chart.
The Chart dialog box appears under the Search bar.
Enter the following information:
Chart style: Select from one of the four chart styles: Horizontal Column, Vertical Column, Pie, and Line.
Label: Select from the list of columns for this report. You can include hidden columns as well as displayed columns.
Value: Select from the list of columns for this report, including hidden columns. If the function you select from the Function list is Count, then you do not need to select a value from the Value column.
Function: Select an aggregate function (Sum, Average, Minimum, Maximum, or Count) on which to aggregate the data values.
Sort: Select ascending or descending sorting for values and labels.
Axis Title for Label: Enter a name for the axis title.
Axis Title for Value: Enter a name for the axis value.

Click Apply.
The chart appears, with the Edit Chart and View Report links under the Search bar. The following example displays a count of users who have logged in, clearly showing that user JSCHAFFER has been very, very busy.

You can create a break group on the selected column. This pulls the column out of the report as a master record. A break group is a way of grouping all rows with the same value under a master record, thus creating groups of master records, with one master record for each column value. This is useful for filtering by multiple column values.
To add a control break in a column:
Access the report that you want.
Section 3.2 explains how to access a report.
Select the column to which you want to add a control break.
In the Column Heading menu, select the Control Break icon.
The control break is added to the column, and icons for enabling, disabling, and removing the control break are added before the column headings.
You can reset the report display values to their original default settings.
To reset the display settings to their defaults:
Access the report that you want.
Section 3.2 explains how to access a report.
Select the Actions menu (gear) icon on the Search bar, then select Reset.
This section contains:
You can find the following detailed information about an individual audit record: information about the source database, audited event, audited objects (such as tables or views), client/user information, the host computer on which the user is logged, audited SQL statements, the user session information, and miscellaneous information such as the audit record ID, instance number, and fine-grained audit policy name.
To find detailed information about an audit record:
Access the report that you want.
Section 3.2 explains how to access a report.
Use the methods described in Section 3.8 to find the audit record.
Select the Audit Record Details icon, which appears to the left of the first column in the report.

A detailed report for the audit record appears.
To find information about the purpose of a column:
Access the report that you want.
Section 3.2 explains how to access a report.
Select the column on which you want information.
In the Column Heading menu, select the Column Information icon.
This section contains:
You can create user-defined reports based on the default reports or other user-defined reports. You can create a category for the report independently or when you create the user-defined report.
Before you create a user-defined report, you may want to create a category in which to assign it. You can create and manage category names on the User-Defined Reports page.
This section contains:
To create a category name for user-defined reports:
Under Tasks, click Manage Categories.
On the Categories page, click Create Category.
In the Category Name field, enter the name of the new category.
Click Create.
To alphabetize the category name list:
Click the Category Name column label name once.
This positions the direction pointer to point upward (category names appear in ascending order).
Click the Category Name column label name once again to position the direction pointer to point downward (category names appear in descending order).
To edit a category name:
To edit a category name, click the Edit icon (pencil) to the left of the category name.
The Category page appears for the selected category name.
On the Category page, revise the category name by editing the text in the Category Name field.
Click Apply.
You can save the display settings that you have created to a user-defined report. User-defined reports are listed in the Custom Reports secondary tab of the Audit Reports tab. Oracle Audit Vault saves the report settings and makes the user-defined report available the next time you log in to Oracle Audit Vault.
When you save a user-defined report, you can save the report under a specific category that you select or create as you save the report. You can also make the user-defined report private or share it among other Oracle Audit Vault users as a public report.
To create a user-defined report:
Access the report that you want.
Section 3.2 explains how to access a report.
Use the methods described in Section 3.8 to design the display of data as needed.
Select the Actions menu (gear) icon on the Search bar, and then select Save Report.
The Save Report dialog box appears, under the Search bar.
Enter the following information:
Name: Enter a name for the report.
Category: Select from the list of available categories. If you select New Category, then enter a name for the new category.
If you must create a new category, see Section 3.10.2.
Description: Enter a brief description of the report.
Public: Select this check box to enable the report to be accessible to all Oracle Audit Vault users.
Click Apply.
To access a user-defined report:
Log in to the Oracle Audit Vault Console and log in as a user who has been granted the AV_AUDITOR role, as explained in Section 1.4.
The Home page appears.
Select the Audit Reports tab, and then select the Custom Reports secondary tab.
In the Report Name column, select the link for the report that you want to access.
The report appears. Its report details icon and filter definitions appear after the Search bar. From here, you can click the Saved Report link to change the report settings, delete the report, or disable and enable the report filters.

You can download reports to a file that is in a comma-separated values (CSV) format. The CSV file format is a delimited data format with fields separated by the comma character and records separated by new-line characters.
To download a report to a CSV file:
Access the report that you want.
Section 3.2 explains how to access a report.
Select the Actions menu (gear) icon on the Search bar, and then select.
In the Download dialog box, select CSV.
In the File Download dialog box, enter a name for the file.
Click Save to save the file to a location in your file system.