15 Evaluating Performance and Scalability
The Coherence distributed caches will often be evaluated with respect to pre-existing local caches. The local caches generally take the form of in-processes hash maps. While Coherence does include facilities for in-process non-clustered caches, direct performance comparison between local caches and a distributed cache not realistic. By the very nature of being out of process, the distributed cache must perform serialization and network transfers. For this cost you gain cluster wide coherency of the cache data, and data and query scalability beyond what a single JVM or machine is capable of providing. This does not mean that you cannot achieve impressive performance using a distributed cache, but it must be evaluated in the correct context.
15.1 Measuring Latency and Throughput
When evaluating performance you try to establish two things, latency, and throughput. A simple performance analysis test may simply try performing a series of timed cache accesses in a tight loop. While these tests may accurately measure latency, to measure maximum throughput on a distributed cache a test must make use of multiple threads concurrently accessing the cache, and potentially multiple test clients. In a single threaded test the client thread will naturally spend the majority of the time simply waiting on the network. By running multiple clients/threads, you can more efficiently make use of your available processing power by issuing several requests in parallel. The use of batching operations can also be used to increase the data density of each operation. As you add threads, you should see that the throughput continues to increase until you've maxxed-out the CPU or network, while the overall latency remains constant for the same period.
15.2 Demonstrating Scalability
To show true linear scalability as you increase cluster size, you need to be prepared to be add hardware, and not simply JVMs to the cluster. Adding JVMs to a single machine will scale only up to the point where the CPU or network are fully used.
Plan on testing with clusters with more then just two cache servers (storage enabled nodes). The jump from one to two cache servers will not show the same scalability as from two to four. The reason for this is because by default Coherence will maintain one backup copy of each piece of data written into the cache. The process of maintaining backups only begins when there are two storage-enabled nodes in the cluster (there must be a place to put the backup). Thus when you move from a one to two, the amount of work involved in a mutating operation such as cache.put actually doubles, but beyond that the amount of work stays fixed, and will be evenly distributed across the nodes.
15.3 Tuning Your Environment
To get the most out of your cluster it is important that you've tuned of your environment and JVMs. Chapter 20, "Performance Tuning,", provides good start to getting the most out of your environment. For example, Coherence includes a registry script for Windows (optimize.reg), which will adjust a few critical settings and allow Windows to achieve much higher data rates.
15.4 Measurements on a Large Cluster
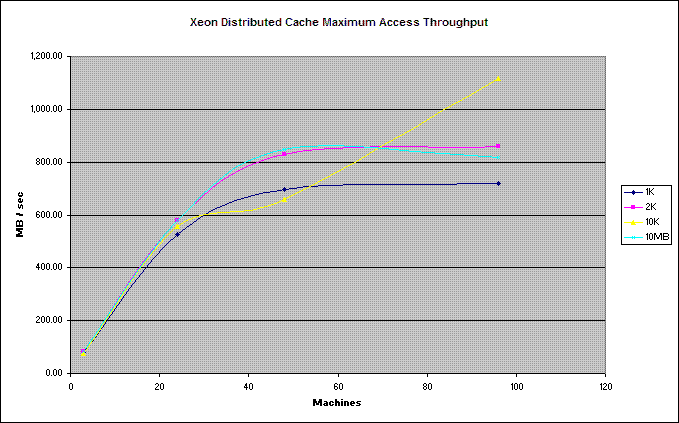
The following graphs show the results of scaling out a cluster in an environment of 100 machines. In this particular environment, Coherence was able to scale to the limits of the network's switching infrastructure. Namely, there were 8 sets of ~12 machines, each set having a 4Gbs link to a central switch. Thus for this test Coherence's network throughput scales up to ~32 machines at which point it has maxxed-out the available bandwidth, beyond that it continues to scale in total data capacity.
Figure 15-1 Coherence Throughput versus Number of Machines

Description of "Figure 15-1 Coherence Throughput versus Number of Machines"
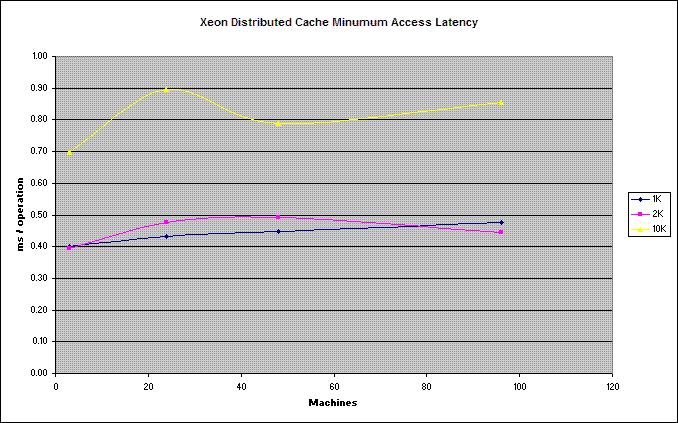
Figure 15-2 Coherence Latency versus Number of Machines

Description of "Figure 15-2 Coherence Latency versus Number of Machines"
Latency for 10MB operations (~300ms) is not included in the graph for display reasons, as the payload is 1000x the next payload size.