19 Monitoring Decision Service Components and Engines
This chapter describes how to monitor Decision Service Components. Decision Service Components are also called Business Rules components in the Oracle Fusion Middleware documentation.
This chapter includes the following topics:
-
Section 19.1, "Monitoring Business Rules Service Engine Instances and Faults"
-
Section 19.2, "Monitoring Business Rules Service Engine Statistics"
-
Section 19.3, "Monitoring Business Rules Service Engine Instances"
-
Section 19.4, "Monitoring Business Rules Service Engine Faults"
-
Section 19.5, "Monitoring Business Rules Service Engine Deployed Components"
-
Section 19.6, "Monitoring Decision Service Component Instances from a Composite Application"
19.1 Monitoring Business Rules Service Engine Instances and Faults
Using the Business Rules Engine home page Dashboard tab, you can monitor recent instances and faults of Decision Service components running in the SOA Infrastructure. These Decision Service components can be part of separate SOA composite applications. Decision Service Components are also called Business Rules components in the Oracle Fusion Middleware documentation.
-
Access the Business Rules Engine home page through one of the following options:
From the SOA Infrastructure Menu... From the SOA Folder in the Navigator... - Select Service Engines > Business Rules.
- Select soa-infra.
-
Right-click and select Service Engines > Business Rules.
-
Click Dashboard.
The Recent Instances area of the Dashboard tab displays recent instances of all Decision Service components, including the instance ID of the Decision Service component, the Decision Service component name, the SOA composite application of which the Decision Service component is a part, the state of the instance, for example, completed successfully or faulted, the instance start time, the last modification time, and a Show logs icon (clicking the Show logs icon shows the Log Messages page with filtered messages specific to that instance).
Note:
To see the state with the correct information, you must set the Capture Composite Instance State option. You can change this setting on the SOA Administration Common Properties page. Turning this feature on allows for separate tracking for "running" instances. However, this may impact the performance. For information on setting this option, see Section 3.1, "Configuring SOA Infrastructure Properties".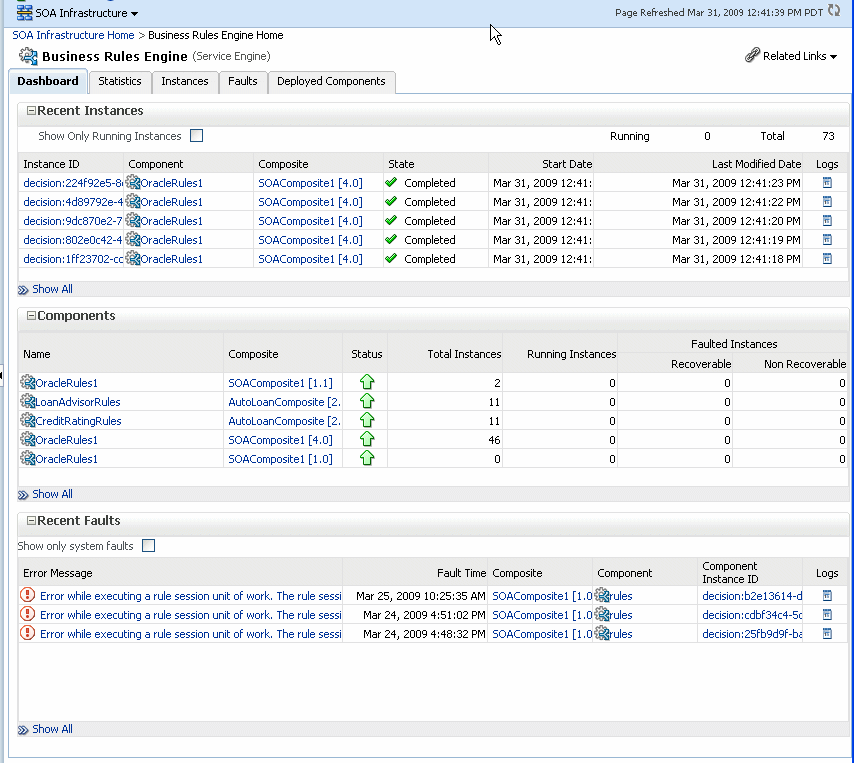
Description of the illustration rules1_engine.gif
-
In the Instance ID column, click an instance ID for a Decision Service component to view its audit trail.
Note:
The contents of the audit trail page depends on the Audit Level settings. When the Audit Level property is set to Production, the audit trail shows only the activity names. When the Audit Level is in Development mode, the audit trail shows the Decision Service instance payload details. In other modes, for example Off, the audit trail does not show Decision Service details. You can change the Audit Level on the SOA Administration Common Properties page. Additionally, this option can be set for a specific composite from the home page for the composite. -
In the Component column, click a specific Decision Service component to access its home page.
-
In the Composite column, click a specific SOA composite application to access its home page.
-
In the Logs column, click a specific log to access the Log Messages page with filtered messages specific to that instance.
-
Click Show All to access the Instances page of the service engine.
The lower part of the Dashboard tab displays the following:
-
The Components table shows the Decision Service components deployed on the Business Rules engine across SOA composites. It also shows the status of the SOA composites and the instance count information in the respective instance state columns.
-
The Recent Faults area shows the recent faults in the service engine, including the error message, the time at which the fault occurred, the SOA composite application in which the fault occurred, the Decision Service component, and the instance ID of the Decision Service component, and a Show logs icon (clicking the Show logs icon shows the Log Messages page with filtered messages specific to that instance).
For more information, see Section 1.2.4, "Understanding Service Components and Service Component Instances".
19.2 Monitoring Business Rules Service Engine Statistics
Using the Business Rules Engine home page Statistics tab, you can monitor the Business Rules engine performance and metrics. This page shows service engine-level not component-level details. Business Rules components are also called Decision Service Components in the Oracle Fusion Middleware documentation.
-
Access the Business Rules Engine statistics page through one of the following options:
From the SOA Infrastructure Menu... From the SOA Folder in the Navigator... Select Service Engines > Business Rules. - Select soa-infra.
-
Right-click and select Service Engines > Business Rules.
-
Click Statistics.
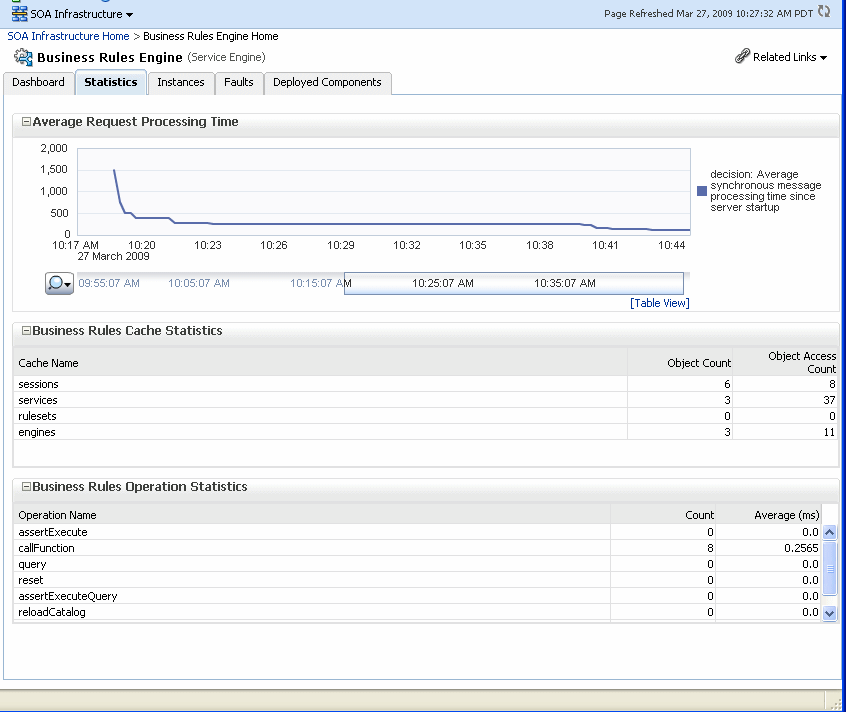
The Statistics tab displays the following:
-
Average Request Processing Time: This chart displays the average request processing time of the Business Rules engine since server startup. That is, how many requests were processed by the service engine per unit of time.
-
Business Rules Cache Statistics: This area provides details about the service engine cache. This area lists the types of caches used by the service engine and the object count in each of the caches. All these metrics are based on the object count since server startup.
-
Business Rules Operation Statistics: This area shows the operation statistics. Using the operation statistics you can determine the number of calls to Oracle Business Rules Decision Functions since server startup, and determine the total time spent in Decision Functions since server startup.
Note:
When you view Business Rules Operation Statistics for composite applications created with Oracle Fusion Middleware 11g Release 1 (11.1.1), the only operation shown is the callFunction operation. In this release the Decision Service only calls Oracle Business Rules using Decision Functions, and this operation is indicated with values for the operation named callFunction (with Count and Average(ms) fields). With composite applications that were migrated from older releases, the Decision Service performs callFunction operations and the other operations listed in the Business Rules Operation Statistics area. For these migrated projects, you can debug the flow of the request through various important operations within the service engine. Also, you can find any long-running operations and take the necessary actions. These metrics also are since server startup.
Description of the illustration rules1_engine_stats.gif
-
19.3 Monitoring Business Rules Service Engine Instances
Using the Business Rules Engine home page Instances tab, you can monitor all Decision Service component instances. These Decision Service components can be part of separate SOA composite applications. Decision Service Components are also called Business Rules components in the Oracle Fusion Middleware documentation.
-
Access the Business Rules Engine Instances page through one of the following options:
From the SOA Infrastructure Menu... From the SOA Folder in the Navigator... Select Service Engines > Business Rules. - Select soa-infra.
-
Right-click and select Service Engines > Business Rules.
-
Click Instances.
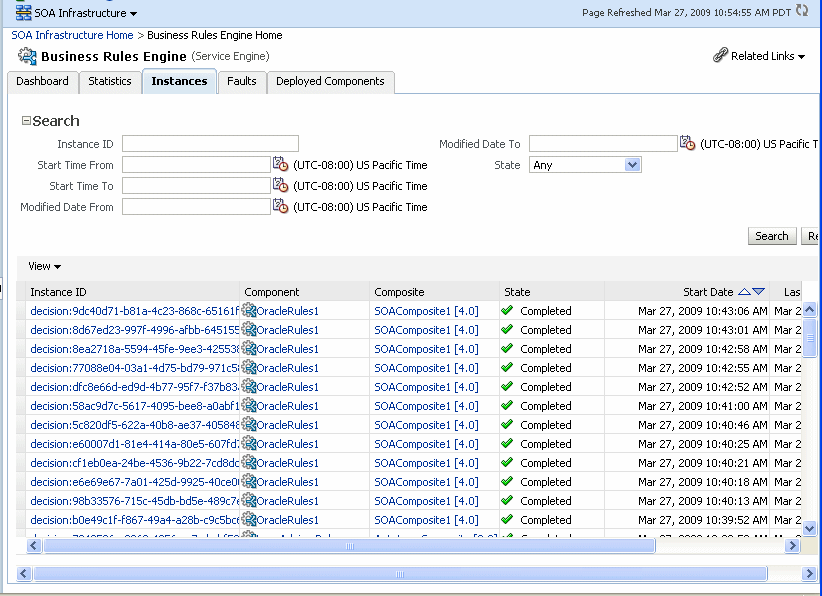
The Instances tab displays the following:
-
A utility for searching for a specific instance by specifying criteria and clicking Search.
-
Instances, including the instance ID of the Decision Service component, the Decision Service component name, the SOA composite application name, the state of the instance (for example, completed successfully, running, or faulted), the instance start time, the last modification time, and a Show logs icon (clicking the Show logs icon shows the instance log messages).
Description of the illustration rules1_engine_instance.gif
-
-
In the Instance ID column, click an instance ID for a Decision Service component to view its audit trail details.
Note:
The contents of the audit trail page depends on the Audit Level settings. When the Audit Level property is set to Production, the audit trail shows only the activity names. When the Audit Level is in Development mode, the audit trail shows the Decision Service instance payload details. You can change the Audit Level on the SOA Administration Common Properties page. Additionally, this option can be set for a specific composite from the home page for the composite. -
In the Component column, click a specific Decision Service component to access its home page.
-
In the Composite column, click a specific SOA composite application to access its home page.
-
In the Logs column, click a specific log to access the Log Messages page with filtered messages specific to that instance.
For more information, see Section 1.2.4, "Understanding Service Components and Service Component Instances"
19.4 Monitoring Business Rules Service Engine Faults
Using the Business Rules Engine home page Faults tab, you can monitor all Decision Service component faults. The Faults tab shows this information for Decision Service components that can be part of separate SOA composite applications. Decision Service Components are also called Business Rules components in the Oracle Fusion Middleware documentation.
Note:
Decision Service component faults are always nonrecoverable.-
Access the Business Rules Engine Faults tab through one of the following options:
From the SOA Infrastructure Menu... From the SOA Folder in the Navigator... Select Service Engines > Business Rules. - Right-click soa-infra.
-
Select Service Engines > Business Rules.
-
Click Faults.
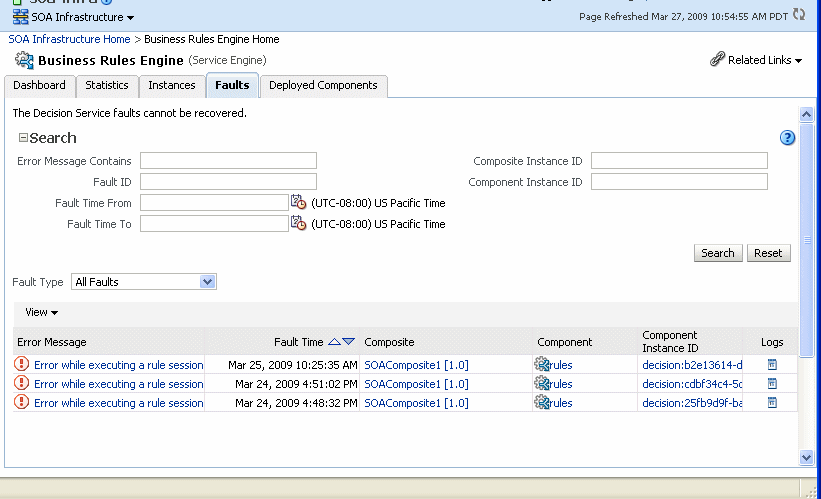
The Faults tab displays the following:
-
A utility for searching for a specific fault by specifying criteria and clicking Search. Click the Help icon for details.
-
Faults that occurred in the Decision Service component, including the error message, the time at which the fault occurred, the SOA composite application and Decision Service component in which the fault occurred, and the Decision Service component instance ID.
Decision Service component instance faults cannot be recovered.
Description of the illustration rules1_engine_faults.gif
-
-
You can perform the following monitoring tasks from within the Faults tab:
-
From the Fault Type list, select to display All Faults, system faults, business faults, or Oracle Web Services Manager faults in the Faults tab.
-
From the View list, select Columns > Fault ID to display the fault IDs for each fault. The fault ID is automatically generated and uniquely identifies a fault. The fault ID is also displayed when you click an error message.
-
In the Component column, click a specific Decision Service component to access its home page.
-
In the Component Instance ID column, click a specific Decision Service component instance ID to view the audit trail.
Note:
The contents of the audit trail page depends on the Audit Level settings. When the Audit Level property is set to Production, the audit trail shows only the activity names. When the Audit Level is in Development mode, the audit trail shows the Decision Service instance payload details. You can change the Audit Level on the SOA Administration Common Properties page. Additionally, this option can be set for a specific composite from the home page for the composite. -
In the Logs column, click a specific log to access the Log Messages page with filtered messages specific to the instance. Clicking the log link shows the faults and error messages related to that faulted instance.
-
-
In the Error Message column, click to view the fault details.
For more information, see Section 1.2.4, "Understanding Service Components and Service Component Instances".
19.5 Monitoring Business Rules Service Engine Deployed Components
Using the Business Rules Engine home page Deployed Components tab, you can monitor all Decision Service components deployed across SOA composite applications. Decision Service Components are also called Business Rules components in the Oracle Fusion Middleware documentation.
-
Access the Business Rules Engine Deployed Components tab through one of the following options:
From the SOA Infrastructure Menu... From the SOA Folder in the Navigator... Select Service Engines > Business Rules. - Right-click soa-infra.
-
Select Service Engines > Business Rules.
-
Click Deployed Components.
The Deployed Components tab displays the following:
-
A utility for searching for a specific component by specifying criteria and clicking Search.
-
Components, including the name, the SOA composite application name, the status (Up or Down), and the instances count (total, running, and faulted).
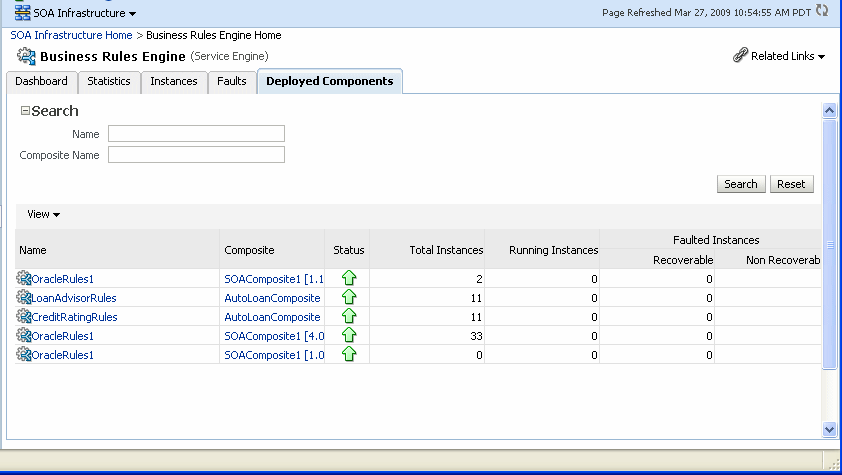
Description of the illustration rules1_engine_deploy.gif
-
-
In the Name column, click a name to navigate to the Component home page and view component details.
-
In the Composite column, click a specific SOA composite application to access its home page.
For more information, see Section 1.2.4, "Understanding Service Components and Service Component Instances".
19.6 Monitoring Decision Service Component Instances from a Composite Application
You can monitor Decision Service component instances from a composite application. Each Decision Service component instance has its own unique instance ID. This ID is in addition to the instance ID of the overall SOA composite application of which this Decision Service component is a part. Decision Service Components are also called Business Rules components in the Oracle Fusion Middleware documentation.
Note:
To see the state with the correct information, you must set the Capture Composite Instance State option. You can change this setting on the SOA Administration Common Properties page. Turning this feature on allows for separate tracking for "running" instances. However, this may impact the performance. For information on setting the option, see Section 3.1, "Configuring SOA Infrastructure Properties".-
Access a Decision Service component from a composite application through one of the following options:
From the SOA Infrastructure Menu... From the SOA Folder in the Navigator... - In the navigator, select soa-infra.
-
From the SOA Infrastructure menu, Select Home.
-
Click Deployed Composites tab.
-
In the Composite table select a specific SOA composite application that includes a Decision Service component.
- Expand soa-infra.
-
Select a specific SOA composite application that includes a Decision Service component.
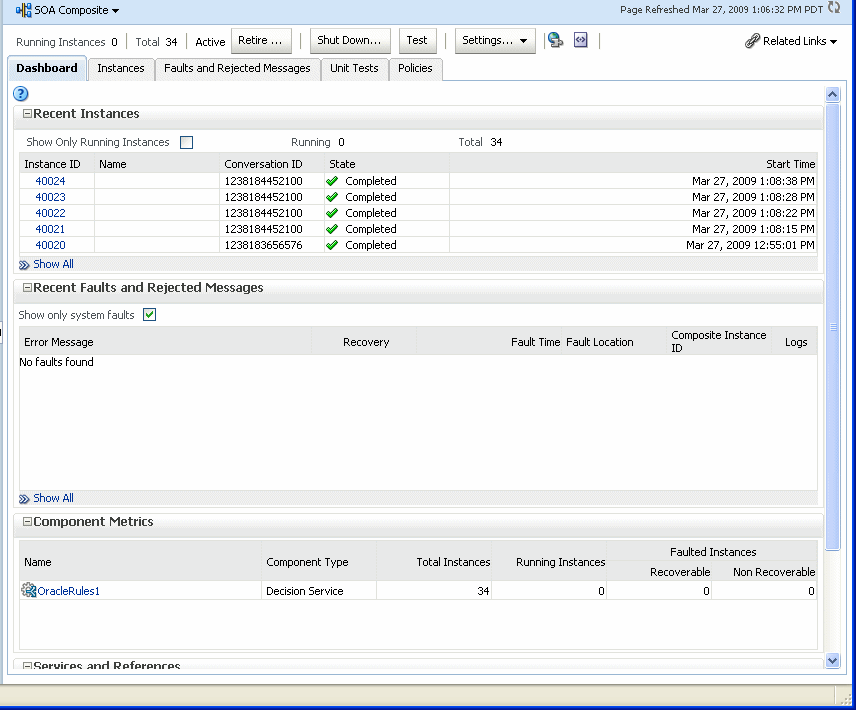
Description of the illustration rules1_dashboard.gif
-
The Component Metrics table on the composite dashboard provides a high-level overview of each Decision Service component. This table includes columns showing the Component Type, the Total Instances, the Running Instances, and the Faulted Instances (recoverable and nonrecoverable).
-
Select a Decision Service component in the Component Metrics section to display the corresponding Decision Service Component page.
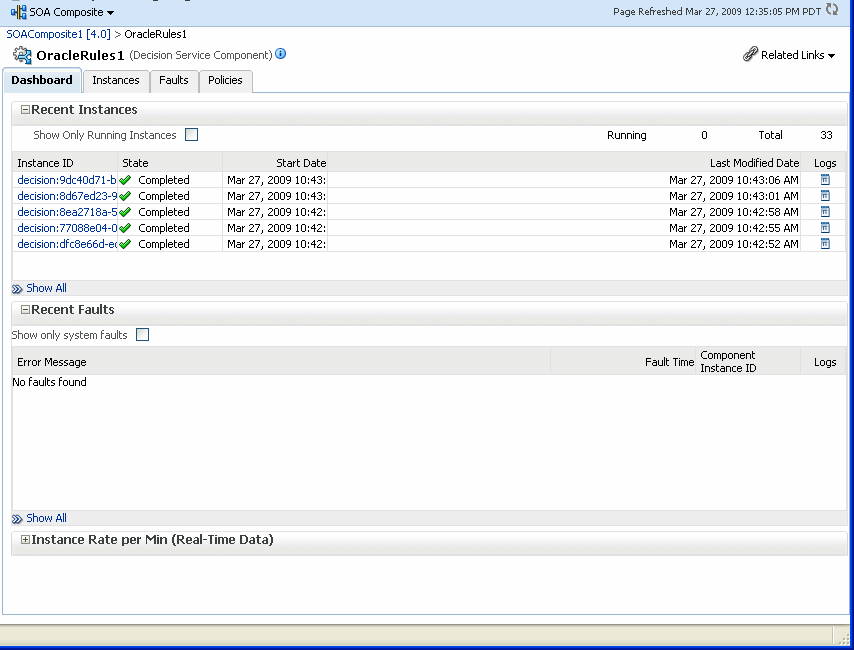
Description of the illustration rules1_comp_dash.gif
For more information, see Section 1.2.3, "Understanding SOA Composite Application Instances".
19.7 Monitoring Decision Service Component Logs
You can monitor Decision Service component logs. Decision Service Components are also called Business Rules components in the Oracle Fusion Middleware documentation.
19.7.1 Viewing Decision Service Component Logs
To view the logs select soa-infra and right-click. In the navigation tree select Logs and click View Log Messages. This displays the Log Messages page.
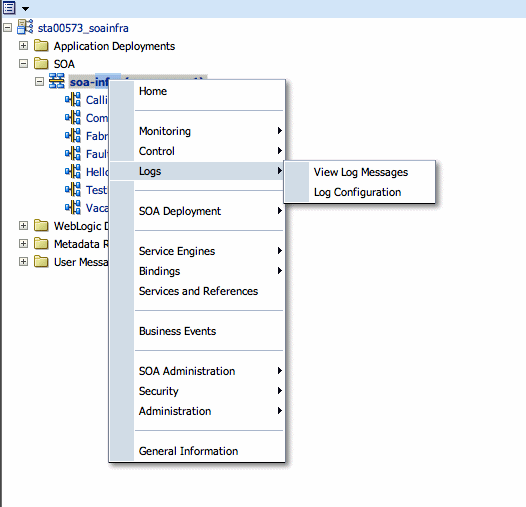
Description of the illustration rules1_logs1.gif
The Log Messages page opens. Use this page to select target log files.
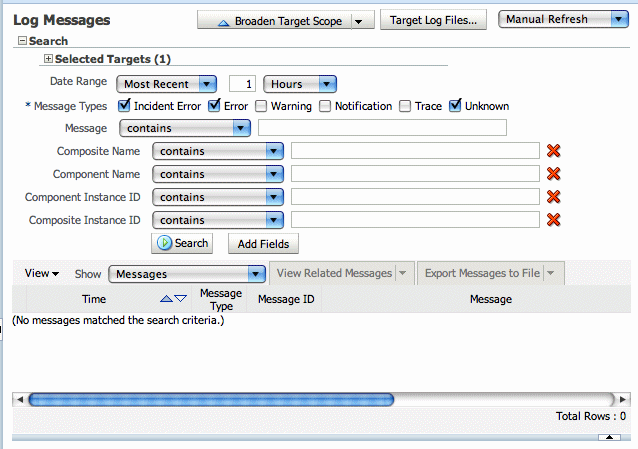
Description of the illustration rules1_logs2.gif
To access a pre-filtered list of log files for each instance or fault, click in the Logs column from any specific page (for example in the Decision Service engine or component's Faults or Instances tables).
For example, from the Faults table, click the Logs column.

Description of the illustration rules1_engine_faults.gif
19.7.2 Setting the Diagnostic Logging Level with Log Configuration
Use the Log Configuration page to configure the logging level. To open the Log Configuration page, right-click soa-infra and select Logs >Log Configuration.
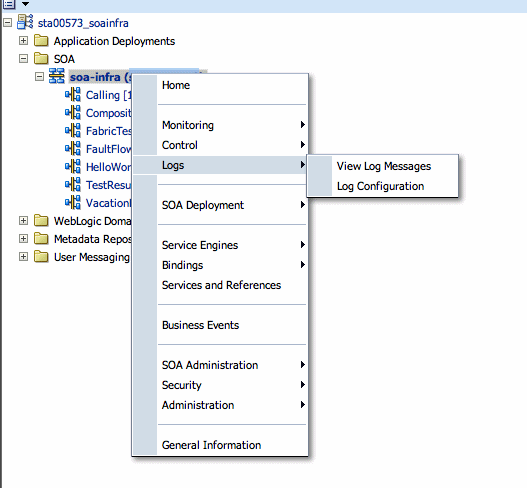
Description of the illustration rules1_logs3.gif
To configure the Decision Service component logging level, expand the oracle.soa.service.rules and the oracle.soa.services.rules.obrtrace loggers and set the notification level.
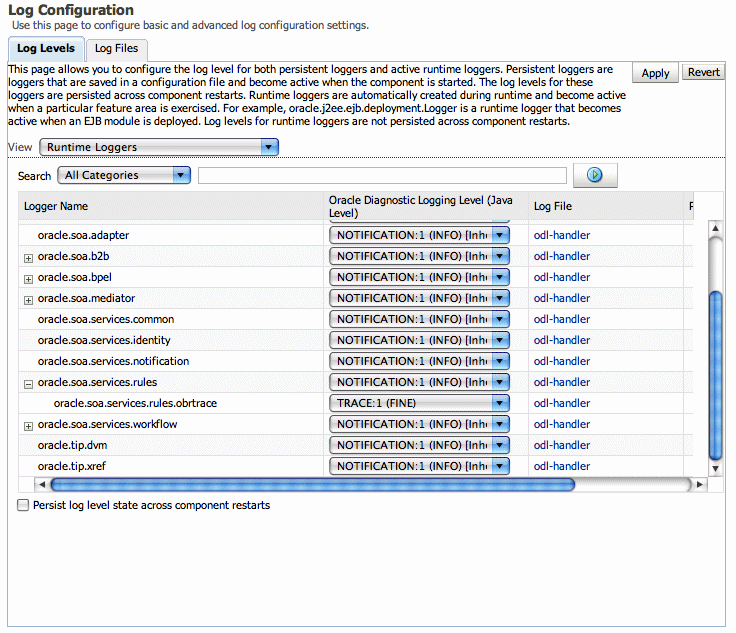
Description of the illustration rules1_logs4.gif