20 Monitoring Performance by Using Fusion Middleware Control
This chapter describes how to monitor Oracle Adaptive Access Manager 11g performance and shut down and start Oracle Adaptive Access Manager instances using Fusion Middleware Control.
20.1 Displaying Fusion Middleware Control
Fusion Middleware Control organizes a wide variety of performance data and administrative functions into distinct, Web-based home pages. The Fusion Middleware Control home pages make it easy to locate the most important monitoring data functions from a Web browser.
To display Fusion Middleware Control:
-
Enter the Fusion Middleware Control URL, which includes the name of the host and the administration port number assigned during the installation. The following shows the format of the URL:
http://hostname.domain:port/em
-
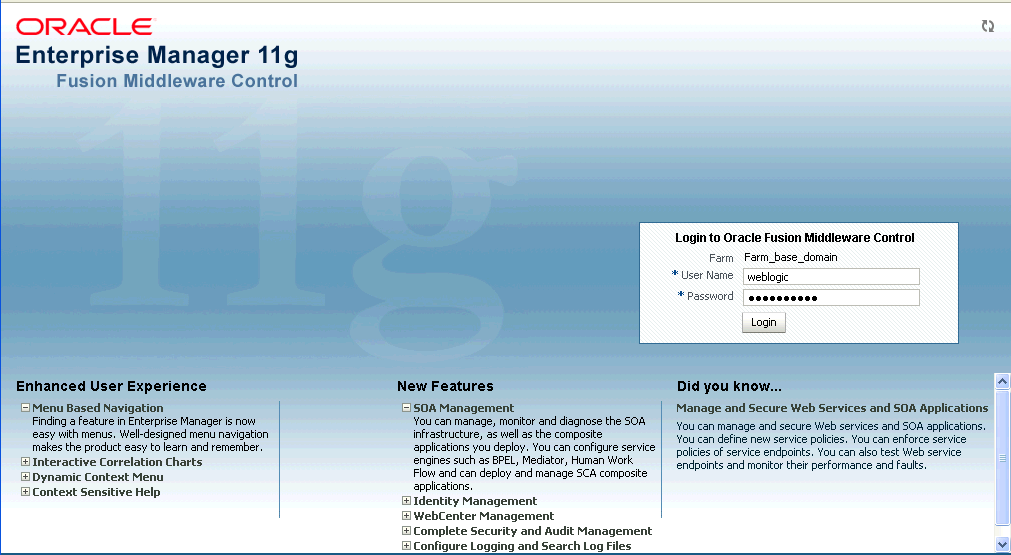
Enter the Oracle Fusion Middleware administrator user name and password and click Login.
The default user name for the administrator user is
weblogic. This is the account you can use to log in to Fusion Middleware Control for the first time. The password is the one you supplied during the installation of Oracle Fusion Middleware.
The Fusion Middleware Control Login is shown in Figure 20-1.
20.2 Displaying Base Domain 11g Farm Page
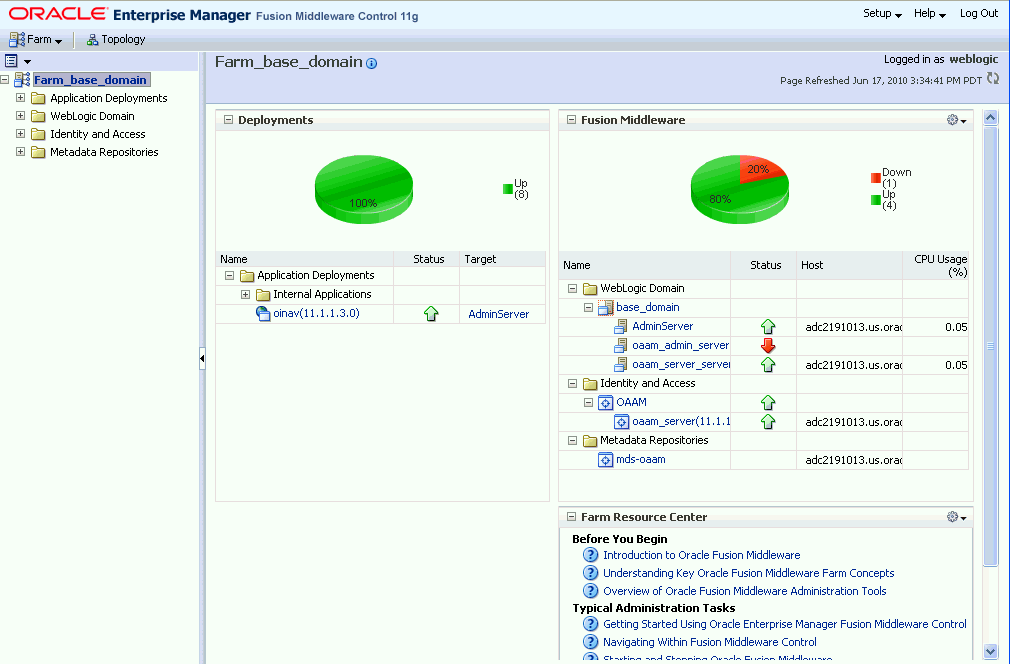
When you first log in to Fusion Middleware Control, the Base Domain home page is displayed.
Fusion Middleware Control displays the target navigation pane on the left and the content pane on the right.
The farm home page is shown in Figure 20-2
The content pane displays the overall status of the Oracle Fusion Middleware environment and links to reference information.
From here, you can view
-
The status and target of the internal applications in the deployment.
-
The status, host, and CPU usage of the repository and server instances.
-
Resource information on concepts and tasks
The target navigation pane lists all of the targets in the farm in a navigation tree.
Oracle Adaptive Access Manager details in Fusion Middleware Control are divided into the following nodes within the navigation pane:
-
Application Deployments
-
WebLogic Domain
-
Identity and Access
-
Metadata Repositories
When you select a target, such as a Managed Server or a component, the target's home page is displayed in the content pane and that target's menu is displayed at the top of the page, in the context pane. For example, if you select a Managed Server, the WebLogic Server menu is displayed. You can also view the menu for a target by right-clicking the target in the navigation pane.
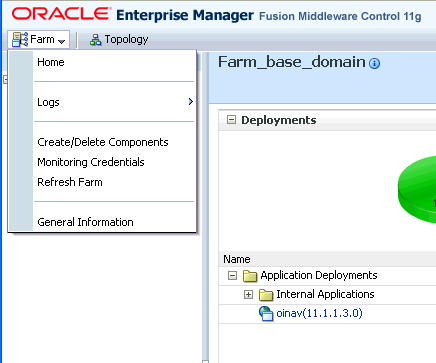
Farm Menu in the upper left corner of the target navigation pane provides a list of operations that you can perform on the farm.
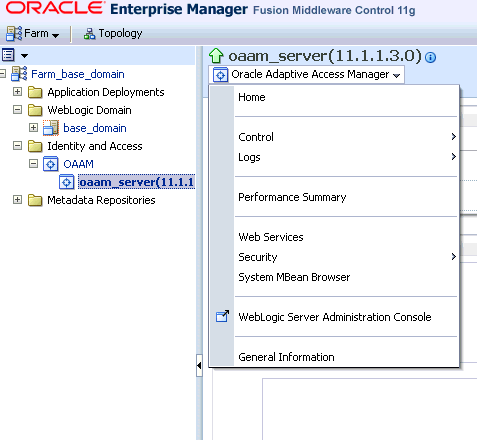
Dynamic Target Menu provides a list of operations that you can perform on the currently selected target. The menu that is displayed depends on the target you select. The menu for a specific target contains the same operations as those in the Right-Click Target Menu.
20.3 Oracle Adaptive Access Manager Cluster Home Page
To access the Oracle Adaptive Access Manager Cluster Home page:
-
Log in to Fusion Middleware Control.
-
Expand the Identity and Access node.
-
Click the OAAM (cluster) node.
The Oracle Adaptive Access Manager Cluster Home page appears. Use this page to monitor the OAAM cluster.
From the Oracle Access Manager Cluster Home page, you can:
-
Monitor the OAAM cluster
-
View the status of the OAAM servers that are part of the OAAM cluster
-
View details of the database used by Oracle Adaptive Access Manager
-
Access general information about the OAAM cluster such as the name, version, Oracle Home, and domain home
-
Access the performance summary of the server instances in the cluster
Monitor the Oracle Adaptive Access Manager cluster
The Performance Overview section of the Oracle Adaptive Access Manager Cluster Home page shows a graphical representation and a table view of the login statistics.
The data shown are for:
-
Number of successful logins during the last 5 minute collection interval
-
Number of logins failed during the last 5 minute collection interval
In the graphical representation, the x axis shows the time and the y axis shows the number of logins.
The performance overview is also available in tabular format when you click the Table View link at the bottom of the graph.
View the status of the servers that are part of the Oracle Adaptive Access Manager cluster
The Deployment section of the Oracle Adaptive Access Manager Cluster Home page provides information on the statuses of the OAAM server instances.
You can view the following information:
| Fields | Description |
|---|---|
| Instance Name | The name of the OAAM server instance. For example: oaam_server. |
| Status | The status of the OAAM server instance:
|
| Total Logins | The total number of logins attempted since startup. |
| Logins Successful | The total number of successful logins since startup |
| Logins Failed | The total number of failed logins since startup. |
View details of the database used by Oracle Adaptive Access Manager
To view hostname, port, and service ID of the data repository, refer to the Data Store section. Oracle Adaptive Access Manager uses the RDBMS database as its data store.
| Fields | Description |
|---|---|
| Hostname | The name of the server where the data store is located. |
| Port | The port on which the Listener is listening for Oracle connections |
| Service ID | The name of the database that Oracle Adaptive Access Manager is using. |
Access general information about the Oracle Adaptive Access Manager
From the Oracle Adaptive Access Manager Cluster Home page, you can access general information about the cluster and the datasource.
To view the target name, version, Oracle Home, and Domain home:
-
Click Oracle Adaptive Access Manager Cluster at the top of the home page to expand the dynamic menu.
-
Select General Information.
Access the Performance Summary for the Oracle Adaptive Access Manager Cluster
To see a performance summary for insight into the current performance of the Oracle Adaptive Access Manager cluster:
-
Click Oracle Adaptive Access Manager Cluster at the top of the home page to expand the dynamic menu.
-
Click Performance Summary.
20.4 Oracle Adaptive Access Manager Server Home Page
The Oracle Adaptive Access Manager Server Home page displays a performance overview of the instance.
To access an Oracle Adaptive Access Manager Server Home page:
-
Log in to Fusion Middleware Control.
-
Expand the Identity and Access node.
-
Expand the OAAM (cluster) node.
-
Click an OAAM server node.
The Oracle Adaptive Access Manager Server Home page appears. From this page, you can:
-
View statistic summary for the OAAM server instance
-
View performance overview (graphical representation and table)
-
Access a List of Operations to perform
View statistic summary for the Oracle Adaptive Access Manager server instance
The OAAM Server Home Page displays a Performance Overview with key metrics.
From this page, you can view a statistic summary for the OAAM Server instance that was selected.
| Metric | Description |
|---|---|
| Logins - Logins Successful | Total number of successful logins since startup. |
| Logins - Logins Failed | Total number of login attempts that failed since startup. |
| Checkpoint - Average Processing Time | Average time (in ms) for all the policies in a checkpoint to process since startup. |
| Checkpoint - Number of Checkpoints Processed | Total number of checkpoints processed since startup. |
| Policies - Average Policy Processing Time | Average time (in ms) to process a policy |
| Policies - Number of Polices Processed | Total number of policies processed since startup |
View performance overview of the Oracle Adaptive Access Manager server instance
The Performance Overview section of the OAAM Server Home page provides a graphic representations of logins to the OAAM server instance. You can also open a table view of logins from this section.
-
Graphical
The x axis shows the time.
The y axis shows the number of logins, checkpoints, or policies processed.
-
Table
Click Table View to show the Performance Overview in tabular format.
Access the list of operations to perform on the Oracle Adaptive Access Manager server instance
The Oracle Adaptive Access Manager menu, which is available when you click Oracle Adaptive Access Manager at the top of the page, provides a list of server instance-related operations. This menu contains the same operations as those in the context menu.
| Menu Item | Operation |
|---|---|
| Home | Allows you to view the instance home page |
| Control | Allows you to start up and shut down the server instance
From the menu, click Control and select Startup or Shutdown. |
| Logs | Allows you to view server logs and configure logging
From the menu, click Logs and select View Log Messages or Log Configurations. |
| Performance Summary | Allows you to view a performance summary
From the menu, click Performance Summary. The categories for the summary metrics are:
|
| Web Services | Allows you to view web services
From the menu, click Web Services. |
| Security | Allows you to view OAAM Server application policies and roles
From the menu, click Security and select Application Policies or Application Roles. |
| System MBean Browser | Allows you to access the System MBean Browser
From the menu, click System MBean Browser. |
| WebLogic Server Administration Console | Allows you to access the WebLogic Server Administration Console
From the menu, click WebLogic Server Administration Console. |
| General Information | Allows you to view general information about the server instance
From the menu, click General Information. |


