| Oracle® Real User Experience Insight User's Guide Release 5.1 for Linux x86-64 Part Number E14821-03 |
|
|
View PDF |
| Oracle® Real User Experience Insight User's Guide Release 5.1 for Linux x86-64 Part Number E14821-03 |
|
|
View PDF |
This appendix highlights the most common problems encountered when using RUEI, and offers solutions to locate and correct them. The information in this appendix should be reviewed before contacting Customer Support.
Information on a wide variety of topics is available via the RUEI Web site (http://www.oracle.com/enterprise_manager/user-experience-management.html). It is recommended that you visit it regularly for support announcements.
In addition, detailed technical information is available via the Customer Support Web site (https://metalink.oracle.com). This includes information about service pack availability, FAQs, training material, tips and tricks, and the latest version of the product documentation.
If you experience problems with the use or operation of RUEI, you can contact Customer Support. However, before doing so, it is strongly recommended that you create a Helpdesk report file of your configuration. To do so, select System, Configuration, and then Helpdesk report. This file contains extended system information that is extremely useful to Customer Support when handling any issues that you report.
If you are experiencing problems with the Reporter module, or find its interface unstable, it is recommended that you do the following:
Clear all caching within your browser, and re-start your browser.
Examine the error log. This is described in Section 9.10, "Working with the Error Log".
Reboot the system on which the Reporter is installed.
If RUEI does not seem to start, or does not listen to the correct ports, do the following:
Review your network filter definitions. This is described in Section 8.2, "Defining Network Filters". In particular, ensure that no usual network filters have been applied. This is particularly important in the case of VLANs.
Ensure that RUEI is listening to the correct protocols and ports. This is described in Section 8.1, "Managing the Scope of Monitoring".
It is important to understand that there is a delay associated with the reporting of all monitored traffic. For information shown in the dashboard (so-called real-time data), this delay is 5 minutes. For most other data views (that is, session-based data), this delay is 15 minutes. However, there are two exceptions to this: the all page and the failed URL views. Both of these have delays of 5 minutes. It is important to understand the difference between real-time and session-based data when faced with small differences in what they are reporting. These are fully explained in Section 3.2.1, "Real-Time and Session-Based Data".
If you are experiencing problems with your SNMP alerts (for example, they are not reaching the required users), it is recommended that you do the following:
Review thoroughly your SNMP notification settings. In particular, ensure that the manager address is correct, you have downloaded and implemented the required MIB definition, and that SNMP notification has been enabled. This is described in Section 9.4, "Configuring System Failure Alerts."
Check that you have downloaded and installed the latest version of the MIB file.
Check network connections as a receiver.
Check the configuration of your SNMP manager.
In addition, be aware that KPI names in SNMP alerts are specified in UTF-8, and not all SNMP managers fully support UTF-8. For further information, please review to your SNMP manager product documentation.
If you are experiencing problems with your text message alerts, it is recommended that you do the following:
Review thoroughly your text message notification settings. This is described in Section 5.5.7, "Using Text Message Notifications" and Section 9.4, "Configuring System Failure Alerts".
Contact your text message provider for information about any reported issues.
Check that your modem is functioning correctly.
If you are experiencing problems with reported times within the Reporter, you should ensure the required time zone is explicitly set in the [Date] section of the /etc/php.ini file. This is fully explained in the Oracle Real User Experience Insight Installation Guide. In addition, you should re-start the Apache Web server (logged on as root) with the following command:
httpd -k restart
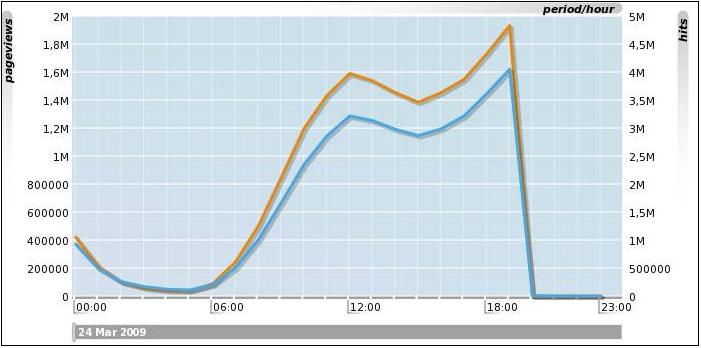
When monitoring very high levels of traffic, it can appear from the reported data that RUEI is no longer monitoring network traffic or it is delayed. An example of this is shown in Figure C-1.
Figure C-1 Drop in Reported Network Traffic

This report appears to show that network traffic stopped being monitored at 19:00. In fact, this situation is the result of an overloaded RUEI system. While traffic continues to be monitored, the generated Collector log files cannot be processed due to extremely high traffic levels and insufficient resources.
This can be confirmed by selecting System, then Maintenance, then Data processing, and then click the Performance tab. If the reported system load is approaching 100%, then the system is becoming overloaded. The use of this facility is fully described in Section 9.7, "Viewing a Traffic Summary".
As a safeguard against permanently overloaded systems, RUEI automatically stops processing all Collector log files for the previous day approximately 30 minutes after midnight. This enables any backlog to be discarded, and for RUEI to return normal processing levels.
If the situation shown in Figure C-1 persists, it is strongly recommended that you use network filters to limit the level of monitored traffic. This is fully explained in Section 8.2.2, "Limiting Overall Traffic". You might also consider assigning more resources to the RUEI system.