39.2 New Features and Benefits
Oracle Reports provides a convenient way for you to add a wide variety of graphs to both paper-based and JSP-based Web Reports.
Oracle Reports 11g Release 1 (11.1.1) supports the following features:
-
Scalable Vector Graphics (SVG) image support
-
Plotting Irregular time periods. For more information, see Plotting Irregular Time Periods.
-
New Chart Style in Graph Wizard. For more information, see New Chart Styles.
-
Number formatting support in Graph Wizard
With the new graph types and features, Reports Builder provides the following benefits:
-
More graph types for the varied usage
-
Better graph image output without loosing resolution
-
Plot time data without restrictions
-
Format the numbers in the graph independent of the data model
Plotting Irregular Time Periods
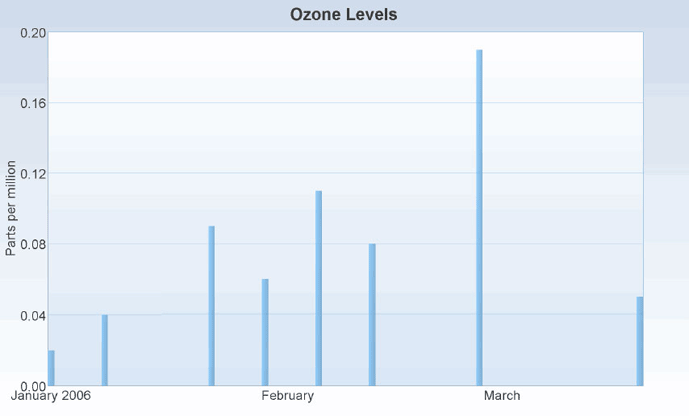
Oracle Reports 11g Release 1 (11.1.1) provides support for plotting irregular time periods on time axis. For more information see Figure 39-1, "Plotting Irregular Time Period".
Figure 39-1 Plotting Irregular Time Period

Description of "Figure 39-1 Plotting Irregular Time Period"
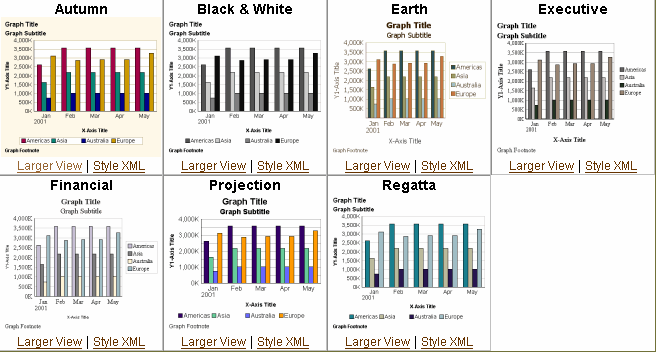
Oracle Reports 11g Release 1 (11.1.1) supports the following new chart styles:
-
Autumn
-
Black and White
-
Earth
-
Executive
-
Financial
-
Projection
-
Regatta
For more information, see Figure 39-2, "New Chart Styles".
