25.6 Add Zeroes in Place of Blanks
A matrix report displays a juxtaposition of data – in other words, the values held in common by two different categories of data. These categories are indicated by the row and column labels.
The matrix displays this juxtaposition of values using a grid-like format. If the two categories have nothing in common, the grid at that point is empty. The matrix appears to be full of "holes". You can fill the holes using boilerplate text.
Note:
Do not confuse empty spaces in the grid with null values. A null value is an actual value fetched from the database. The spaces in a matrix report are empty because nothing has been fetched to fill them.To replace blanks with zeroes:
-
Open the matrix report to which you previously added the summaries.
-
In the Object Navigator, double-click the view icon next to the Paper Layout node to display the Paper Layout view.
Tip:
The steps that follow require some precision in the placement of objects. Hence, you may want to magnify the view to make the process easier. Click the Magnify tool and then click somewhere in the Paper Layout view. Repeat as many times as necessary. -
In the Paper Layout view, click the Confine On and Flex On buttons in the toolbar to turn both modes on.
-
From the font lists in the toolbar, choose Arial (Western), point size 10.
-
Click the Align Right button in the toolbar.
-
Click the Text tool in the tool palette.
-
Click the top of the F_SUM_SAL field about 0.75 inches (2 centimeters) from its right edge. Your objective is to create an object right on top of F_SUM_SAL.
-
Type the following:
$0.00
-
Click in an open area of the layout to deselect all objects.
-
In the Object Navigator, type
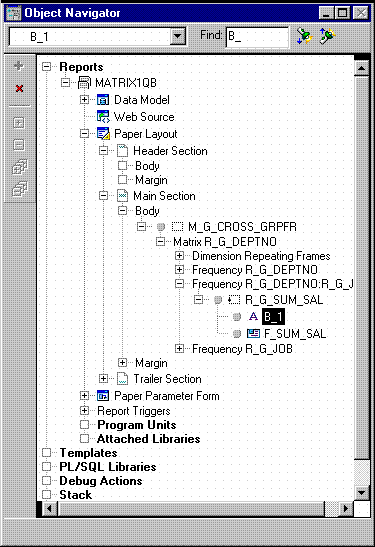
B_1in the Find field. You will be taken to the object you just created. If you are viewing the Object Navigator in Ownership View (View > Change View > Ownership View), you should see B_1 underneath R_G_SUM_SAL and on the same level as F_SUM_SAL.Tip:
If B_1 does not appear underneath R_G_SUM_SAL, return to the Paper Layout view, delete B_1 and try again.Figure 25-10 Object Navigator with new object selected

Description of "Figure 25-10 Object Navigator with new object selected"
-
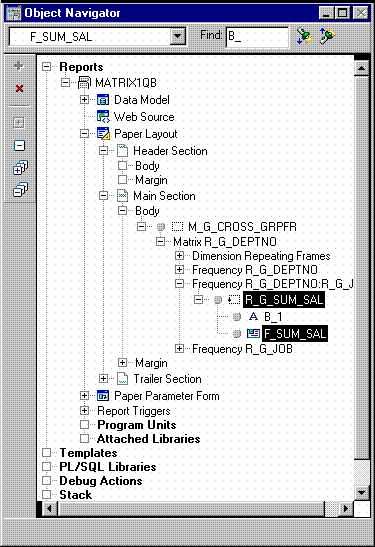
Click R_G_SUM_SAL and then ctrl-click F_SUM_SAL so that they are both selected and B_1 is deselected.
Figure 25-11 Object Navigator with repeating frame and field selected

Description of "Figure 25-11 Object Navigator with repeating frame and field selected"
-
Click the title bar of the Report Editor to make it the active window.
-
Click the Confine Off button in the toolbar to turn Confine mode off.
-
Choose Layout > Move Forward.
Tip:
After this operation, B_1 should appear just above R_G_SUM_SAL, as a peer rather than a child of R_G_SUM_SAL. If B_1 is still appearing as a child under R_G_SUM_SAL, repeat steps 11 through 14 until it is no longer appearing as a child of R_G_SUM_SAL. -
In the Paper Layout view, click the Confine On button in the toolbar to turn Confine mode back on again.
-
Click the Paper Design button in the toolbar to display the Paper Design view.
Tip:
If the $0.00 is not quite aligning with the other monetary values around it, select it and use the arrow keys to move it to the desired location.Figure 25-12 Matrix report output with zeroes replacing blanks

Description of "Figure 25-12 Matrix report output with zeroes replacing blanks"