| Oracle® Fusion Middleware Administrator's Guide for Oracle SOA Suite and Oracle Business Process Management Suite 11g Release 1 (11.1.1.5.0) Part Number E10226-09 |
|
|
View PDF |
| Oracle® Fusion Middleware Administrator's Guide for Oracle SOA Suite and Oracle Business Process Management Suite 11g Release 1 (11.1.1.5.0) Part Number E10226-09 |
|
|
View PDF |
This chapter describes how to view Oracle Business Activity Monitoring (Oracle BAM) performance statistics and logs using Oracle Enterprise Manager Fusion Middleware Control.
This chapter includes the following topics:
You can monitor several aspects of the Oracle BAM components using Oracle Enterprise Manager Fusion Middleware Control.
The OracleBamServer page in Fusion Middleware Control enables you to monitor each of the Oracle BAM Server Components: Active Data Cache, Event Engine, Report Cache, and Enterprise Message Sources. See Section 23.2, "Monitoring Oracle BAM Server Components" for more information.
The OracleBamWeb page in Fusion Middleware Control enables you to monitor Oracle BAM Report Server. See Section 23.3, "Monitoring Oracle BAM Web Applications" for more information.
In addition, the Performance Summary pages for each component allow you to track specific statistics of your choosing. See Section 23.5, "Monitoring Oracle BAM Performance" for more information.
Also, you can configure and monitor Oracle BAM logs using Fusion Middleware Control. See Section 23.6, "Monitoring Oracle BAM Logs" for more information.
Oracle BAM Server components are monitored on the Fusion Middleware Control page for Oracle BAM Server.
To monitor Oracle BAM Server components:
Go to the Oracle BAM Server home page by selecting BAM > OracleBamServer in the navigation tree.
In the OracleBamServer page, you can select each tab (Active Data Cache, Event Engine, Report Cache, Enterprise Message Sources) to monitor the individual Oracle BAM Server components.
Note:
Alternatively, on the farm home page, you can also select the Oracle BAM targets from the right side page content area, where it displays details of the farm.Oracle BAM Active Data Cache (Oracle BAM ADC) is designed and optimized to handle large amounts of data in real time. Data coming into Oracle BAM ADC immediately updates all defined calculations and aggregates in real time in an in-memory cache so that this data can be pushed as quickly as possible to Oracle BAM dashboards and reports. Data fed to the Oracle BAM ADC is received from a combination of sources, from Java Message Service (JMS) topics and queues to more traditional data queries and databases. Oracle BAM ADC ensures that no matter the source, when Oracle BAM Server is aware of the incoming data, it is streamed to Oracle BAM alerts and dashboards as incremental changes.
There are two key components to the Oracle BAM ADC, data sets and view sets. Oracle BAM ADC receives transactions (insert, update, upsert, delete) into the data sets. These data sets are constructed based on the design that an Oracle BAM developer defines for data relationships when data objects are defined in Oracle BAM Architect. Data objects can be reflective of flat tables of data, or more complex, star-schema relationships between data objects, which are represented in Oracle BAM as data object look-ups.
After data is updated in the data sets, view sets that are listening on these data sets go into action. The view sets have knowledge of all of the open Oracle BAM dashboards and alerts that users are viewing in the Oracle BAM system. View sets ensure that data updates to these open objects are incrementally updated first, using a push-based mechanism to publish updates to open dashboards and alerts, providing users with the latest information.
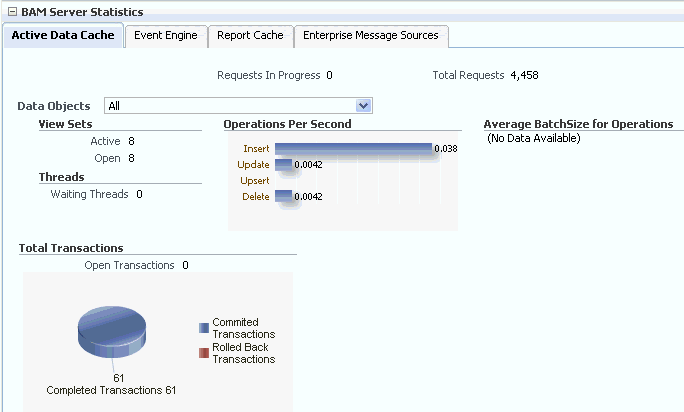
Use the Oracle BAM pages in Fusion Middleware Control to monitor statistics for all data objects in Oracle BAM ADC as a group, or select a particular data object from the Data Objects list to monitor.
Note:
When you select a data object from the list, cached data is displayed to preserve performance. You must refresh the page (using the Refresh icon) to display the latest data associated with the selected data object.View Sets
Active view sets are those which are typically seen in Oracle BAM reports. Open view sets are the sum of active and static open view sets.
Oracle BAM reports and alerts use active view sets. Oracle BAM Server uses static view sets for internal process. There are also internal parts of the code that use static view sets on system objects (metadata tables). It is possible that if Oracle BAM Server is not closing the static view sets, you observe different values for them.
Static view sets do not support active data generation and are used to fetch data from data objects, therefore, they are kept open for only a very short time when data is fetched. For that reason, in the Open counter, the values appearing most of the time are from active view sets.
View Set Count Variation
You can monitor the view set count for Oracle BAM components Active Data Cache, Report Cache, and Report Server. You may see that view set counts do not match between Active Data Cache, Report Cache, and Report Server metrics.
The Report Server opens view sets through the Report Cache for all of the views contained in the reports opened in browsers. The Active Data Cache opens more view sets than the Report Cache. One such view set opened is in the Active Data Cache through the Event Engine.
Whenever the Event Engine starts, it loads all the defined alerts, and for those alerts that are defined to monitor data changes in the Active Data Cache, corresponding view sets are opened in the Active Data Cache. That is why more view sets are displayed in the Active Data Cache monitoring page than on the Report Cache and Report Server pages.
For most of the views in a report, there is a corresponding view set in the Active Data Cache. View sets opened by the report are shared with the subsequent instances of that report, except for Crosstab views. In reports using the Crosstab view, the view set call is different than the one used by other views. When a report containing a Crosstab view is opened, three view sets are opened in the Active Data Cache. Two of the view sets are closed immediately after fetching the data, while one is kept open to monitor the incoming changes.
Operations Per Second
This statistic includes all of the insert, update, upsert, and delete operations occurring on the selected data object. The accompanying graph displays statistics for the last 5 minutes.
Average Batch Size for Operations
This statistic is the average number of records included in each batch operation on the selected data object. The accompanying graph displays statistics for the last 5 minutes.
Waiting Threads
Certain operations must be synchronized, requiring a data object to be locked. This statistic displays the number of threads that are blocked, waiting for the data object to be unlocked in order to perform subsequent operations.
Total Transactions
This statistic displays the number of transactions on Oracle BAM data objects. It is the sum of committed and rolled back transactions. The accompanying graph also displays the number of open and completed transactions.
For example, if you add a row in an Oracle BAM data object and save it (commit), it is one transaction. This metric is useful only if the client of Oracle BAM Server is using transactions.
Transactions can also be used by an EMS, when connecting to a JMS topic or queue.
You can configure this metric to track transactions in the Oracle BAM sensor actions in BPEL and in the Oracle Data Integrator knowledge modules.
In regard to Rolled Back Transactions, if an invalid insert operation is attempted on an Oracle BAM data object, Oracle BAM Server rolls back the transaction.
The Event Engine is used by Oracle BAM Server to evaluate and execute Oracle BAM alerts. The Event Engine monitors complex data conditions and implements specified rules. Rules can include a series of conditions and actions attached to an event. The Event Engine continuously monitors the information in the Active Data Cache for certain conditions and executes the related actions defined in associated rules.
The Event Engine is responsible for tracking events based on date, time, or data changes. The Event Engine design employs a satellite concept, in which there are four different systems (satellites) within which event clauses can be registered and tracked.
The Date and Time satellites are both based on a scheduler, and they are used for time based alerts, for example, "Email a snapshot of this Oracle BAM dashboard to me every morning at 8 a.m."
The Manual satellite is use to manually send alerts by name (using a web service call).
The Data satellite is used to track alerts that are based on specific changes in the data of a given data object, such as "Call this web service when SUM(Sales) > 10000 in the MediaSales data object," or "Let me know when anything in this dashboard changes."
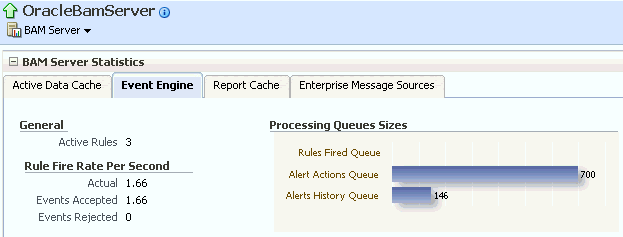
You can monitor statistics for active Event Engine rules, condition met rates, and processing queues.
Active Rules
This statistic displays the number of alert rules that are active (not expired or invalid) in Oracle BAM Event Engine. It displays the total number of alert rules in Oracle BAM Event Engine, which is the sum of alerts created for all of the Oracle BAM users.
Rule Fire Rate Per Second
This group of statistics displays the rates of events over the last 5 minutes for Actual, Events Accepted, and Events Rejected rates.
Actual rule fire rate per second is the number of events fired per second in Event Service. It is the number of events fired per second, taking into account number of times alerts fired events in the previous 5 minutes. For example, if when the OracleBamServer page was loaded, only 2 alerts fired in previous 5 minutes, the value shown would be 2/(5 X 60), that is 0.0067. So, if fired twice in 300 seconds, it would fire 0.0067 times in one second.
Events Accepted is the number of events fired per second from the satellite. That it, the number of events fired per second from alerts configured, that were accepted (for further processing), taking into account events that were accepted in the previous 5 minutes. The value shown is calculated in the same way as Actual. Unless the Event Engine's queue thresholds are exceeded, all events fired are accepted and processed further.
Events Rejected is the number of rejecting events per second. That is, the number of events fired per second from alerts configured, that were rejected (for further processing), taking into account events that were rejected in the previous 5 minutes. The value shown is calculated the same way as Actual. Fired events are rejected when the Event Engine's queue thresholds are exceeded. Ideally this value should be zero.
Processing Queues Sizes
This graph displays the size of the event processing queue, that is, the number of events waiting to be processed. These queues are emptied as soon as the events are processed, so there would have to be a large number of events being generated simultaneously to see alerts waiting for processing in the queues.
The Processing Queues Sizes graph displays statistics for the last 5 minutes. The graph displays Rules Fired Queue, Alert Actions Queue, and Alerts History Queue health.
The Rules Fired Queue displays the number of events that were fired that are waiting to be processed. The Event Engine maintains internal in-memory queue for fired events where all the events are placed temporarily, before being pulled out from here for further processing, as soon as the Event Engine resources are available. This metric shows the number of events fired waiting in queue to be picked by the system.
The Alert Actions Queue displays the number of actions waiting to be processed. The Event Engine maintains internal in-memory queue for actions where all the actions are placed temporarily, before being pulled out from here for further processing, as soon as the Event Engine resources are available. This metric shows the number of actions waiting in queue to be picked by the system.
The Alerts History Queue displays the number of alert history items to be saved. The Event Engine maintains internal in-memory queue for all history items, where all the items are temporarily placed, and before picking them up to save to back end. This metric shows the number of history items waiting in queue to be picked by the system.
The Report Cache assists the Active Data Cache with maintenance of the view set snapshots in memory. The Report Cache opens view sets in the Active Data Cache for the Report Server (an Oracle BAM web applications component). It then caches the snapshot (in small parts) and the active data before sending it to the Report Server. This allows for random access into the snapshot and recovery from losing the connection to Oracle BAM Server. The Report Cache also, along with the Active Data Cache, supports view set sharing.
Active Data Sessions
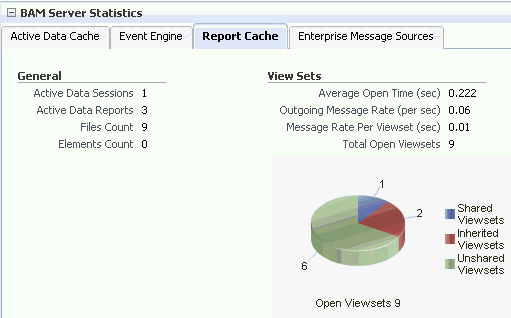
This statistic displays the total number of Report Cache sessions with active data.
When a user opens multiple browser windows on a single computer to view Oracle BAM reports, all of the open browser windows share the same active data session. It does not matter whether the user opens the same report or different reports in each browser window, the Active Data Sessions count is always 1.
Active Data Reports
This statistic displays the total number of open reports requesting active data.
Files Count
This statistic displays the total number of files currently managed by FileBasedPersistenceManager when the Oracle BAM Server is configured to use a file-based persistence manager. See Section 22.3.5, "Configuring Report Cache Persistence Manager" for more information.
Elements Count
This statistic displays the total number of elements currently managed by InMemoryPersistenceManager when the Oracle BAM Server is configured to use a memory-based persistence manager. See Section 22.3.5, "Configuring Report Cache Persistence Manager" for more information.
View Sets
This group of statistics displays the following counters:
Average Open Time (sec) is the average time taken to open a view set.
Outgoing Message Rate (per sec) is the number of change lists delivered per second by Report Cache to all of its clients.
Message Rate Per Viewset (sec) the number of change lists delivered per second per view set.
Total Open Viewsets is the total number of view sets (that is, the sum of shared, unshared, and inherited view sets) maintained in Report Cache for all of the views contained in the reports opened in browsers.
The Open Viewsets graph displays shared, inherited, and unshared view sets.
Shared Viewsets are the parent view sets (these are the view sets that are opened first).
Inherited Viewsets are the child view sets (these view sets are opened later).
Unshared Viewsets (independent view sets) are neither shared or inherited.
View set sharing occurs whenever possible for performance reasons (the consumers require the exact same view sets, so the view sets can be shared). If the view sets cannot be shared, they are unshared.
When users who do not have any differences in row-level security open the same report at close to the same time, the view sets that are created for them in the Active Data Cache are shared in the Report Cache.
Note:
View set counts may not match between Active Data Cache, Report Cache, and Report Server metrics. See "View Set Count Variation" for more information.Enterprise Message Sources (EMS) are used by applications to provide direct Java Message Service (JMS) connectivity to Oracle BAM Server by mapping messages directly to Oracle BAM data objects. Oracle BAM Server can read data directly from any JMS-based message queue or topic. This option offers guaranteed messaging. It is more difficult to configure and not as fast to perform rigorous data transformations in XML Stylesheet Language (XSL) than in an Extract Transform and Load (ETL) tool like Oracle Data Integrator.
The EMS feature does not configure ETL scenarios, but rather maps from a message directly to a data object on Oracle BAM Server; however, you can still use XSL transformations before the data is inserted (updated, upserted, or deleted) into the data object. Each EMS reads from a specific JMS topic or queue, and the information is delivered into a data object in the Active Data Cache. The Oracle BAM Architect web application is used to configure EMS definitions.
For more information about configuring EMS definitions, see Oracle Fusion Middleware Developer's Guide for Oracle SOA Suite.
Note:
Data is displayed in the Enterprise Message Source page only when EMS definitions are created and started in Oracle BAM Architect. Fusion Middleware Control may take some time to fetch the data and display the statistic in the Enterprise Message Source page.Refreshing the page displays the latest EMS data. You can refresh the page using the Refresh icon.
Enterprise Message Sources
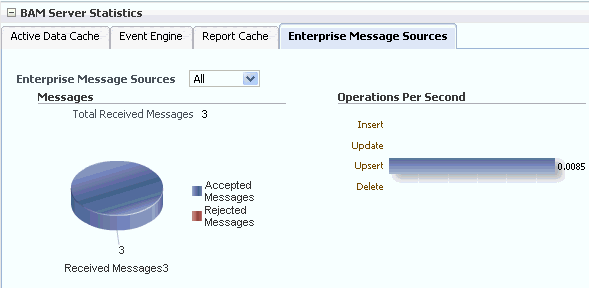
Select the EMS to monitor from the list. You can choose to display aggregated statistics for all EMS definitions, or select a particular EMS to monitor from the list provided.
Messages
Monitor the number of messages received by the selected EMS. You can find rejection statistics in the Performance Summary metrics page.
The accompanying graph displays the number of Received Messages broken down into Accepted Messages and Rejected Messages, and at the top of the graph the number of Total Received Messages is displayed.
Operations Per Second
Monitor the rate of insert, update, upsert, and delete operations performed by the selected EMS.
The Operations Per Second graph displays statistics for last 5 minutes.
For more granular detail about the rates for each type of operation, go to the Performance Summary page. See Section 23.5, "Monitoring Oracle BAM Performance" for more information.
The Oracle BAM Client Requests in Progress chart is displayed in the lower right corner of the Oracle BAM Server home page. Client requests include all of the requests made to the Oracle BAM Server Enterprise Java Beans (EJB).
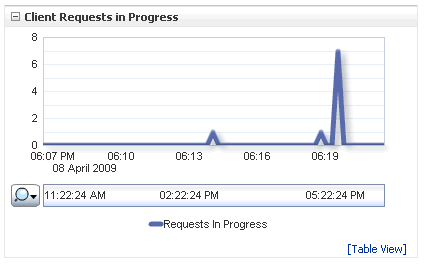
There are a lot of internal requests made when opening a single report (for permissions, the report metadata, the views data, and so on); however, the user may or may not see those internal requests displayed in this chart.
Oracle BAM web applications are monitored in the OracleBAMWeb page of Fusion Middleware Control.
To monitor Oracle BAM Report Server go to the OracleBAMWeb page by selecting BAM > OracleBamWeb in the navigation tree.
Oracle BAM Report Server applies the report definitions to the data sets retrieved from the Oracle BAM ADC for presentation in a browser. It manages information paging for viewing and printing reports. After reports are created, they are stored in the Oracle BAM ADC so that report creation is not repeated each time. Most reporting views are designed to support live, active displays of data changing in real time.
You can monitor statistics for Oracle BAM Report Server connections, view sets, and reports.
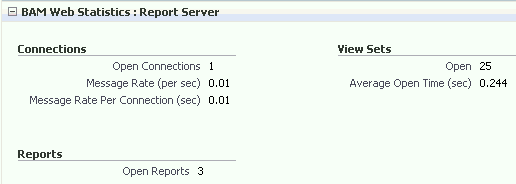
Connections
This group of statistics displays the following:
Open Connections is the number of connections open on the Report Server. An open connection corresponds to each user per session. It is different from the number of reports opened, because one user could at most have one connection open at a time regardless of how many reports the user has opened.
Message Rate (per sec) is the total number of messages (view set change lists) delivered per second to all users (connections).
Message Rate Per Connection (sec) is the number of messages (view set change lists) delivered per second per user (connection).
View Sets
This group of statistics displays the number of open view sets, and the average amount of time (in seconds) that it takes to open the view sets on the server.
Average Open Time (sec) is a measure of the average length of time the server requires to construct the view set and send it to the web browser. This statistic does not take into account the amount of time required to render the HTML and load the Javascript on the client-side web browser.
Note:
View set counts may not match between Active Data Cache, Report Cache, and Report Server metrics. See "View Set Count Variation" for more information.Reports
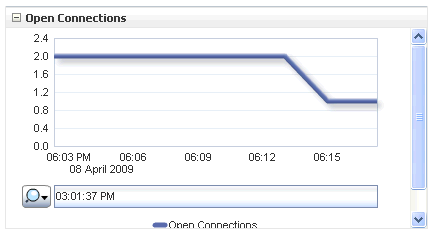
This statistic displays the total number of open reports. The Open Connections graph displays open connections to Oracle BAM web applications. You can use the zoom axis to zoom in on a particular time in which you are interested to see the open connections statistic.
The total number of reports includes the count of duplicate reports opened by the same user. Even if the same report is opened in multiple browser windows, each instance is considered a separate report, because a new view set is opened in Report Server (through Oracle BAM Report Cache) for each report instance, though the view sets are shared.
The Oracle BAM Open Connections chart is displayed in the lower right corner of the Oracle BAM Server home page.
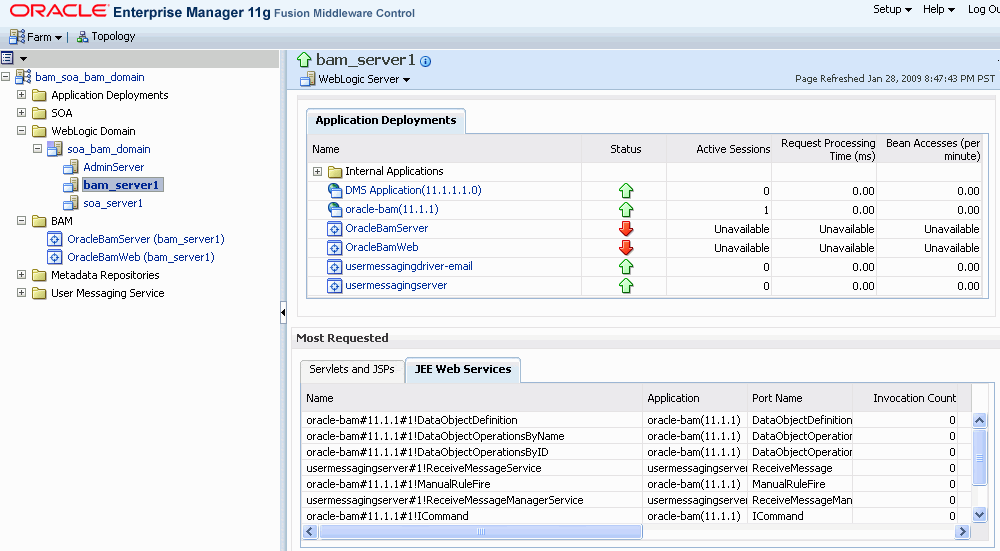
Oracle BAM web services details are not listed in the Oracle BAM pages in Fusion Middleware Control. Oracle BAM web services counters are available by selecting WebLogic Domain > soa_bam_domain > BAM_Server in the navigation tree, and selecting the JEE Web Services tab in the Most Requested region as shown in Figure 23-2.
Oracle BAM provides DataObjectDefinition, DataObjectOperationsByName, DataObjectOperationsByID, DataObjectOperations10131, ManualRuleFire, and ICommand web services. See "Using Oracle BAM Web Services" in Oracle Fusion Middleware Developer's Guide for Oracle SOA Suite
You can see the following statistics in JEE Web Services table: Invocation Count, Response Count, Response Error Count, Average Response Time (ms), Average Execution Time (ms), and Dispatch Time Total.
Figure 23-2 Oracle BAM Web Services Counters
The performance of Oracle BAM applications is reflected in metrics and statistics. There are separate Performance Summary pages with appropriate metrics for Oracle BAM Server and Oracle BAM web applications.
When you select the Monitoring > Performance Summary menu item in each of the Oracle BAM component menus (as shown in Figure 23-3), the Performance Summary page appears as shown in Figure 23-4.
Many metrics are available for capture and display (most of which are also displayed in the Oracle BAM component home pages). Descriptions of each metric are available in the metrics help pages.
To get the most valuable, focused information, use the Metric Palette. Click Show Metric Palette to display the Metric Palette, shown in Figure 23-5.
Choose the metrics in which you are most interested. As you select or deselect metrics from the palette, the metrics graph at the left is updated automatically.
Figure 23-5 Metric Palette for Oracle BAM Web Applications
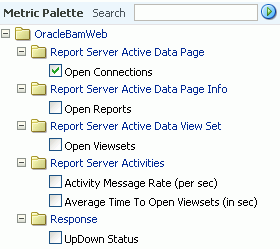
Right-click the metric label and select Help, as shown in Figure 23-6, to find more information about each of the metrics.
Oracle BAM logs are configured and viewed using Fusion Middleware Control.
Note:
Despite having separate log pages for Oracle BAM Server and Oracle BAM web applications, each page displays the logs for all Oracle BAM application components.For information about using the logger features see the online Help page. For information about configuring the logger, see Section 22.4, "Configuring the Logger."
To view the logs, right-click the OracleBamServer node or OracleBamWeb node in the navigation tree and select Logs > View Log Messages as shown in Figure 23-7.
The log viewer page opens as shown in Figure 23-8. Use this page to query for information about the component. Fields and lists are used to customize the query.
After entering your search criteria, click Target Log Files. The Log Files page appears as shown in Figure 23-9. You can view specific log information (shown in Figure 23-10) or download the log.