| Oracle® Fusion Middleware Administrator's Guide for Oracle SOA Suite and Oracle Business Process Management Suite 11g Release 1 (11.1.1.5.0) Part Number E10226-09 |
|
|
View PDF |
| Oracle® Fusion Middleware Administrator's Guide for Oracle SOA Suite and Oracle Business Process Management Suite 11g Release 1 (11.1.1.5.0) Part Number E10226-09 |
|
|
View PDF |
This chapter describes how to monitor instances and faults in SOA composite applications.
This chapter includes the following topic:
For more information, see Section 1.2.2, "Introduction to SOA Composite Applications."
You can monitor SOA composite application recent instances and faults from the SOA composite application Dashboard page. This page provides a high-level overview of the most recent state of the application.
To monitor SOA composite application recent instances and faults:
Access this page through one of the following options:
| From the SOA Infrastructure Menu... | From the SOA Folder in the Navigator... |
|---|---|
|
|
Click Dashboard (if it is not selected).
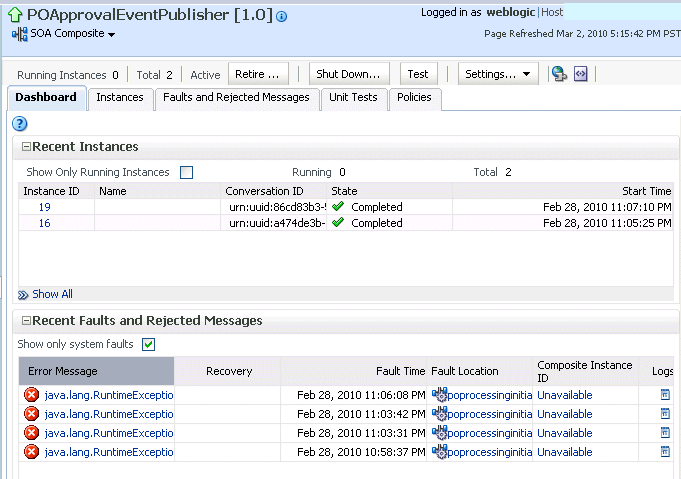
The upper part of the Dashboard page displays the following details:
A summary of composite lifecycle states at the top of the Dashboard page, such as the number of running instances, total instances, and mode of the composite (active or retired).
Recent SOA composite application instances, including the instance ID, name, conversation ID, state (for example, faulted or completed), and start time.
Recent faults and rejected messages, including the error message, whether you can recover from the fault, the time at which the fault occurred, the fault location (service, service component, or reference), the instance ID of the SOA composite application, and a link to log files describing the fault.

In the Recent Instances section, perform the following tasks:
In the Instance ID column, click a specific instance ID to receive all instance details (flow trace and individual component audit trails) about the composite application. This displays the faults in the continuous context of a message flow from instance to instance.
Note:
If you disable the Capture Composite Instance State checkbox, the Recent Instances section does not show instances requiring fault recovery as running. However, these instances in need of recovery are still running and display in the Recoverable column of the Component Metrics section of this page, regardless of whether the instances state is captured or not.Click Show All below the section to access the Instances page of the SOA composite application.
In the Recent Faults and Rejected Messages section, perform the following tasks:
In the Error Message column, click an error message to display complete information about the fault. If the fault is identified as recoverable, click the Recover Now link to perform fault recovery.
In the Recovery column, if a fault is identified as recoverable, click Recover to perform fault recovery at the component instance level.
In the Fault Location column, click a specific location to access the Dashboard page for the service, service component, or reference.
In the Composite Instance ID column, click a composite instance ID to access the flow trace of the message that contains the fault. This displays the faults in the continuous context of a message flow from instance to instance.
In the Logs column, click a specific log to access the Log Messages page filtered for the specific faulted instance.
Click Show All below the section to access the Recent Faults and Rejected Messages page of the SOA composite application.
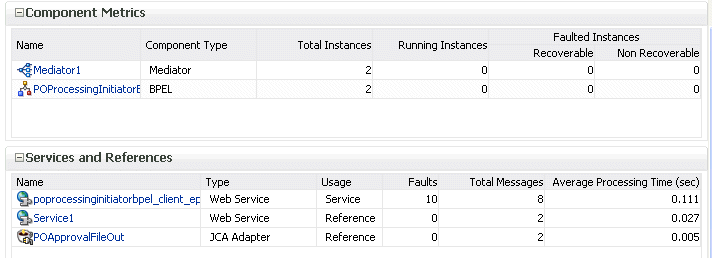
The lower part of the Dashboard page displays the following details:
The name and type of service components used in this SOA composite application, the number of running and total instances, and the number of recoverable and nonrecoverable faulted instances for each service component.
The name and type of service (inbound) and reference (outbound) binding components used in this SOA composite application, the number of binding component faults, the total messages processed, and the average message processing time.

The Faulted Instances columns of the Component Metrics section count faults that are recoverable and nonrecoverable. Component instances associated with a recoverable fault are not considered faulted. These instances are considered to be running because they have not reached the end of the lifecycle. These instances can be recovered through a recovery option such as retry, rethrow, abort, and so on. This fault count can differ from the Recent Instances section of this page and the Faults and Rejected Messages page, which list faults without making a distinction between recoverable and nonrecoverable.
In the Name column of the Component Metrics section, click a service component. This displays its home page for viewing specific details about instances, faults, and policies.
In the Name column of the Services and References section, click a service or reference. This displays its home page for viewing specific details about instances, faults, policies, rejected messages, and message header configuration properties.
Note:
You can also go to the Instances tab and the Faults and Rejected Messages tab of the SOA Infrastructure to monitor instances and faults across all deployed composites, respectively. From there, you can click a specific composite for additional details.For more information, see the following sections:
Section 1.2.3, "Introduction to SOA Composite Application Instances"
Section 1.2.4, "Introduction to Service Components and Service Component Instances"
Section 8.5, "Recovering from SOA Composite Application Faults at the SOA Infrastructure Level"
Section 8.6, "Recovering from SOA Composite Application Faults in the Application Home Page"
Oracle Fusion Middleware Administrator's Guide for details about viewing and searching log files