6 One View Reporting for Financial Management
This chapter provides overview information, processing options, special processing, and reports for the following applications:
6.1 One View G/L Inquiry (P09219)
Access the One View G/L Inquiry application (P09219) in the Accounting Inquiries (G0914) menu. You can use One View G/L Inquiry to analyze General Ledger transactions. One View G/L Inquiry uses the One View G/L Inquiry (F0911-F0901-F0006) business view (V09219), which includes columns from the Account Ledger table (F0911), Account Master table (F0901), and Business Unit Master table (F0006). This application provides a wealth of data and is extremely flexible in the types of reports that can be generated. Choose from more than 300 columns in the business view to analyze your G/L by subledger (for example, customer, supplier, asset, or item), business unit, company, account, account ranges, or business unit and account category codes. In addition to high-value reports delivered with this application, you can use this application to create reports for many business purposes. Examples are Expense Account Analysis, Revenue Account by Business Unit, Inventory Accounts by Region, a full analysis of any selected G/L Transactions, and many others. Associated descriptions are provided so you can choose to view codes, descriptions, or both. Examples include company, customer, supplier, asset, item, category code, document, batch, ledger, subledger, subledger type, currency, posting code, and many others.
Several predefined reports are delivered with this application. They are G/L Transactions by Customer and Business Unit, G/L Transactions by Account, Business Unit Detail, and G/L Transactions Analysis. With these delivered reports you can view your transaction amounts for your customers and business units. You can also view them by accounts or business units by date or document type. The G/L Transactions Analysis interactive report provides an even broader view of your transactions by providing multiple views of the same data broken down by business unit, object account, subledger, document type, posted or unposted, and account.
6.1.1 Processing Options
Processing options enable you to specify the default processing for programs and reports.
6.1.1.1 Defaults
- 1. As If Currency
-
Specify the "as if" currency code to be used on the One View G/L Inquiry form. When the "as if" currency code is set, the system recalculates domestic amounts under the As If amount (column) using the exchange rate from the "as if" currency code and the date in the Exchange Rate Date processing option.
If you leave this processing option blank, the system does not populate the "as if" currency code on the One View G/L Inquiry form. However, users can enter this value directly into the form.
- 2. Exchange Rate Date
-
Specify the date to use to retrieve the exchange rate between the "as if" currency and the domestic currency.
If you leave this processing option blank, the system date is used.
6.1.1.2 Versions
- 1. One View Customer Ledger Inquiry (P03B2022) Version
-
Specify the version of One View Customer Ledger Inquiry (P03B2022) to use.
If you leave this processing option blank, the system uses version ZJDE0001.
- 2. One View Supplier Ledger Inquiry (P042022) Version
-
Specify the version of One View Supplier Ledger Inquiry (P042022) to use.
If you leave this processing option blank, the system uses version ZJDE0001.
- 3. One View Account Balance Inquiry (P09217) Version
-
Specify the version of One View Account Balance (P09217) to use.
If you leave this processing option blank, the system uses version ZJDE0001.
6.1.2 Special Processing
One View G/L Inquiry:
-
Provides As If Currency conversions if you specify to do so in the header or in the processing options.
-
Provides form exits to One View Customer Ledger Inquiry (P03B2022), One View Supplier Ledger Inquiry (P042022), and One View Account Balance Inquiry (P09217). You can specify which versions of these applications to call in the processing options.
6.1.3 Reports
The reports delivered with the One View G/L Inquiry application are:
-
G/L Transactions by Customer and Business Unit
-
G/L Transactions by Account
-
Business Unit Detail
-
G/L Transactions Analysis
6.1.3.1 G/L Transactions by Customer and Business Unit
This report enables you to view G/L activity by subledger and business unit, which can be especially useful in reviewing your revenue, expense, or inventory accounts if you store the customer, supplier, or item number in the subledger field. You can review these accounts for a single company or business unit or get a broader view by selecting multiple companies, business units, or both. You may also choose to show all transactions across G/L accounts for a specific customer, supplier, item, or asset. You also have the flexibility to review multiple years, periods, or both. This report is specific to customer and revenue accounts as it reverses the sign of the transactions to enable the charts and graphs to be rendered as positive numbers. If you review accounts that should not have their signs reversed, such as expense accounts, you can easily modify the report.
This report contains the following components:
-
Transaction Totals by Customer (Subledger) (horizontal bar graph)
-
Transaction Totals by Business Unit (pie chart)
-
Transactions by Customer (Subledger) (detail table)
6.1.3.2 G/L Transactions by Account
This report enables you to view the transactions of each selected account by day, providing valuable information about the fluctuations of account activity over a specific period. These trends are useful to let you know which days in a month provide the most activity for the accounts. This data can be helpful when tracking your bank account transactions through the month because it can help you make decisions about the best time for a large payment to be made based upon receipt activity. You can generate reports across multiple companies and business units or on just one company or business unit with which you are most concerned. This report also gives you information about the transactions by document type. This way you can see which types of transactions are providing the most activity and whether this activity is voucher payments or invoice receipts.
This report contains the following components:
-
Transaction Totals by Date and Account (bar graph)
-
Transaction Totals by Document Type (bar graph)
-
Transactions by Account (detail table)
6.1.3.3 Business Unit Detail
This report enables you to view the transactions of a specific business unit by day. You can select the specific accounts and periods to be viewed. Select your Inventory accounts for a business unit to see how the transaction volumes change from day to day over a quarter. Viewing this trend can help you determine what your busiest time frame in the quarter is. There is also a chart of the transactions by document type. You can determine what types of inventory transactions occur the most, whether it is issues, transfers, or fulfilling orders. You can use this report for many different account types (for example, Revenue, Expense, Accounts Payable, or Accounts Receivable).
This report contains the following components:
-
Transaction Totals by Date (bar graph)
-
Transaction Totals by Document Type (bar graph)
-
Business Unit Detail (table)
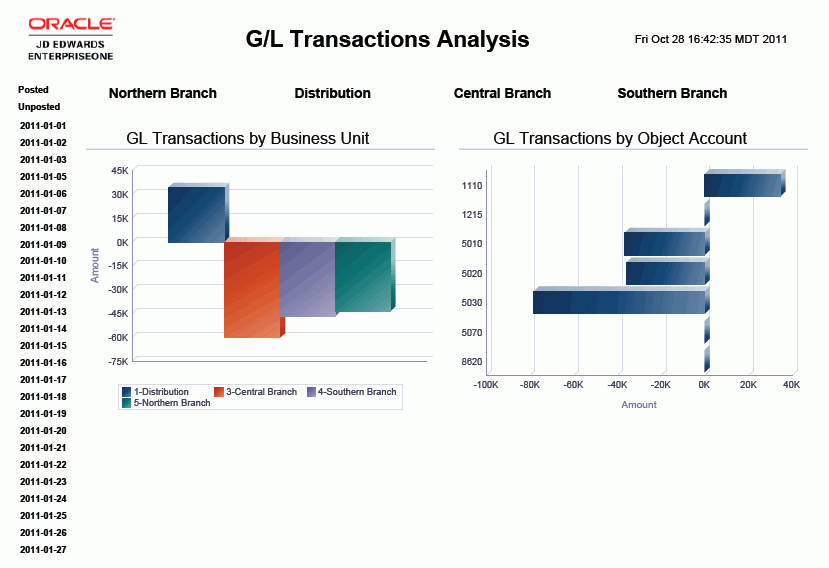
6.1.3.4 G/L Transactions Analysis
This report enables you to analyze a set of transactions in many ways. Use this report to analyze your Accounts Receivable, Accounts Payable, Revenue, or any number of account categories. It enables you to see the transactions in different ways to help you fully analyze the activity.
This report gives you complete control over the information shown in the graphs and table by providing filtering by G/L Date, Posted/Unposted Transactions, and Business Unit.
This report contains the following components:
-
GL Transactions by Business Unit (bar graph)
-
GL Transactions by Object Account (bar graph)
-
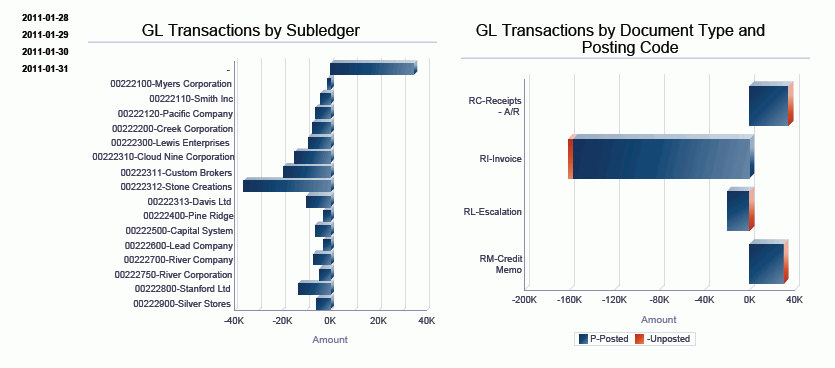
GL Transactions by Subledger (horizontal bar graph)
-
GL Transactions by Document Type and Posting Code (horizontal bar graph)
-
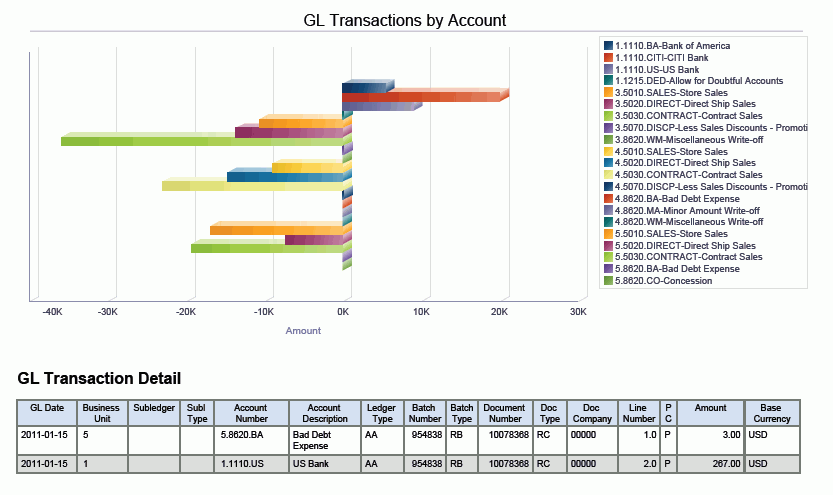
GL Transactions by Account (horizontal bar graph)
-
GL Transactions Detail (table upon which the previous charts are based)
The following report was generated by selecting the A/R Bank, Revenue, Write-off, Bad Debt, and Discount accounts for period 1 of fiscal year 2011 for company 00001 and business units 1, 3, 4, 5, and 9. It shows a broad view of all A/R activity for the period.
6.2 One View Account Balance Inquiry (P09217)
Access the One View Account Balance Inquiry application (P09217) from the Accounting Inquiries (G0914) menu. Use One View Account Balance Inquiry to report on account balances. One View Account Balance Inquiry uses the One View Account Balance Inquiry business view (V09217), which includes columns from the Account Balance table (F0902), F0901, and F0006. This application provides much data and is extremely flexible in the types of reports that can be generated. Choose from more than 250 columns in the business view to report on your Account Balances by fiscal year, period, business unit, company, account, account ranges, business unit and account category codes, and subledger (for example, customer, supplier, asset, or item). In addition to high-value reports delivered with this application, you can use this application to create reports for many business purposes. Examples are A/P or A/R Trade Account Balance by Business Unit analysis, Budget versus Actual by Company Comparisons, Quarterly Expense Account Balance review, analysis of any number of account balances, and many others. Associated descriptions are provided so you can choose between viewing codes, descriptions, or both. Examples include company, business unit, account, ledger type, subledger type, category codes, currency, and many others.
Several predefined reports are delivered with this application. They are G/L Account Balances, Q1 Sales by Store within a Region, Budget vs. Actual by Business Unit, Trial Balance, Account Balance Trend, Gross Profit, and Account Balance Analysis. Using these delivered reports, you can see how your account balances are spread across subledgers, category codes, and stores; you can analyze your budgets versus actual across multiple criteria; and you can see trends for account balances and see the data that drives the charts and graphs. The Account Balance Analysis report provides an even broader view of your transactions by providing multiple views of the same data broken down by company, business unit, category codes, object account, and subledgers. It also shows budget versus actual information.
6.2.1 Processing Options
Processing options enable you to specify the default processing for programs and reports.
6.2.1.1 Defaults
- 1. As If Currency
-
Specify the "as if" currency code to be used on the One View Account Balance Inquiry form. When the "as if" currency code is set, the system recalculates domestic amounts under the As If amount (column) using the exchange rate from the "as if" currency code and the date in the Exchange Rate Date processing option.
If you leave this processing option blank, the system does not populate the "as if" currency code on the One View Account Balance Inquiry form. However, users can enter this value directly into the form.
- 2. Exchange Rate Date
-
Specify the date to use to retrieve the exchange rate between the "as if" currency and the domestic currency.
If you leave this processing option blank, the system date is used.
6.2.2 Special Processing
One View Account Balance Inquiry uses the following special processing:
-
If left blank, the from and through period numbers are provided by default from the current period for company 00000.
-
Period numbers are generated, and a separate record for each period with Amount Net Posting and Amount Net Debit Posting appears in the grid.
-
Comparison Ledger processing is provided.
-
Beginning balance appears based on the GLG ranges for Revenue and Profit and Loss accounts.
-
As If Currency Conversions are available.
-
A form exit is available for One View G/L Inquiry (P09219). The version is specified in the processing options.
-
If desired, zero balance records can be suppressed.
6.2.3 Reports
The reports delivered with the One View Account Balance Inquiry program are:
-
G/L Account Balances
-
Q1 Sales by Store for Region
-
Budget vs. Actual by Business Unit
-
Trial Balance
-
Account Balance Trend
-
Gross Profit
-
Account Balance Analysis
6.2.3.1 G/L Account Balances
This report enables you to view your account balances by subledger and business unit category code 1. If you use subledgers to track customers, suppliers, assets, or items, this report provides you an excellent view of the balances for these items. Select your Accounts Receivable accounts and view your customer balances, or select your Accounts Payable accounts and view your supplier balances, or select your inventory accounts and view your item balances. One view is based on the business unit category code 1 value. You can use this to view the account balances for a specific region or division, depending on how you have this category code setup in your organization. This report can be run over any set of accounts or time frames for whatever set of companies or business units you need to view.
This report contains the following components:
-
Account Balance by Subledger (horizontal bar graph)
-
Account Balance by Business Unit Category Code 1 (bar graph)
-
Account Balances (detail table)
6.2.3.2 Q1 Sales by Store for Region
This report shows how flexible One View Reporting can be. This report is designed to be run over your Store Sales account balances using the business unit as the store and the business unit category code 2 for region. It can be run for whatever period you want. If you do not have Store Sales accounts, it can just as easily be used to view other account groupings, such as Revenue or Expense, with a focus on the business unit. It shows the trend of the account balance over the time frame specified and a graph of the different business units. You can select multiple business units, account groupings, and time frames to view.
This report contains the following components:
-
Q1 Sales by Store (bar graph)
-
Store Sales Trend (line graph)
-
Sales by Store (detail table)
6.2.3.3 Budget vs. Actual by Business Unit
This report enables you to view budget versus actual balances for your accounts over a user-specified time frame. You enter your budget ledger as your comparison ledger into the application. It gives you the information you need to determine if you are over or under budget for your selected accounts and what the trend over time is for the budget versus actual. You can select all your accounts with budgets to see how things are tracking across the organization or select just a specific grouping of accounts, such as rent or electricity expense. You choose what level of granularity you want to view.
This report contains the following components:
-
Budget vs. Actual (pie chart)
-
Budget vs. Actual by Period (bar graph)
-
Budget vs. Actual by Business Unit (detail table)
The Budget vs. Actual by Business Unit table component contains drill back functionality as described in the following table:
| Functionality | Value |
|---|---|
| Table column containing drill back link | Object Account |
| Table columns passed to application | Object, Company, Ledger Type |
| Application called | Trial Balance by Object (P09214) |
| Form called | W09214A |
| Version called | ZJDE0001 |
6.2.3.4 Trial Balance
This report enables you to view a trial balance in multiple ways. Select the companies, accounts, and period you want included in the report. You can then see the trial balance by Account; Business Unit; Object Account; Subledger Type, Subledger and Object Account; and Object Account, Subledger Type, and Subledger. Your selected account balances appear in all four views.
This report contains the following components:
-
Trial Balance by Account (pivot table)
-
Trial Balance by Business Unit (pivot table)
-
Trial Balance by Object Account (pivot table)
-
Trial Balance by Subledger Type, Subledger, and Object Account (pivot table)
-
Trial Balance by Object Account, Subledger Type, and Subledger (pivot table)
-
Trial Balance Detail (table)
The Trial Balance Detail table component contains drill back functionality as described in the following table:
| Functionality | Value |
|---|---|
| Table column containing drill back link | Object Account |
| Table columns passed to application | Object, Company, Ledger Type |
| Application called | Trial Balance by Object (P09214) |
| Form called | W09214A |
| Version called | ZJDE0001 |
6.2.3.5 Account Balance Trend
This report enables you to view account balance trends. Select any grouping of accounts for your desired time frame and see trends by Business Unit and Object Account. Also included are pivot tables of the data showing Opening Amount, Debit Amount, Credit Amount, and Balance. These pivot tables show the information in Balance by Account and Balance by Account and Subledger formats. This report is useful when analyzing trends for Accounts Receivable, Accounts Payable, or any other grouping that needs this type of analysis. You select the range of companies, business units, accounts, and the time frame to be displayed.
This report contains the following components:
-
Trend by Business Unit (line graph)
-
Trend by Object Account (line graph)
-
Balance by Account (table)
-
Balance by Account and Subledger (table)
-
Account Balance Detail (table)
The Account Balance Detail table component contains drill back functionality as described in the following table:
| Functionality | Value |
|---|---|
| Table column containing drill back link | Object Account |
| Table columns passed to application | Account ID (Account Number Input - Mode Unknown) |
| Application called | Account Balances by Month (P0902P1) |
| Form called | W0902P1D |
| Version called | ZJDE0001 |
6.2.3.6 Gross Profit
This report enables you to view the gross profit based on the revenue and cost of goods accounts that you select to be included in the report. This report uses account category code 43 to determine which account is revenue and which account is cost of goods. You can view the gross profit, revenue, and cost of goods by business unit. A pivot table shows these amounts by period. You can run this report over any company, business unit, or set of accounts with specific values in account category code 43 to get this type of information. You may also select the time frame to be viewed. You can use this report to compare multiple types of accounts, such as all revenue and all expense accounts, and to determine your overall profit or just your sales revenue against your cost of goods sold accounts.
|
Note: If Category code 43 does not have this classification for Revenue and Cost of Goods. You can add the values into the UDC and classify your accounts or copy this report and use any other category code that you want with this classification. |
This report contains the following components:
-
Gross Profit by Business Unit (horizontal bar graph)
-
Revenue by Business Unit (bar graph)
-
Cost of Goods by Business Unit (bar graph)
-
Gross Profit by Period (table)
-
Account Balance Detail (table)
The Account Balance Detail table component contains drill back functionality as described in the following table:
| Functionality | Value |
|---|---|
| Table column containing drill back link | Object Account |
| Table columns passed to application | Account ID (Account Number Input - Mode Unknown) |
| Application called | Account Balances by Month (P0902P1) |
| Form called | W0902P1D |
| Version called | ZJDE0001 |
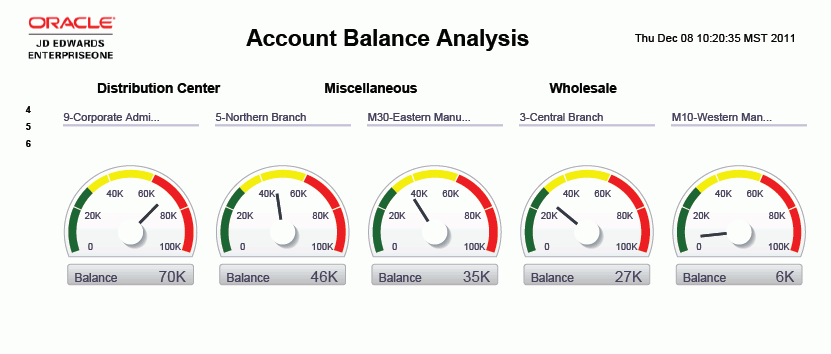
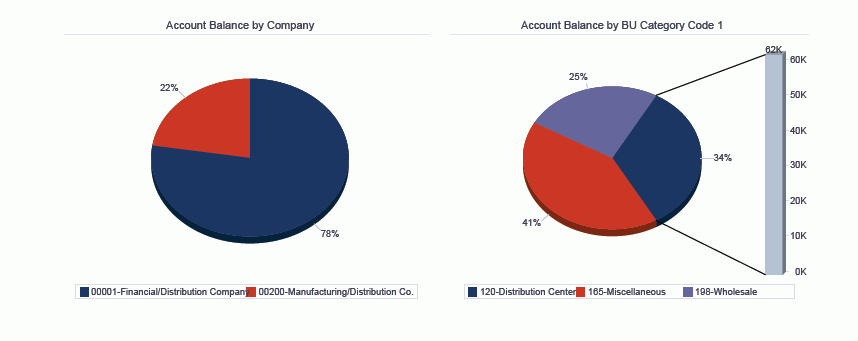
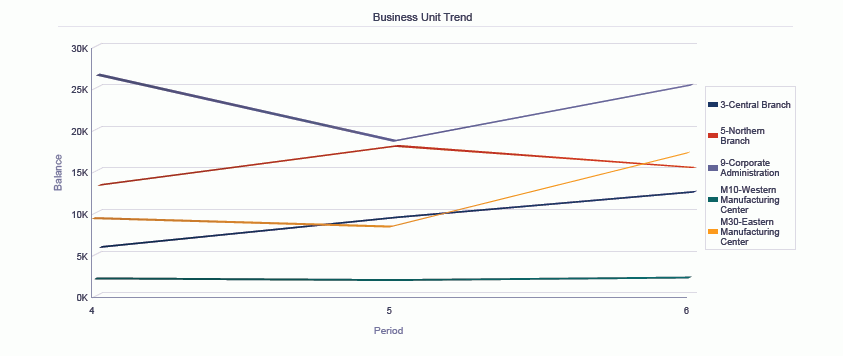
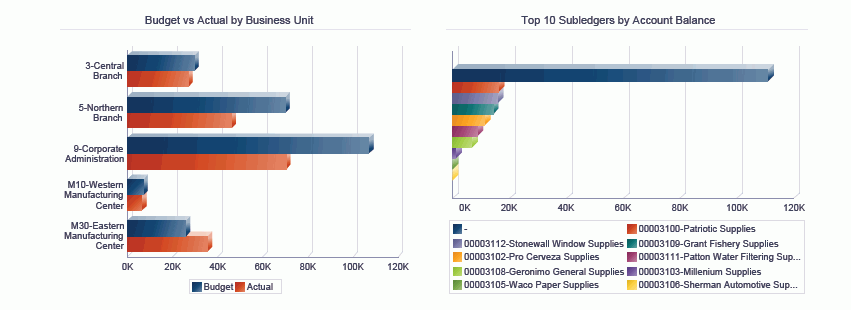
6.2.3.7 Account Balance Analysis
This report enables you to do a full analysis of a group of account balances. View the account balances by business unit, company, business unit category code, business unit trend over selected periods, budget vs. actual by business unit, top 10 subledgers, and budget vs. actual by object account. You can select account groupings such as your revenue, expense, or asset accounts to fully analyze them. You can run this report over multiple companies and business units or over only a specific business unit. Do it for a year, a quarter, or any number of periods.
|
Note: To see budget amounts in this report, you must enter a value in the Comparison Ledger field in the header of the application. |
This report gives you complete control over the information shown in the graphs and table by providing filtering by period and business unit category code 1. This report contains the following components:
-
Account Balance by Business Unit (gauges)
-
Account Balance by Company (pie chart)
-
Account Balance by BU Category Code 1 (pie chart)
-
Business Unit Trend (line graph)
-
Budget vs. Actual by Business Unit (horizontal bar graph)
-
Top 10 Subledgers by Account Balance (bar graph)
-
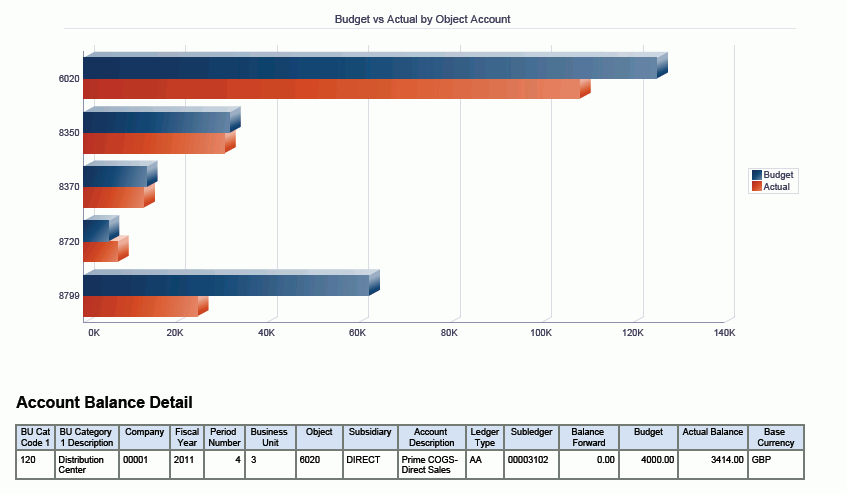
Budget vs. Actual by Object Account (horizontal bar graph)
-
Account Balance Detail (table)
The Account Balance Detail table component contains drill back functionality as described in the following table:
| Functionality | Value |
|---|---|
| Table column containing drill back link | Object |
| Table columns passed to application | Object, Company, Ledger Type |
| Application called | Trial Balance by Object (P09214) |
| Form called | W09214A |
| Version called | ZJDE0001 |
The following report was generated by selecting the A/P Expense accounts for periods four through six of fiscal year 2011 with ledger type of AA and a comparison ledger of BA for companies 00001 and 00200 with business units 3, 5, 9, M10, and M30. It shows a broad view of the A/P Expense account balances and budgets across the periods.
6.3 One View Customer Ledger Inquiry (P03B2022)
Access the One View Customer Ledger Inquiry application (P03B2022) from the Accounts Receivable Inquiries (G03B17) menu. Use One View Customer Ledger Inquiry to analyze customer ledger transactions. One View Customer Ledger Inquiry uses the One View Customer Ledger Inquiry business view (V03B11I), which includes columns from the Customer Ledger table (F03B11) and Customer Line of Business Master table (F03012). This application provides a wealth of data and is extremely flexible in the types of reports that can be generated. Choose from more than 500 columns in the business view to analyze your Customer Ledger by period, fiscal year, discounts information, aging categories, collection or credit manager, any number of category codes, and so on. In addition to high-value reports delivered with this application, you can use this application to create reports for many business purposes. Examples are Paid vs. Open Invoice by Collection Manager, Credit Memos by Business Unit, Top 10 Customers, A/R Analysis by Business Unit or Region, and many others. Associated descriptions are provided so you can choose among viewing codes, descriptions, or both. Examples include company, customer, category code, currency, pay status, and many others.
Several predefined reports are delivered with this application. They are Open Invoices, Customer Balance, Open Invoices with Aging, and Customer Account Balance Analysis. Using these delivered reports, you can see your top 10 customers based on open invoices, see how your open invoices are spread across all customers, and track your aging by credit manager and region (customer master category code 1). The Customer Ledger Analysis report provides an even broader view of your transactions by providing multiple views of the same data broken down by region (customer master category code 1), collection and credit manager, aging by customer, and periods.
6.3.1 Processing Options
Processing options enable you to specify the default processing for programs and reports.
6.3.1.1 Defaults
- 1. As If Currency
-
Specify the "as if" currency code to be used on the One View Customer Ledger Inquiry form. When the "as if" currency code is set, the system recalculates domestic amounts under the As If amount (column) using the exchange rate from the "as if" currency code and the date in the Exchange Rate Date processing option.
If you leave this processing option blank, the system does not populate the "as if" currency code on the One View Customer Ledger Inquiry. However, users can enter this value directly on the form.
- 2. Exchange Rate Date
-
Specify the date to use to retrieve the exchange rate between the "as if" currency and the domestic currency.
If you leave this processing option blank, the system date is used.
6.3.1.2 Aging Specifications
- 1. A/R Company Constants
-
Specify whether the system retrieves aging specifications from the Accounts Receivable constants or from the Aging processing options. Values are:
Blank: Use the values specified in the Aging processing options.
1: Use the values specified in the Accounts Receivable constants. If the Age as of Date field in the A/R constants is blank, the system uses the current date.
- 2. Date Type
-
Specify the date on the invoice that you want the system to use to determine the aging category. The system compares the date that you specify to the value in the application control As Of Date to determine the number of days the invoice is past due. Values are:
Blank: Use the invoice due date.
1: Use the invoice date.
2: Use the G/L date.
3: Use the statement date.
- 3. Aging Method (1,2,3)
-
Specify which aging categories the system uses to assign invoices. The system uses the date specified in the application control As Of Date and the value specified in the Date Type processing option to calculate the aging for each invoice, and then assigns them to the aging category specified by this code. Values are:
Blank or 1: Aging days. The system assigns invoices to the aging categories specified in the Aging Category 1 through Aging Category 8 processing options. The aging categories are user defined.
2: Fiscal periods. The system uses the fiscal periods defined by the date pattern assigned to the company record as the aging categories.
3: Calendar. The system uses each calendar month as an aging category.
- 4. Aging Category 1
-
Use this processing option with the value specified in the Aging Category 2 processing option to specify the interval that the system uses for the future and current aging categories.
- 5. Aging Category 2
-
Use this processing option with the values specified in the Aging Category 1 and Aging Category 3 processing options to determine the interval that the system uses for the current and first aging categories.
- 6. Aging Category 3
-
Use this processing option with the values specified in the Aging Category 2 and Aging Category 4 processing options to determine the interval that the system uses for the first and second aging categories.
- 7. Aging Category 4
-
Use this processing option with the values specified in the Aging Category 3 and Aging Category 5 processing options to determine the interval that the system uses for the second and third aging categories.
- 8. Aging Category 5
-
Use this processing option with the values specified in the Aging Category 4 and Aging Category 6 processing options to determine the interval that the system uses for the third and fourth aging categories.
- 9. Aging Category 6
-
Use this processing option with the value specified in the Aging Category 5 and Aging Category 7 processing options to determine the interval that the system uses for the fourth and fifth aging categories.
- 10. Aging Category 7
-
Use this processing option with the value specified in the Aging Category 6 and Aging Category 8 processing options to determine the interval that the system uses for the fifth and sixth aging categories (Recheck Software for text issue).
- 11. Aging Category 8
-
Use this processing option with the value specified in the Aging Category 7 processing option to determine the interval that the system uses for the sixth aging category.
6.3.1.3 Versions
- 1. One View Customer Receipt/Draft Inquiry (P03B702) Version
-
Specify the version of One View Customer Receipt/Draft Inquiry (P03B702) to use. If you leave this processing option blank, the system uses version ZJDE0001.
- 2. One View G/L Inquiry (P09219) Version
-
Specify the version of One View GL Inquiry (P09219) to use. If you leave this processing option blank, the system uses version ZJDE0001.
6.3.2 Special Processing
One View Customer Ledger Inquiry has the following special processing:
-
The customer master information is retrieved based on the customer shown in the invoice and is retrieved by Line of Business. If the company is not specified in the Customer Master, the system uses default company 00000. Based on this special processing, all Customer Master columns are not available in the QBE.
-
As Of Processing is available. If an As Of Date is entered, the system does not display records with a zero open amount.
-
Aging processing is available.
-
As If Currency conversions are available.
-
There are form exits to One View Customer Receipt/Draft Inquiry (P03B720) and One View G/L Inquiry (P09219). The versions are specified in the processing options.
6.3.3 Reports
The reports delivered with the One View Customer Ledger Inquiry program are:
-
Customer Balance
-
Open Invoices
-
Open Invoices with Aging
-
Customer Account Balance Analysis
6.3.3.1 Customer Balance
This report enables you to see your customer's open balances. When you select all document types from the customer ledger, you see the full picture of your customer's open balances since it takes into account all types of invoices, deductions, charge backs, and so on. Your collection or credit managers will find this especially useful when they only select their customers on which to report. You can also select data for multiple companies or business units to get a view of the balances across your organization.
This report contains the following components:
-
Customer Balance (horizontal bar graph)
-
Customer Balance Detail (table)
The Customer Balance Detail table component contains drill back functionality as described in the following table:
| Functionality | Value |
|---|---|
| Table column containing drill back link | Doc Number |
| Table columns passed to application | Doc Number |
| Application called | Customer Ledger Inquiry (P03B2002) |
| Form called | W03B2002A |
| Version called | ZJDE0001 |
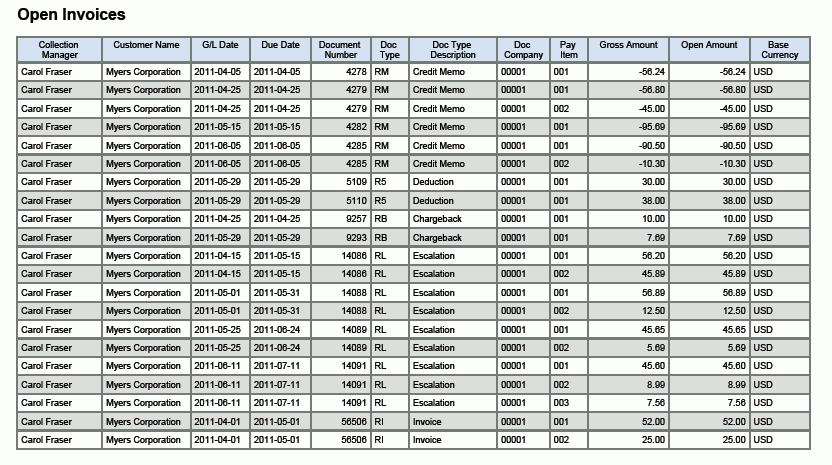
6.3.3.2 Open Invoices
This report enables you to view information about your open invoice amounts. It provides information about your top 10 customers and information about the open amount by category code. This report is helpful when trying to see, at a glance, which 10 customers have the highest open invoice amounts. You can see the information for a particular fiscal year; specific periods; company; business unit; credit manager, collection manager, or both; or type of customer based on your customer category codes.
This report contains the following components:
-
Top 10 Customers by Open Amount (horizontal bar graph)
-
Open Amount by Customer (table)
-
Open Amount by Customer Master Category Code 1 (pie chart)
-
Open Invoices (table)
The Open Invoices table component contains drill back functionality as described in the following table:
| Functionality | Value |
|---|---|
| Table column containing drill back link | Doc Number |
| Table columns passed to application | Doc Number |
| Application called | Customer Ledger Inquiry (P03B2002) |
| Form called | W03B2002A |
| Version called | ZJDE0001 |
6.3.3.3 Open Invoices with Aging
This report enables you to view your invoice aging by credit manager and region (where customer master category code 1 indicates region). This report can be especially useful in determining which credit managers are having issues with invoice aging or if a particular region ages invoices differently than others. You can view this data for a particular set of companies, business units, customers, or credit managers. Use this report to fully view the aging of invoices across your organization.
The Aging check box must be selected and an As Of Date entered (if it is blank, then today's date will be used) on the application header to have the data calculated correctly for this report.
This report contains the following components:
-
Aging Open Amount by Credit Manager (horizontal bar graph)
-
Aging Open Amount by Region (bar graph)
-
Open Invoices with Aging (table)
The Open Invoices with Aging table component contains drill back functionality as described in the following table:
| Functionality | Value |
|---|---|
| Table column containing drill back link | Doc Number |
| Table columns passed to application | Doc Number |
| Application called | Customer Ledger Inquiry (P03B2002) |
| Form called | W03B2002A |
| Version called | ZJDE0001 |
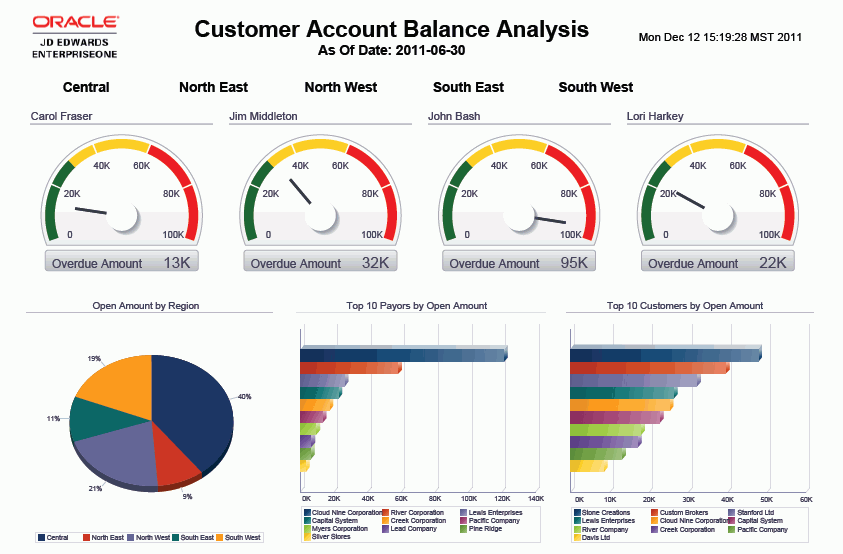
6.3.3.4 Customer Account Balance Analysis
This report enables you to analyze in depth your customer account open balances. This analysis of your open amounts can be done by many attributes. These attributes include credit manager, collection manager, region (customer master category code 1), payor, customer, periods, aging categories, and gross vs. open amounts. View the data for multiple companies or business units for select periods to see how your accounts receivable staff and process are performing.
The Aging check box must be selected and an As Of Date entered (if it is blank, then today's date will be used) on the application header to have the data calculated correctly for this report.
This report gives you complete control over the information shown in the graphs and table by providing filtering by Region (customer master category code 1). This report contains the following components:
-
Overdue Amount by Collection Manager (gauges)
-
Open Amount by Region (pie chart)
-
Top 10 Payors by Open Amount (horizontal bar graph)
-
Top 10 Customers by Open Amount (horizontal bar graph)
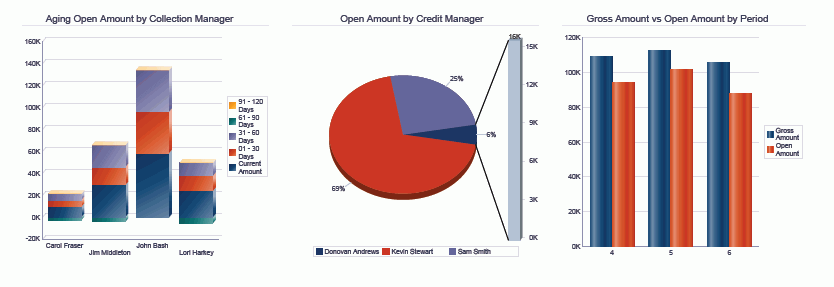
-
Aging Open Amount by Collection Manager (horizontal bar graph)
-
Open Amount by Credit Manager (pie chart)
-
Gross Amount vs. Open Amount by Period (bar graph)
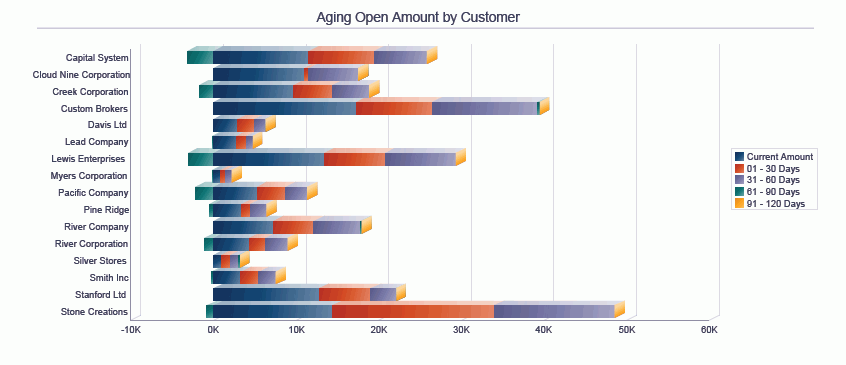
-
Aging Open Amount by Customer (horizontal bar graph)
-
Open Invoices (table)
The Aging Open Amount by Customer table component contains drill back functionality as described in the following table:
| Functionality | Value |
|---|---|
| Table column containing drill back link | Doc Number |
| Table columns passed to application | Doc Number |
| Application called | Customer Ledger Inquiry (P03B2002) |
| Form called | W03B2002A |
| Version called | ZJDE0001 |
The following report was generated by activating Aging and As Of processing with a date of June 30, 2011. The data selected was a large group of customers for company 00001 for periods four through six of fiscal year 11. It shows a broad view of the Customer Account Balances across the periods.
6.4 One View Customer Receipt/Draft Inquiry (P03B720)
Access the One View Customer Receipt/Draft Inquiry application (P03B720) from the Accounts Receivable Inquiries (G03B17) menu. Use One View Customer Receipt/Draft Inquiry to inquire on receipt/draft transactions. One View Receipt/Draft Inquiry uses the One View Receipt Draft Inquiry business view (V03B720), which includes columns from the Receipt Detail table (F03B14), Receipt Header table (F03B13), and Customer Master table (F03012). This application provides a wealth of data and is extremely flexible in the types of reports that can be generated. Choose from more than 300 columns in the business view to analyze your Receipts and Drafts by period, fiscal year, collection or credit manager, any number of category codes, and so on. In addition to high-value reports delivered with this application, you can use this application to create reports for many business purposes. You can analyze your Write-offs, Deductions, Chargebacks, and Discounts, or review your customer receipts by period, and many others. Associated descriptions are provided so you can choose between viewing codes, descriptions, or both. Examples include company, customer, payor, parent, category code, currency, payment instrument, and many others.
Several predefined reports are delivered with this application. They are Receipt Transactions, Receipt History Trend, AR Write-offs, and Receipt Analysis. Using these delivered reports, you can see how your receipts are balanced across business units, collection managers, and other values; see trends for receipts by fiscal year and period, collection manager, and other values; and review the state of your AR write-offs by reason code, customer, and collection manager. The Receipt Analysis report provides an even broader view of your transactions by providing multiple views of the same data broken down by region, business unit, customers, payors, collection manager, and periods.
6.4.1 Processing Options
Processing options enable you to specify the default processing for programs and reports.
6.4.1.1 Defaults
- 1. As If Currency
-
Use this processing option to specify the "as if" currency code to be used on the One View Customer Receipt/Drafts Inquiry form. When the "as if" currency code is set, the system recalculates domestic amounts under the As If amount (column) using the exchange rate from the "as if" currency code and the date in the Exchange Rate Date processing option.
If you leave this processing option blank, the system does not populate the "as if" currency code on the One View Customer Receipt/Drafts Inquiry form. However, users can enter this value directly on the form.
- 2. Exchange Rate Date
-
Specify the date to use to retrieve the exchange rate between the "as if" currency and the domestic currency.
If you leave this processing option blank, the system date is used.
6.4.1.2 Versions
- 1. One View Customer Ledger Inquiry (P03B2022) Version
-
Specify the version of One View Customer Ledger Inquiry (P03B2022) to use. If you leave this processing option blank, the system uses version ZJDE0001.
- 2. One View GL Inquiry (P09219) Version
-
Specify the version of One View GL Inquiry (P09219) to use. If you leave this processing option blank, the system uses version ZJDE0001.
6.4.2 Special Processing
One View Customer Receipt/Draft Inquiry has the following special processing:
-
Customer master information is retrieved based upon the payor of the receipt and is done by Line of Business. If the company is not specified in the customer master, the default company of 00000 is used. Based on this special processing, all Customer Master columns are not available in the QBE.
-
As-If Currency conversions are available.
-
There are form exits to One View Customer Ledger Inquiry (P03B2022) and One View G/L Inquiry (P09219). The versions are specified in the processing options.
-
Receipt Amount has been multiplied by -1 on all report charts and tables to show them with a positive sign. This will match how JD Edwards EnterpriseOne displays this amount.
6.4.3 Reports
The reports delivered with the One View Customer Receipt/Draft Inquiry program are:
-
Receipt Transactions
-
Receipt History Trend
-
A/R Write-Offs
-
Receipt Analysis
6.4.3.1 Receipt Transactions
This report enables you to review all of your receipt transactions. You can view them by business unit, customer, payor, collection manager, and the payor's category code 1 value. You can use this report to review which customers or payors have the highest and lowest receipt amounts. You can compare your receipts across business units or collection managers. This information can be viewed for a specific time frame, business unit, company, or the payor's category code 1 value. It is flexible and can give you insight into your receipt transaction activity by many different attributes.
This report contains the following components:
-
Receipts by Business Unit (bar graph)
-
Receipts by Customer (horizontal bar graph)
-
Receipts by Payor (bar graph)
-
Receipts by Collection Manager (pie chart)
-
Receipts by Payor Category Code 1 (pie chart)
-
Receipt Transactions (detail table)
The Receipt Transactions table component contains drill back functionality as described in the following table:
| Functionality | Value |
|---|---|
| Table column containing drill back link | Receipt Number |
| Table columns passed to application | Receipt Number |
| Application called | Receipt Detail (P03B103) |
| Form called | W03B103B |
| Version called | None |
6.4.3.2 Receipt History Trend
This report enables you to view your receipt trends over any selected time frame. These trends can be viewed by collection manager, payor, and customer. You can view the trends for your entire organization or for selected business units, customers, collection managers, or many other combinations.
This report contains the following components:
-
Receipt History Trend (line graph)
-
Receipt Trend by Collection Manager (line graph)
-
Receipt Trend by Payor (line graph)
-
Receipt Trend by Customer (table)
6.4.3.3 A/R Write-Offs
This report enables you to view write-offs by reason code, collection manager, and customer. This report is valuable for understanding where write-offs come from and the reasons for them. You can view your write-off information for a specific time frame, collection manager, business unit, company, or a combination of these to help you understand the source. This information will help you identify trends in write-offs and give you the information you need to strengthen relationships with your customers and to improve your accounts receivable processes.
This report contains the following components:
-
A/R Write-Offs by Reason Code (bar graph)
-
A/R Write-Offs by Customer (horizontal bar graph)
-
A/R Write-Offs by Collection Manager (pie chart)
-
A/R Write-Offs Detail (table)
The A/R Write-Offs Detail table component contains drill back functionality as described in the following table:
| Functionality | Value |
|---|---|
| Table column containing drill back link | Receipt Number |
| Table columns passed to application | ReceiptNumber |
| Application called | Receipt Detail (P03B103) |
| Form called | W03B103B |
| Version called | None |
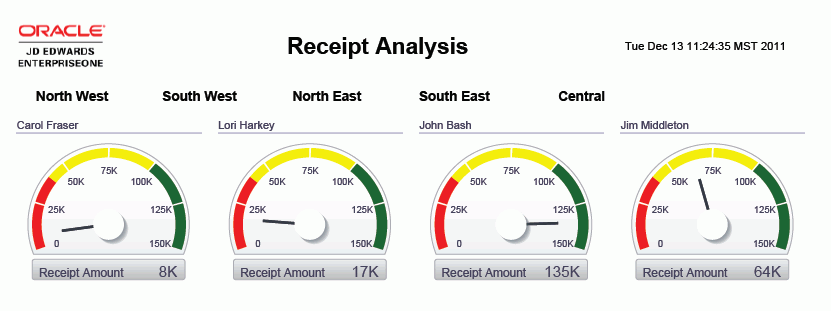
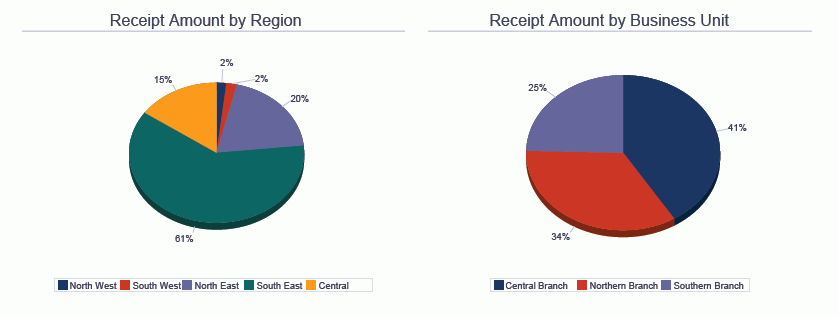
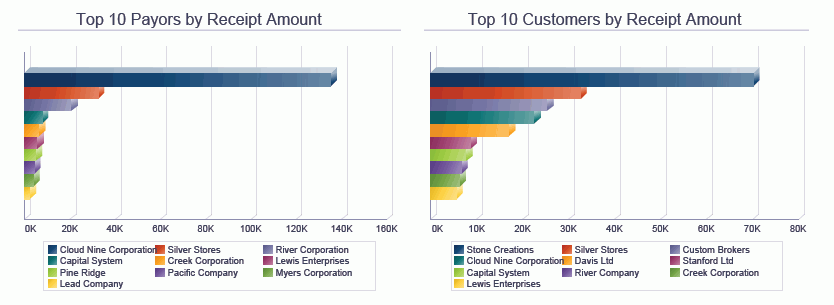
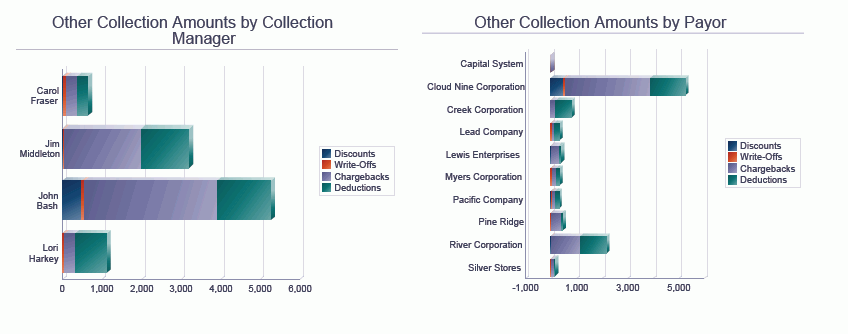
6.4.3.4 Receipt Analysis
This report enables you to do a full analysis of your receipt transactions. You can view your receipt transactions by collection manager, region (customer master category code 1), business unit, payor, and customer. You can analyze your entire organization or focus on a few business units, customers, regions, or collection managers. You choose the time frame and the group of receipt transactions to include in your analysis.
This report gives you complete control over the information shown in the graphs and table by providing filtering by Region (customer master category code 1). This report contains the following components:
-
Receipt Amount by Collection Manager (gauges)
-
Receipt Amount by Region (pie chart)
-
Receipt Amount by Business Unit (pie chart)
-
Top 10 Payors by Receipt Amount (horizontal bar graph)
-
Top 10 Customers by Receipt Amount (horizontal bar graph)
-
Other Collection Amounts by Collection Manager (horizontal bar graph)
-
Other Collection Amounts by Payor (horizontal bar graph)
-
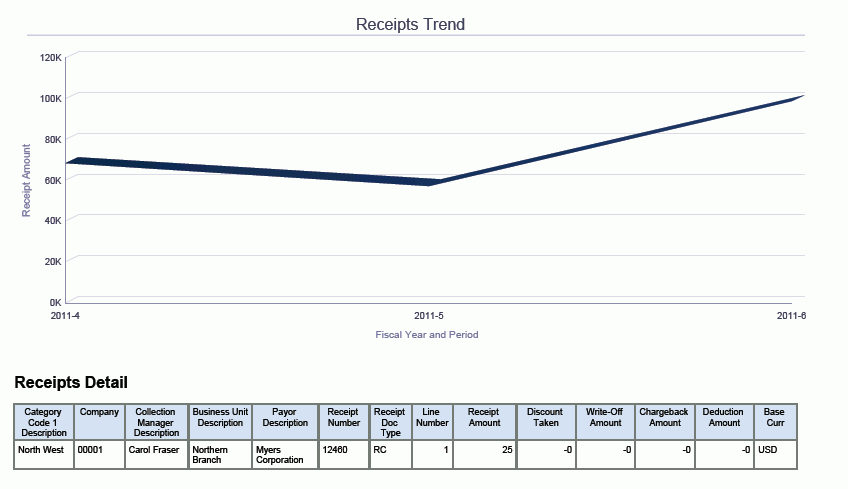
Receipts Trend (line graph)
-
Receipts Detail (table)
The Receipts Detail table component contains drill back functionality as described in the following table:
| Functionality | Value |
|---|---|
| Table column containing drill back link | Receipt Number |
| Table columns passed to application | Payment ID |
| Application called | Standard Receipt Entry (P03B102) |
| Form called | W03B102A |
| Version called | ZJDE0001 |
The following report was generated by selecting a large group of customers for company 00001 for periods four through six of fiscal year 11. It shows a broad view of the receipt activity across the periods.
6.5 One View Supplier Ledger Inquiry (P042022)
Access the One View Supplier Ledger Inquiry application (P042022) from the Accounts Payable Inquiries (G0415) menu. Use One View Supplier Ledger Inquiry to analyze supplier ledger transactions. One View Supplier Ledger Inquiry uses the One View Supplier Ledger Inquiry business view (V042022), which includes columns from the Accounts Payable Ledger table (F0411), Supplier Master table (F0401), and the Address Book table (F0101). This application provides a wealth of data and is extremely flexible in the types of reports that can be generated. Choose from more than 300 columns in the business view to analyze your Supplier Ledger by period, fiscal year, discounts information, supplier, payee, approver, any number of category codes, and so on. In addition to high-value reports delivered with the application, you can use this application to create reports for many business purposes. Examples are Gross vs. Open Amounts by Approver, Top 10 Suppliers, A/P Analysis by Business Unit or Region, and many others. Associated descriptions are provided so you can choose between viewing codes, descriptions or both. Examples include company, supplier, category code, currency, pay status, and many others.
Several predefined reports are delivered with this application. They are Open Vouchers, Payments Due Within 30 Days, Payments Overdue, Transaction Volume by Pay Item, and Supplier Account Balance Analysis. Using these delivered reports, you can see how your vouchers are spread across suppliers and what your payments are for the next 30 days. You can track your overdue payments by business unit. The Supplier Ledger Analysis report provides an even broader view of your transactions by providing multiple views of the same data broken down by region (supplier master category code 1), approver, business unit, document type, due date, and periods.
6.5.1 Processing Options
Processing options enable you to specify the default processing for programs and reports.
6.5.1.1 Defaults
- 1. As If Currency
-
Specify the "as if" currency that the system displays in the As If Curr Code field on the One View Supplier Ledger Inquiry form. If you specify an "as if" currency code value, the system calculates and displays the values in the "as if" amount column on the form based on domestic amount and using the exchange rate from the "as if" currency code and the date in the Exchange Rate Date processing option.
If you leave this processing option blank, the system does not populate the As If Curr Code field on the One View Supplier Ledger Inquiry form. However, you can enter this value directly on the form.
- 2. Exchange Rate Date
-
Specify the date to use to retrieve the exchange rate between the "as if" currency and the domestic currency.
If you leave this processing option blank, the system date is used.
6.5.1.2 Versions
- 1. One View Supplier Payment Inquiry (P04720) Version
-
Specify the version of One View Supplier Payment Inquiry program (P04720) that the system uses.
If you leave this processing option blank, the system uses version ZJDE0001.
- 2. One View GL Inquiry (P09219) Version
-
Specify the version of One View GL Inquiry program (P09219) that the system uses.
If you leave this processing option blank, the system uses version ZJDE0001.
6.5.2 Special Processing
One View Supplier Ledger Inquiry has the following special processing:
-
Adjustment records are not displayed as they are already applied to the original pay item.
-
As-Of Processing is available.
-
If the As Of Date is entered, records with zero open amount are not displayed.
-
As-If Currency conversions are available.
-
There are form exits to One View Supplier Payment Inquiry (P04720) and One View G/L Inquiry (P09219). Versions are specified in the Processing Options.
6.5.3 Reports
The reports delivered with the One View Supplier Ledger Inquiry application are:
-
Open Vouchers
-
Payments Due Within 30 Days
-
Payments Overdue
-
Transaction Volume by Pay Item
-
Supplier Account Balance Analysis
6.5.3.1 Open Vouchers
This report enables you to view information about your open voucher amounts. It provides information about your open amounts by supplier, address book category code 1, and approver. This report is helpful when trying to see, at a glance, which suppliers or approvers have the highest open amounts. Including category codes in this report helps you expand your view by a specific supplier attribute. There is a table included with the amounts shown by category code 1, approver, and supplier. This is useful to see specific supplier amounts broken down by these categories. You can see the information for a particular fiscal year, specific periods, company, business unit, approver, or supplier attribute based upon your supplier category codes.
This report contains the following components:
-
Open Vouchers by Supplier (horizontal bar graph)
-
Open Vouchers by Category Code 1 (pie chart)
-
Open Vouchers by Approver (bar graph)
-
Open Vouchers by Category Code 1, Approver, and Supplier (table)
-
Open Voucher Detail by Supplier (table)
The Open Voucher Detail by Supplier table component contains drill back functionality as described in the following table:
| Functionality | Value |
|---|---|
| Table column containing drill back link | Doc Number |
| Table columns passed to application | Doc Number, Doc Type, Doc Company |
| Application called | A/P Standard Voucher Entry (P0411) |
| Form called | W0411G |
| Version called | ZJDE0001 |
6.5.3.2 Payments Due Within 30 Days
This report enables you to view all of your payments that are due within the next 30 days. You have access to information regarding the amounts by supplier, business unit, and approver. There is additional information on the discounts that are available for these payments. These graphs and tables include invaluable information for determining what days payments should be made to take advantage of the greatest discounts, which approver and business unit have the highest amounts to work through, and the details to go along with the charts. You can view this information for an entire company or break it down to the approver or business unit level. If you want, you can change the report to view payments due within the next 10, 60, 90, or more days.
|
Note: To see accurate, usable information on this report, you must perform specific data selection over the due date based on the days of the report. |
This report contains the following components:
-
Top 10 Suppliers by Payments Due (horizontal bar graph)
-
Payments Due by Supplier (table)
-
Discount Available by Discount Due Date (bar graph)
-
Payments Due by Business Unit (pie chart)
-
Payments Due by Approver (pie chart)
-
Payments Due Within 30 Days (detail table)
The Payments Due Within 30 Days table component contains drill back functionality as described in the following table:
| Functionality | Value |
|---|---|
| Table column containing drill back link | Doc Number |
| Table columns passed to application | Doc Number, Doc Type, Doc Company |
| Application called | A/P Standard Voucher Entry (P0411) |
| Form called | W0411G |
| Version called | ZJDE0001 |
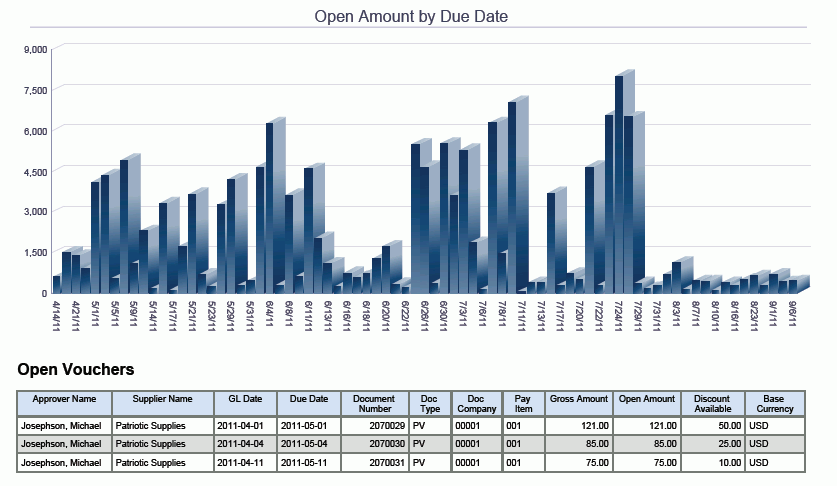
6.5.3.3 Payments Overdue
This report enables you to view all the information regarding your overdue payments. Review this information by supplier, business unit, approver, and due date. This report is useful for determining how much is past due, the suppliers the payments are for, and who is responsible for approving the payments. You can see this information for your entire organization or focus on a specific company, business unit, or approver. If you consider payments overdue to be not just anything that was due by today, change your data selection to include additional dates.
This report contains the following components:
-
Top 10 Suppliers by Payments Overdue (horizontal bar graph)
-
Payments Overdue by Supplier (table)
-
Payments Overdue by Due Date (bar graph)
-
Payments Due by Business Unit (pie chart)
-
Payments Due by Approver (pie chart)
-
Payments Overdue (detail table)
The Payments Overdue table component contains drill back functionality as described in the following table:
| Functionality | Value |
|---|---|
| Table column containing drill back link | Doc Number |
| Table columns passed to application | Doc Number, Doc Type, Doc Company |
| Application called | A/P Standard Voucher Entry (P0411) |
| Form called | W0411G |
| Version called | ZJDE0001 |
6.5.3.4 Transaction Volume by Pay Item
This report enables you to view the average number of pay items that you process per supplier and the average gross amount per invoice. You can see the suppliers that have a high number of pay items per invoice. This information can be useful in understanding the processing time for each invoice and can assist you in improving your payments process. You can view this information for a specific time period, company, group of suppliers, or approver to get a finer level of detail to make your decisions.
This report contains the following components:
-
Suppliers Balance and Number of Pay Items (bar and line graph)
-
Suppliers Balance, Average Balance, and Number of Pay Items (table)
-
Voucher Details (table)
The Voucher Details table component contains drill back functionality as described in the following table:
| Functionality | Value |
|---|---|
| Table column containing drill back link | Doc Number |
| Table columns passed to application | Doc Number, Doc Type, Doc Company |
| Application called | A/P Standard Voucher Entry (P0411) |
| Form called | W0411G |
| Version called | ZJDE0001 |
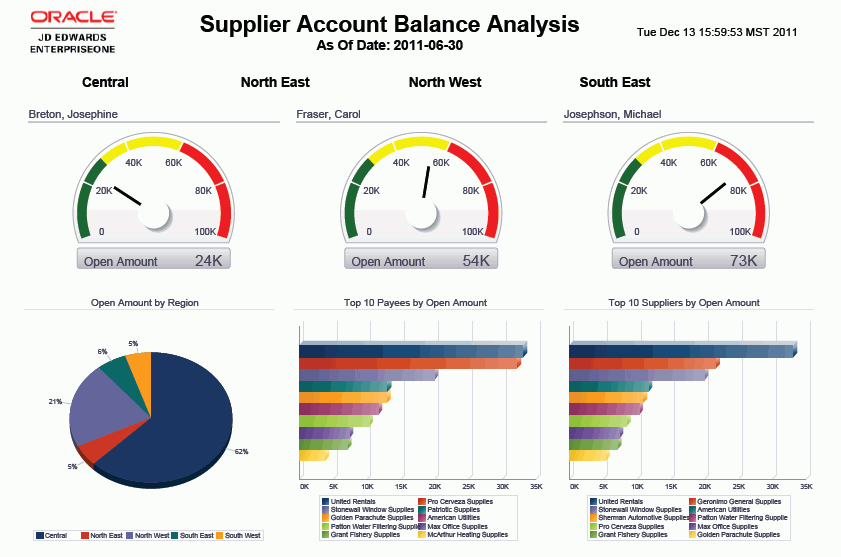
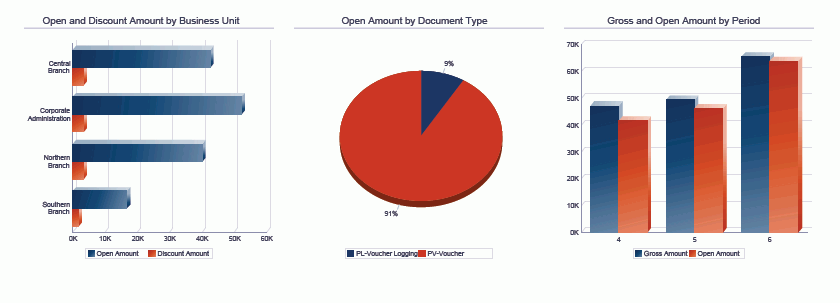
6.5.3.5 Supplier Account Balance Analysis
This report enables you to analyze in depth your supplier account balances. This analysis of your open amounts can be done by many attributes. These attributes include approver, region, business unit, document type, due date, payee, supplier, periods, and gross vs. open amounts. View the data for multiple companies or business units for select periods to see how your accounts payable staff and process are performing.
|
Note: As Of Date must be entered in order for this report to provide accurate information. |
This report gives you complete control over the information shown on the graphs and table by providing filtering by Region (address book category code 1). This report contains the following components:
-
Open Amount by Approver (gauges)
-
Open Amount by Region (pie chart)
-
Top 10 Payees by Open Amount (horizontal bar graph)
-
Top 10 Suppliers by Open Amount (horizontal bar graph)
-
Open and Discount Amount by Business Unit (horizontal bar graph)
-
Open Amount by Document Type (pie chart)
-
Gross and Open Amount by Period (bar graph)
-
Open Amount by Due Date (bar graph)
-
Open Vouchers (detail table)
The Open Vouchers table component contains drill back functionality as described in the following table:
| Functionality | Value |
|---|---|
| Table column containing drill back link | Doc Number |
| Table columns passed to application | Doc Number, Doc Type, Doc Company |
| Application called | A/P Standard Voucher Entry (P0411) |
| Form called | W0411G |
| Version called | ZJDE0001 |
The following report was generated by activating As Of processing with a date of June 30, 2011. The data selected was a large group of suppliers, for company 00001 for periods four through six of fiscal year 11. It shows a broad view of the supplier account balances across the periods.
6.6 One View Supplier Payment Inquiry (P04720)
Access the One View Supplier Payment Inquiry application (P04720) from the Accounts Payable Inquiries (G0415) menu. Use One View Supplier Payment Inquiry to inquire on supplier payment transactions. One View Supplier Payment Inquiry uses the One View Supplier Payment Inquiry business view (V04720), which includes columns from the Payment Detail table (F0414), Payment Header table (F0413), F0401, and F0101. This application provides a wealth of data and is extremely flexible in the types of reports that can be generated. Choose from over 300 columns in the business view to analyze your supplier payments by period, fiscal year, approver, any number of category codes, and so forth. In addition to high-value reports delivered with this application, you can use this application to create reports for many business purposes. You can analyze your Discounts Lost and Taken by many factors, or review your payments by period, and many others. Associated descriptions are provided so you can choose between viewing codes, descriptions or both. Examples include company, supplier, payee, parent, category code, currency, payment instrument, and many others.
Several predefined reports are delivered with this application. They are Payments, Payment Trends, Payment Discounts, and Payment Analysis. With these delivered reports you can see how your payments are spread across business units, suppliers, and bank accounts; see payment trends by business unit, supplier, bank account, and category code; see discount information by supplier, business unit and category code. The Payment Analysis interactive report provides an even broader view of your payments and discounts by providing multiple views of the same data broken down by region, approver, business unit, bank account, and periods.
6.6.1 Processing Options
Processing options enable you to specify the default processing for programs and reports.
6.6.1.1 Defaults
- 1. As If Currency
-
Specify the As If currency that the system displays in the As If Curr Code field on the One View Supplier Payment Inquiry form. If you specify a value in this processing option, the system calculates domestic amounts using the exchange rate that is associated with the As If currency code and the date in the Exchange Rate Date processing option. The system displays the amount in the As If amount column on the form.
If you leave this processing option blank, the system does not populate the As If Curr Code field on the One View Supplier Payment Inquiry form. However, you can enter a value on the form.
- 2. Exchange Rate Date
-
Specify the date that the system uses to retrieve the exchange rate between the As If currency and the domestic currency.
If you leave this processing option blank, the system date is used.
6.6.1.2 Versions
- One View Supplier Ledger Inquiry Version
-
Specify the version of One View Supplier Ledger Inquiry program (P042022) that the system uses.
If you leave this processing option blank, the system uses version ZJDE0001.
- One View G/L Inquiry Version
-
Specify the version of One View G/L Inquiry program (P09219) that the system uses.
If you leave this processing option blank, the system uses version ZJDE0001.
6.6.2 Special Processing
One View Supplier Payment Inquiry has the following special processing:
-
As-If Currency conversions are available.
-
There are form exits to One View Supplier Ledger Inquiry (P042022) and One View G/L Inquiry (P09219). Versions are specified in the processing options.
-
Payment amounts have been multiplied by -1 on all report charts to show them with a positive sign.
6.6.3 Reports
The reports delivered with the One View Supplier Payment Inquiry application are:
-
Payments
-
Payment Trends
-
Payment Discounts
-
Payment Analysis
6.6.3.1 Payments
This report enables you to view how your payments are spread across many different entities such as business unit, suppliers, bank accounts, and category codes. You can review the payments for multiple companies to see how much activity all of your business units have or just focus in on one company at a time. You can also view for a specific fiscal year/period or for multiple fiscal years/periods. Category code 1 is included on this report so you can view the data based upon its value.
This report contains the following components:
-
Payments by Business Unit (horizontal bar graph)
-
Top 10 Suppliers by Payments (horizontal bar graph)
-
Payments by Supplier (table)
-
Payments by Bank Account (pie chart)
-
Payments by Category Code 1 (pie chart)
-
Payments (detail table)
The Payments table component contains drill back functionality as described in the following table:
| Functionality | Value |
|---|---|
| Table column containing drill back link | Payment Number |
| Table columns passed to application | Payee Number |
| Application called | A/P Manual Payments (P0413M) |
| Form called | W0413MB |
| Version called | ZJDE0001 |
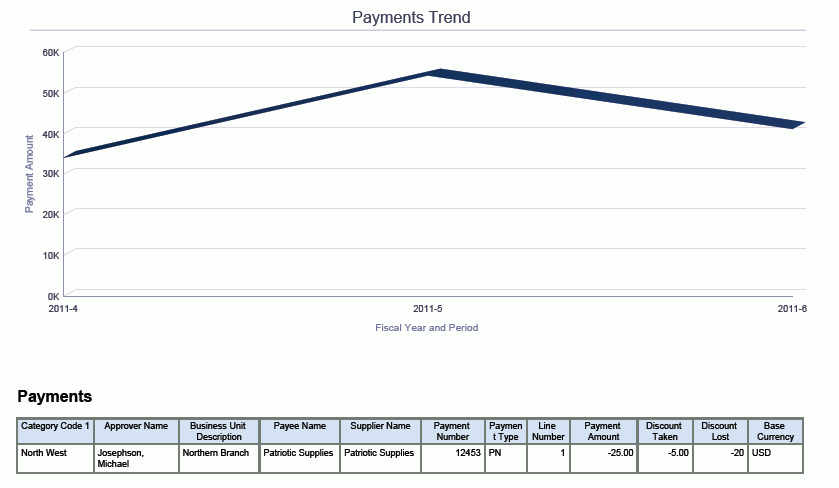
6.6.3.2 Payment Trends
This report enables you to view your payment trends for multiple fiscal years and periods across business units, suppliers, bank accounts, and category codes. Use this report to understand how your normal process affects the trends for payments or see the trends for specific suppliers and business units. You can make informed decisions regarding your supplier relationships with these trends and make business process changes to make the Accounts Payable process more efficient.
This report contains the following components:
-
Payment Trend by Business Unit (line graph)
-
Payment Trend by Suppliers (line graph)
-
Payment Trend by Bank Account (line graph)
-
Payment Trend by Category Code 1 (line graph)
-
Payments (detail table)
The Payments table component contains drill back functionality as described in the following table:
| Functionality | Value |
|---|---|
| Table column containing drill back link | Payment Number |
| Table columns passed to application | Payee Number |
| Application called | A/P Manual Payments (P0413M) |
| Form called | W0413MB |
| Version called | ZJDE0001 |
6.6.3.3 Payment Discounts
This report enables you to view information on how many discounts you have taken advantage of or lost. You can view this information by supplier, business unit, and category code 1. Using this report, you will have the information you need to determine if your payment process ensures you get the maximum benefit from the discounts offered by your suppliers. You can view this information for multiple companies, business units, or suppliers. After you see the broader view of the information, you can revise your data selection to just include those companies, business units, or suppliers you want to focus on. Category code 1 is included in this report so you can view the data based on its value as well.
This report contains the following components:
-
Discounts by Supplier (horizontal bar graph)
-
Discount Taken by Business Unit (bar graph)
-
Discount Lost by Business Unit (bar graph)
-
Discount Taken by Category Code 1 (pie chart)
-
Discount Lost by Category Code 1 (pie chart)
-
Payments (detail table)
The Payments table component contains drill back functionality as described in the following table:
| Functionality | Value |
|---|---|
| Table column containing drill back link | Payment Number |
| Table columns passed to application | Payee Number |
| Application called | A/P Manual Payments (P0413M) |
| Form called | W0413MB |
| Version called | ZJDE0001 |
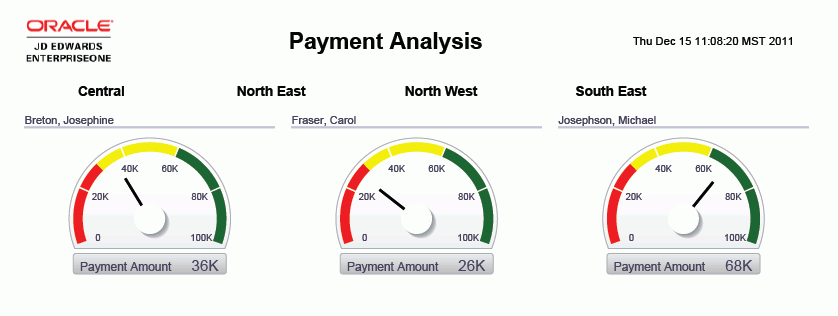
6.6.3.4 Payment Analysis
This report enables you to fully analyze your payments. You can analyze your payments by Approver, Region (address book category code 1), Business Unit, Payee, Supplier, and Bank Account. See information on discounts taken and lost or a trend of your payments over a period. Use this report to fully understand how your payment process affects your business. View the data for multiple companies and business units or focus on a single business unit or region. This analysis can be done for multiple fiscal years, periods, or both.
This report gives you complete control over the information shown in the graphs and table by providing filtering by Region (address category code 1). This report contains the following components:
-
Payment Amount by Approver (gauges)
-
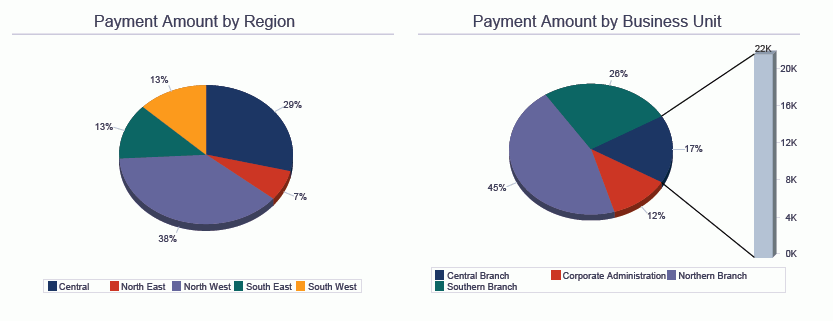
Payment Amount by Region (pie chart)
-
Payment Amount by Business Unit (pie chart)
-
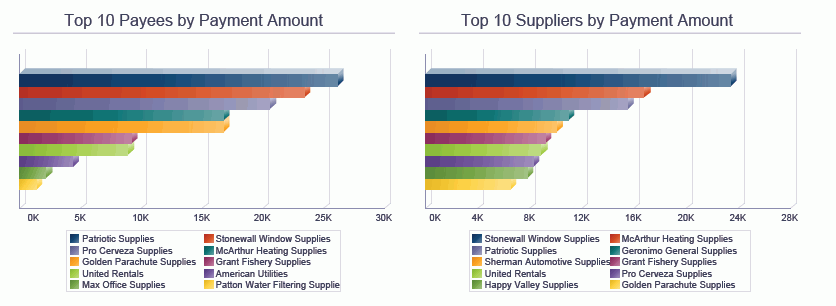
Top 10 Payees by Payment Amount (horizontal bar graph)
-
Top 10 Suppliers by Payment Amount (horizontal bar graph)
-
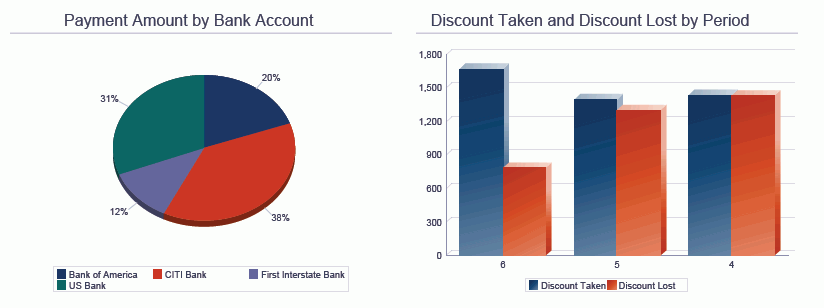
Payment Amount by Bank Account (pie chart)
-
Discount Taken and Discount Lost by Period (bar graph)
-
Payments Trend (line graph)
-
Payments Detail (table)
The Payments Detail table component contains drill back functionality as described in the following table:
| Functionality | Value |
|---|---|
| Table column containing drill back link | Payment Number |
| Table columns passed to application | Payee Number |
| Application called | A/P Manual Payments (P0413M) |
| Form called | W0413MB |
| Version called | ZJDE0001 |
The following report was generated by selecting a large group of suppliers for company 00001 for periods four through six of fiscal year 11. It shows the user a broad view of the Payment activity across the periods.