Environmental Reporting
Environmental Reporting Overview
JD Edwards EnterpriseOne Environmental Accounting and Reporting includes the following dashboards, which report source usage, emissions data, carbon disclosure, and Key Performance Indicators (KPI) measures for organizations:
-
Emissions
-
Energy
-
Metrics
-
Reporting
-
Summary
-
Test Dashboard
-
Transactions
-
Usage
Configuring the Emissions Reporting Unit of Measure Used in Dashboards
JD Edwards EnterpriseOne Environmental Accounting and Reporting enables you to choose and configure a unit of measure for report emissions in the dashboards. Initially, the emissions UOM defaults to KG (Kilograms), with a UOM Conversion of 1. To view the emissions data using a different reporting UOM in the dashboards:
-
Define the desired UOM and the UOM Conversion Factor with respect to KG (Kilograms) in the data warehouse table GHG_SOURCE_APPLICATIONS_W. For more information, refer to the section titled "Setting Up Data Warehouse" in JD Edwards EnterpriseOne Environmental Accounting and Reporting Installation Notes for Business Intelligence and Data warehouse.
-
Clear the existing data in the Environmental Data Warehouse and clear the Oracle Business Intelligence cache.
-
Re-run the ETLs.
For example, to report emissions in Tons, update the data in the column 'CO2_E_UOM' to 'T' and data in the column 'CONVERSION_FACTOR' to 0.001 in the Data Warehouse table GHG_SOURCE_APPLICATIONS_W.
Understanding the Emissions Dashboard
The Emissions dashboard displays a summary of emissions by scope and by source for the whole organization in the default organization hierarchy. The summary is shown by year and by month for a selected year. You can set up reporting thresholds for emissions for your organization. When the emissions are below the threshold, then a green indicator appears on the report. When the emissions are above the threshold, then a red indicator appears on the report.
To view the Emissions page
-
Navigate to OBIEE Dashboards. Click Emissions. The Emissions page appears.
-
The following reports display in the Summary tab:
-
Emissions History: A graphical representation of the history of the carbon emissions by the organization.
-
Emissions by Year report: Displays emissions for a selected year for an organization. Select a Year for which you want to view the emissions. The following sub reports appear for the organization:
-
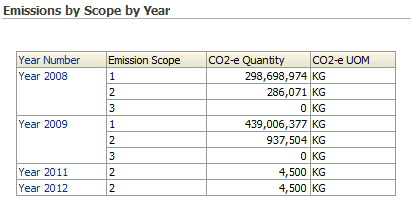
Emissions by Scope by Year: A tabular representation of the emissions of the organization by scope for the selected year.
-
Year Number
-
Emission Scope is the scope of the emissions by the organization.
-
CO2-e Quantity is the quantity of emissions by the organization.
-
CO2-e UM is the unit of measure in which the emissions are measured.
-
-
-
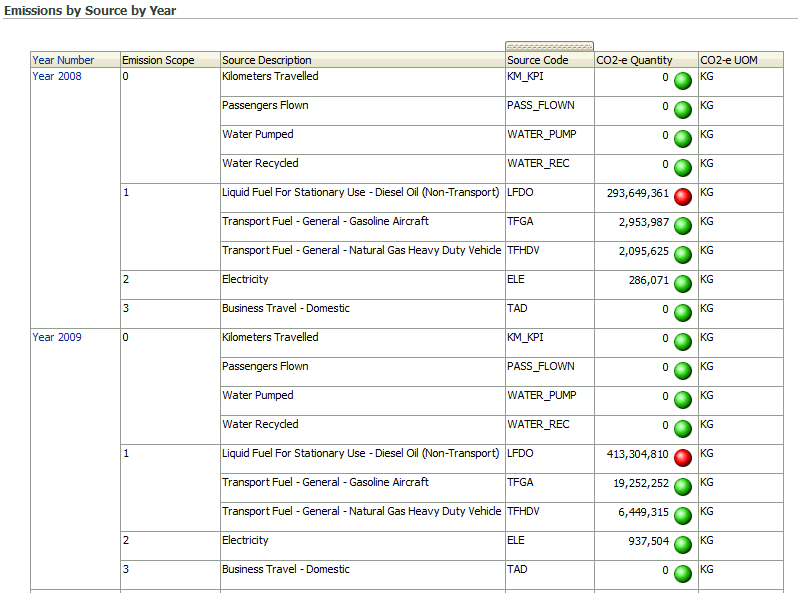
Emissions by Source by Year report: A tabular representation of the emissions of the organization by source for the selected year.
-
Year Number
-
Emission Scope is the scope of the emissions by the organization.
-
Source Description is a brief description of the source of emissions.
-
Source Code is the code for the source of the emissions.
-
CO2-e Quantity is the quantity of emissions by the organization.
-
CO2-e UM is the unit of measure in which the emissions are measured.
-
-
-
The following reports display in the Emissions by Scope Tab:
-
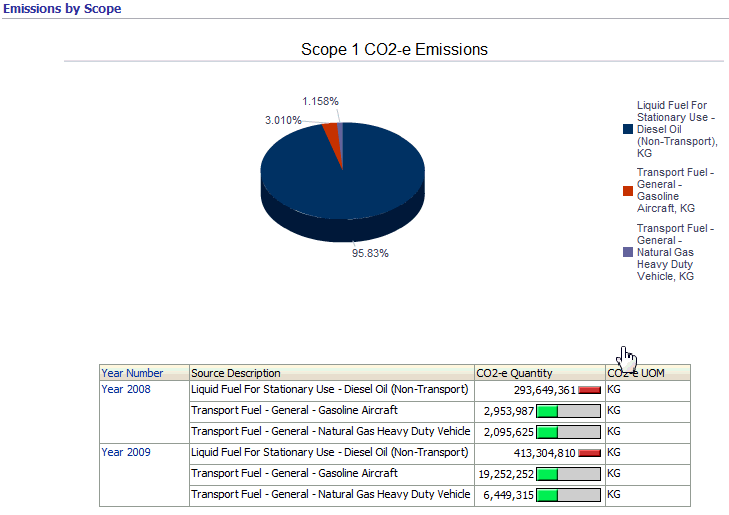
Emissions by Scope report: A graphical representation of the emissions of the organization by scope for the selected year. This report displays 3 graphs, one for each scope. The emission data also displays in a tabular report with the following fields:
-
Year Number
-
Source Description is a brief description of the source of emissions.
-
Quantity is the quantity of emissions by the organization.
-
CO2-e UM is the unit of measure in which the emissions are measured.
-
-
-
The following reports appear in the Emissions by Source Tab:
-
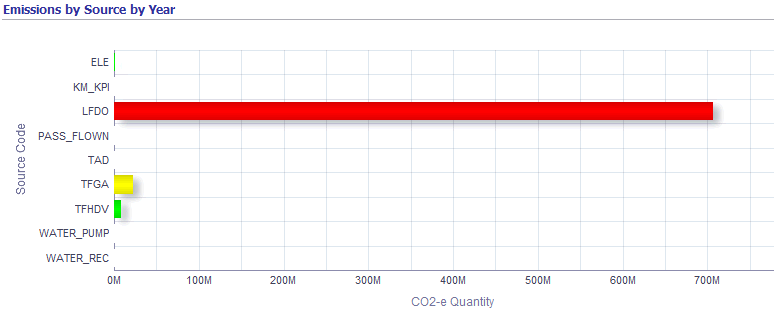
Emissions by Source report: A graphical representation of the emissions of the organization by source. You can select the year and an emission for which you want to view the emissions. The emission data also appears in a tabular report, which includes the following fields:
-
Year Number
-
Emission Scope is the scope of the emissions by the organization
-
Source Description is a brief description of the source of the emissions.
-
Source code is the code for the emission source.
-
CO2-e Quantity is the quantity of emissions by the organization.
-
CO2-e UM is the unit of measure in which the emissions are measured.
-
-
-
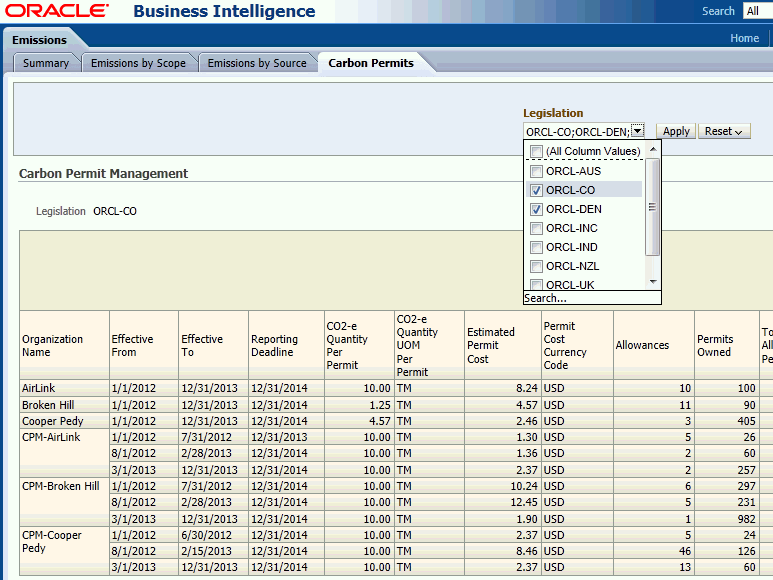
Click the Carbon Permits tab.
-
In the Legislation field, select those governing bodies for which you want to generate reports. Click Apply.
A report displays for each legislation, listing the organizations within the legislation and the CO2-equivalent quantity for each scope within each organization. You can sort the report using the following parameters:
-
Reporting Deadline
-
Permit effective dates
-
CO2-equivalent quantity per permit
-
Estimated permit cost
-
Allowances (free permit allowances granted)
-
Permits owned
-
Total allocated permits (permits owned plus allowances)
-
Permits required
-
Permits to be purchased
-
Permits for sale
-
Total potential cost/revenue
For more information about carbon permit management, refer to Setting Up Carbon Permit Management (P79A80).
-
-
To download the report data in a variety of formats, click the Export link at the bottom of the page.
Understanding the Energy Dashboard
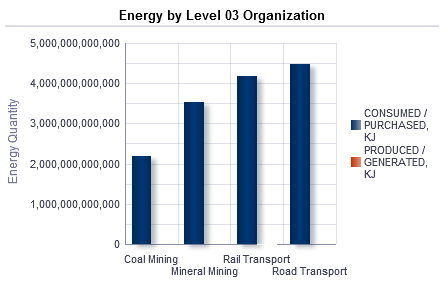
The Energy dashboard displays the energy consumed at the individual hierarchy levels of an organization for the selected year.
To view the Energy page
-
Navigate to OBIEE Dashboards. Click Energy. The Energy page appears.
-
In the Year field, select the year for which you want to view the energy consumption.
-
The Energy by Year report displays the energy consumed at the organization's levels 01, 02, 03, and 04, depending on its hierarchy.
-
Click on a bar in one of the Energy by Level 01, 02, 03, or 04 Organization bar charts.
This enables you to view the Energy by Selected Year table, which provides a breakdown of the energy quantity consumed or purchased per year by the lowest level organization.

-
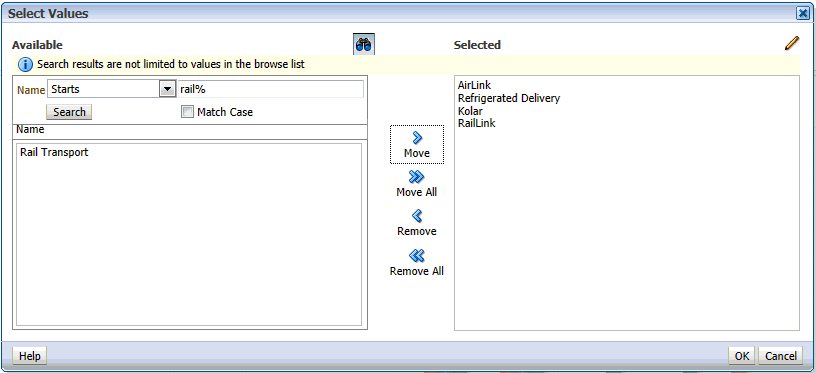
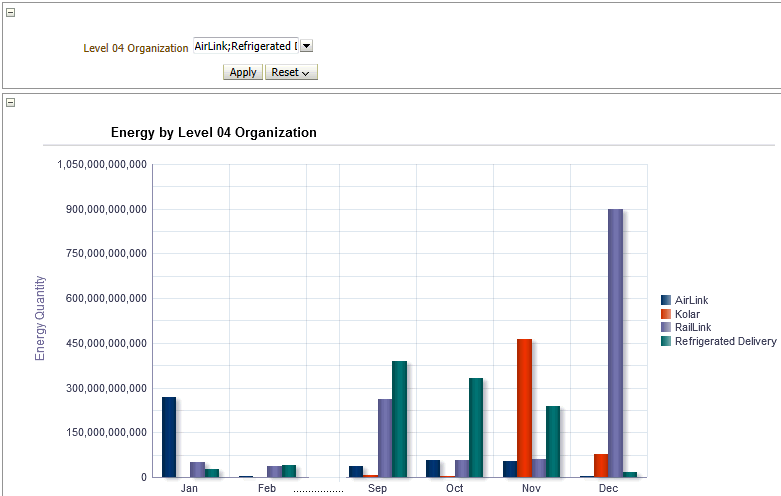
In the Level 04 Organization field, select one or more facilities for which to display energy usage by month.
Select Search access the Select Values window where you can narrow the list of facilities using search criteria, then select them.
Note: Since this chart has the potential to become very large, the top ten energy consuming level 04 facilities are shown by default.
To view the Usage Costs
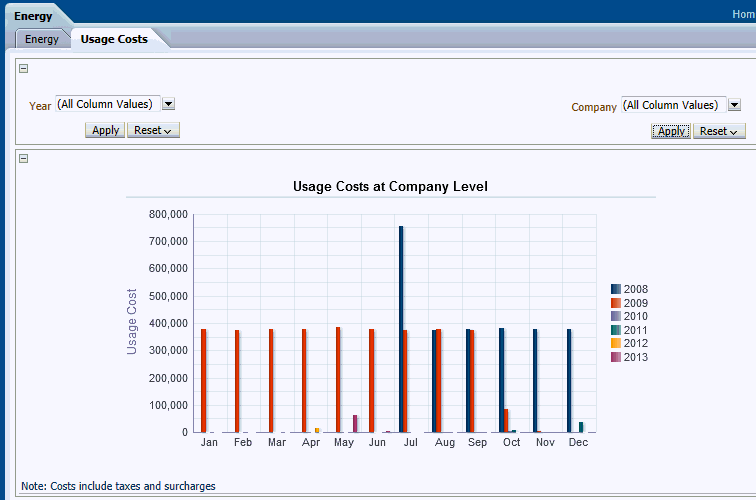
Use the Usage Costs tab within the Energy Dashboard to display the energy usage costs for one or more selected years and for one or more selected companies.
-
In the Energy page, select the Usage Costs tab.
-
In the Year field, select one or more years, then click Apply.
Tip: In the Year field, at the bottom of the list of years, you can select Search to narrow the list of years available for selection.
-
In the Company field, select one or more companies, then click Apply.
Tip: In the Company field, at the bottom of the list of companies, you can Select Search to narrow the list of companies available for selection.
-
The Usage Costs at Company Level report displays the cost of the energy used or purchased by the selected companies each month for the selected years.
-
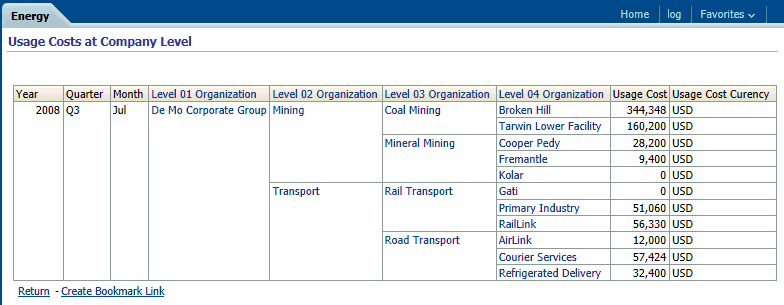
Click on a bar in the Usage Costs at Company Level report.
This enables you to view the Usage Costs at Company Level table, which provides a breakdown of the energy cost per year at the lowest level organization.
Understanding the Metrics Dashboard
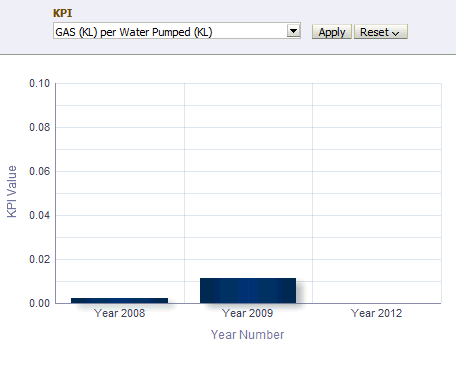
You can define Key Performance Indicators (KPIs) within the JD Edwards EnterpriseOne Environmental Accounting and Reporting application to capture metrics relevant to an organization. Refer to the “Defining Key Performance Indicators” topic in the Setting Up chapter for more information. When you set up the KPIs, the EAR application calculates the metrics using the transactions of the sources that are included in the numerator and denominator of the KPI definition and displays the results in the Metrics dashboard. For example, you can define a KPI to calculate and report the amount of emissions per distance travelled, or the amount of energy used per employee, or the amount of fuel consumed per volume of water pumped.
To view the Metrics page
-
Navigate to the OBIEE Dashboards. Click Metrics. The Metrics page appears.
-
Select the KPI and the Year for which you want to view the metrics. The following reports display:
-
A bar chart displays the KPI values for the organization for the selected year.
-
A graph displays the KPI values for the organization across the months of the selected year.
-
Understanding the Reporting Dashboard
Based on the default organization hierarchy, the Reporting dashboard displays the top four levels of the organization structure. This dashboard also includes organizations that maintain operational control. It also includes the names of the parties that might be interested in the organization.
Note: The pre-built OBIEE dashboards use 01 Level Organization, 02 Level Organization, 03 Level Organization, and 04 Level Organization as the default nomenclature to represent the four levels of the Organization Structure set in the Reporting Parameters. However, you can choose to rename them based on your business needs.
To view the Reporting dashboard
-
Navigate to the OBIEE Dashboards. Click Reporting. The Reporting page appears.
-
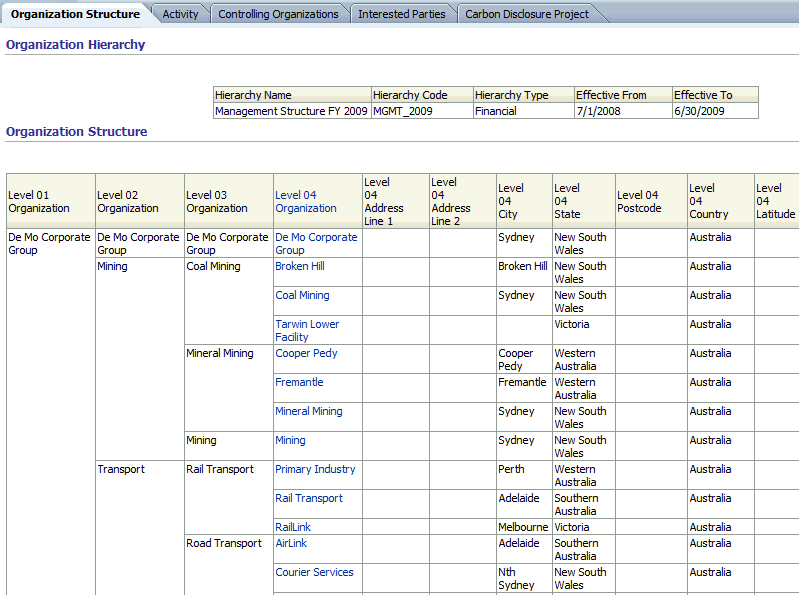
The following reports display for the organization in the Organization Structure tab
-
Organization Hierarchy: The report displays the following fields:
-
Hierarchy Name is the name of the organizational hierarchy.
-
Hierarchy Code is the code for the organizational hierarchy.
-
Hierarchy is the type of the organizational hierarchy.
-
Effective From is the date from which the organizational hierarchy is effective.
-
Effective To is the date to which the organizational hierarchy is effective.
-
-
Organization Structure: The report displays the Name, Address, GPS co-ordinates, and the Industry Group Codes for the top four levels of the organization. You can click on the name of a level 4 organization to view details of further levels of the organization hierarchy.
-
Organizations with Operational Control: The report displays the details of organizations that have operational control on the organization.
-
Level 4 Organization is the name of the facility on which an organization has operational control.
-
Control Type Description is the type of operational control an organization has on the facility.
-
Effective Date From is the effective start date for the controlling organization’s operational control on the facility.
-
Effective Date To is the effective end date for the controlling organization’s operational control on the facility.
-
Controlling Organization is the name of the organization that has operational control over the facility.
-
CEO Name is the name of the CEO of the controlling organization.
-
Company Identifier is a code for the controlling organization.
-
Address Line 1, Address City, Address State, Address Postcode and Address Country display the address of the controlling organization.
-
-
Interested Parties: The report displays the details of other organizations interested in the current organization.
-
Level 4 Organization is the name of the facility in which other organizations are interested.
-
Interest Type Description is the type of interest an organization has on the facility.
-
Effective Date From is the effective start date for the interested organization’s interest in the facility.
-
Effective Date To is the effective end date for the interested organization’s interest in the facility.
-
Interested Organization is the name of the organization that has interest in the facility.
-
CEO Name is the name of the CEO of the interested organization.
-
Company Identifier is a code for the interested organization.
-
Address Line 1, Address City, Address State, Address Postcode, and Address country display the address of the interested organization.
-
-
-
The following reports appear in the Activity tab for the selected organization. Select the Year and the Level 04 Organization for which you want to view activity details.
-
Organization Details: The report displays the details of the selected facility depending on the organization hierarchy for the selected year.
-
Level 01 Organization, Level 02 Organization, and Level 03 Organization fields display the names of the organizations in the top three levels of the organization hierarchy.
-
Level 04 Organization is the name of the Level 04 Organization in the hierarchy.
-
Level 04 Address Line 1, Level 04 Address Line 2, Level 04 Address Level 04 City, Level 04 Address State, Level 04 Address Postcode, and Level 04 Address Country fields display the address of the facility.
-
Level 04 latitude and Level 04 Longitude fields display the GPS co-ordinates for the facility.
-
Level 04 Industry Group Code is the industry group code for the Organization at Level 4 of the hierarchy.
-
-
Activity Summary: The report displays the details of all the activities of the Level 04 organization depending on the organization hierarchy.
-
State is the name of the state in which the organization is located.
-
Month is the month for which the activity is recorded.
-
Emission Scope is the scope for the emissions by the facility.
-
Parent Source Description.
-
Child Source Description.
-
Activity Type Description is a description of the activity.
-
Source Code is the code for the emissions source.
-
Source Description is a brief description of the emissions source.
-
Activity is the name of the activity.
-
Activity Description is the brief description of the activity.
-
Measurement Criteria: Refer to the “Defining User Defined Codes” topic for information on measurement criteria.
-
Usage Quantity is the quantity of the source used by the organization.
-
Usage UM is the unit of measure in which the source usage quantity is measured.
-
-
Activity for Organizations with Operational Control: The report displays the details of the activities of the facility that have operational control.
-
Activity for Organizations without Operational Control: The report displays the details of those activities of the facility that do not have operational control.
-
-
The following reports appear for the organizations listed in the Controlling Organizations tab. Select the Year and the Controlling Organization (facility) for which you want to view activity details. All organizations that are defined as Controlling Organizations in the organization setup display in the list of values.
-
Activities: The report displays a list of all activities of the facility that the Controlling Organization has control on, depending on their effective dates of control.
-
State is the name of the state in which the facility is located.
-
Month is the month for which the activity is recorded.
-
Emission Scope is the scope for the emissions by the facility.
-
Source Code is the code for the emissions source.
-
Source Description is a brief description of the emissions source.
-
Activity Type Description is a description of the activity type.
-
Parent Source Description.
-
Child Source Description.
-
Measurement Criteria. Refer to “Defining User Defined Codes” topic for information on measurement criteria.
-
Usage Quantity is the quantity of the source used by the facility.
-
Usage UM is the unit of measure in which the source usage quantity is measured.
-
-
-
The following reports appear for the organization in the Interested Parties tab. Select the Year and the Interested Organization (facility) for which you want to view activity details. The Interest Type displays. All organizations that are defined as Interested Parties in the organization setup display in the list of values.
-
Activities: The report displays a list of all activities of the facility that the Interested Organization has interest in depending on their effective dates of interest.
-
State is the name of the state in which the facility is located.
-
Month is the month for which the activity is recorded.
-
Emission Scope is the scope for the emissions by the facility.
-
Source Code is the code for the emissions source.
-
Source Description is a brief description of the emissions source.
-
Activity Type Description is a description of the activity type.
-
Measurement Criteria. Refer to “Defining User Defined Codes” topic for information on measurement criteria.
-
Usage Quantity is the quantity of the source used by the facility.
-
Usage UM is the unit of measure in which the source usage quantity is measured.
-
-
-
The Carbon Disclosure Project displays a selection of questions related to the carbon disclosure project and is presented with the answers derived from the data available to the EAR. Select the Calendar, Year, and Organization Hierarchy for which you want to view the Carbon Disclosure Project report.
Note: In the Carbon Disclosure Project (CDP) dashboard page, Company refers to the Level 01 Organization, Division refers to the Level 02 Organization, and Facility refers to the Level 04 Organization in the Organization Hierarchy. The Level 03 Organization is not used for the CDP.
Understanding the Summary Dashboard
The Summary dashboard page summarizes high level information and compares carbon equivalent emission and energy for related activities for the following parameters:
-
Organization Hierarchy
-
Calendar Type by Year
For a selected year, the CO2-e emissions are reported by organization and displayed in a bar chart, pie chart, and in a table. You can set up reporting thresholds for emissions for your organization using the conditional formatting and other features of the Oracle Business Intelligence Enterprise Edition (OBIEE).
To view the Summary page
-
Navigate to OBIEE Dashboards. Click Summary. The Summary page appears.
-
Select the Year for which you want to view the emissions and energy consumption information. The default Organizational Hierarchy and Calendar appears. The following reports appears:
-
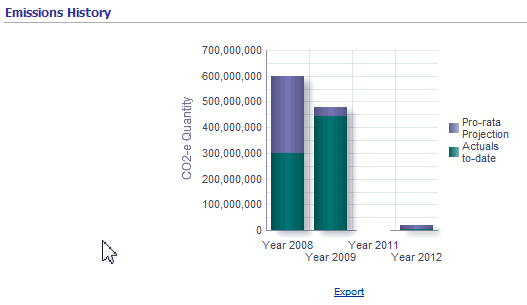
Emissions History: A graphical representation of the history of the carbon emissions by year for the organization.
-
Energy Consumption History: A graphical representation of the history of energy consumed by year for the organization.
-
Emissions by Organization: Displays the carbon emissions by each facility of the organization. This report displays as a graph, a pie chart, and a table.
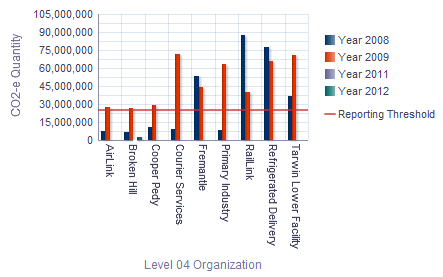
The following fields display in the table:
-
Level 04 Organization is the name the organization.
-
CO2-e Quantity is the quantity of the carbon equivalent of the emissions from the organization.
-
CO2-e UM is the unit of measure in which the carbon emissions are measured.
-
CO2-e Quantity % is the percentage of carbon emitted by the facility, of the total emissions by the organization.
-
-
Understanding the Targets Dashboard
The Targets Dashboard provides reports that display environmental data versus targets established for the selected organizations. The actual results and targets display by month for the selected years. Organizations can use these reports to measure and track against their sustainability goals. Use the following tabs to view actual results versus targets:
-
Energy - displays actual energy used by organization level versus the targets established for the selected organizations in GJ. The energy usage and targets display by month for the selected years.
-
Emissions - displays actual emissions by organization level versus the targets set for the selected organizations in KG of CO2-e. The emissions and targets display by month for the selected years.
-
Usage - displays actual energy used by organization level versus the targets established for the selected organizations and parent source in GJ. The energy usage costs and targets display by month for the selected years and, if desired, parent source.
-
Cost - displays the total energy usage costs by organization level versus the targets established for the selected organizations. The energy usage costs and targets display by month for the selected years.
-
KPI-Actuals - displays the actual KPI value for the selected Target Type (Cost, Energy, or Emissions) by organization level versus the KPI target. The KPI values and targets display by month for the selected years.
For more information about setting the energy, emission, usage, and cost target values, refer to Setting Up Organizations (P79A71). For more information about setting KPI target values, refer to Defining KPIs (P79A40).
To view the Energy Usage by Target page
-
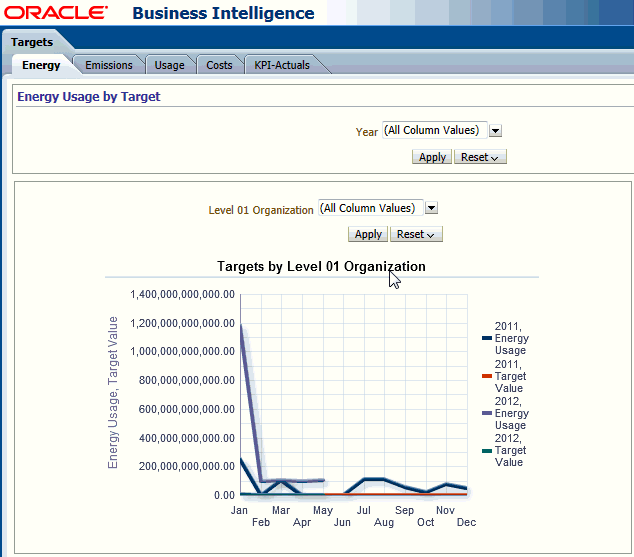
Navigate to OBIEE Dashboards. Click Targets. Click the Energy tab. The Energy Usage by Target page appears.
-
In the Year field, select one or more years to display. Click Apply.
-
The following Energy Usage by Target graphs display energy usage in GJ:
-
Targets by Level 01 Organization
-
Targets by Level 02 Organization
-
Targets by Level 03 Organization
-
Targets by Level 04 Organization
-
-
For each graph, select one or more organizations to display. Click Apply.
Select Search to use search criteria to narrow the list of organizations available for selection.
-
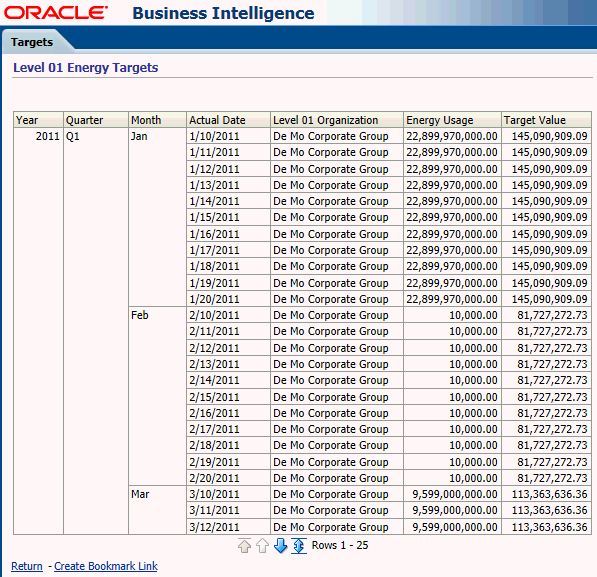
Click on the data label for a graph to display the graph details in a table format.
To view the Emissions by Target page
-
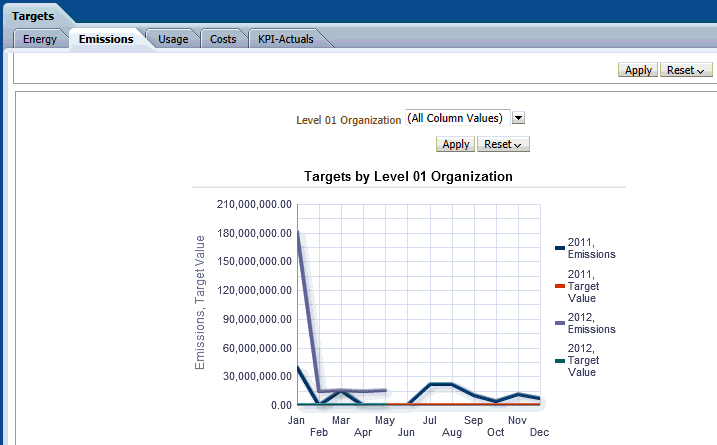
Navigate to OBIEE Dashboards. Click Targets. Click the Emissions tab. The Emissions by Target page appears.
-
In the Year field, select one or more years to display. Click Apply.
-
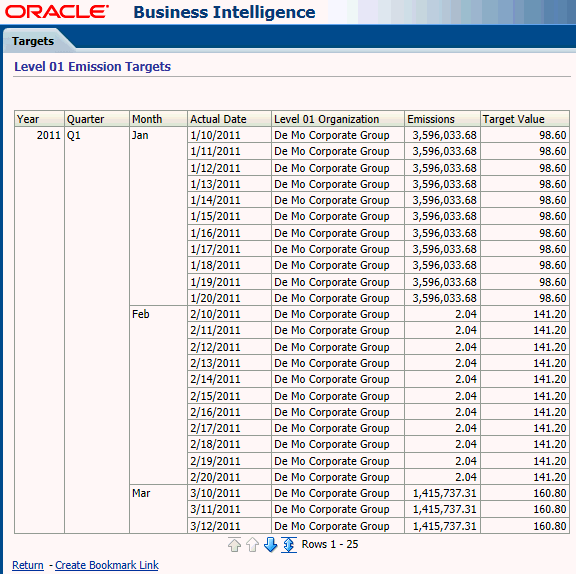
The following Emissions by Target graphs display emissions in KG of CO2-e:
-
Targets by Level 01 Organization
-
Targets by Level 02 Organization
-
Targets by Level 03 Organization
-
Targets by Level 04 Organization
-
-
For each graph, select one or more organizations to display. Click Apply.
Select Search to use search criteria to narrow the list of organizations available for selection.
-
Click on the data label for a graph to display the graph details in a table format.
To view the Usage Target page
-
Navigate to OBIEE Dashboards. Click Targets. Click the Usage tab. The Usage Target page appears.
-
In the Year field, select one or more years to display. Click Apply.
-
In the Parent Source field, select one or more parent sources to display. Click Apply.
-
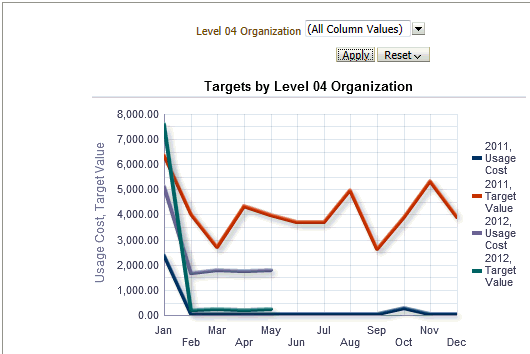
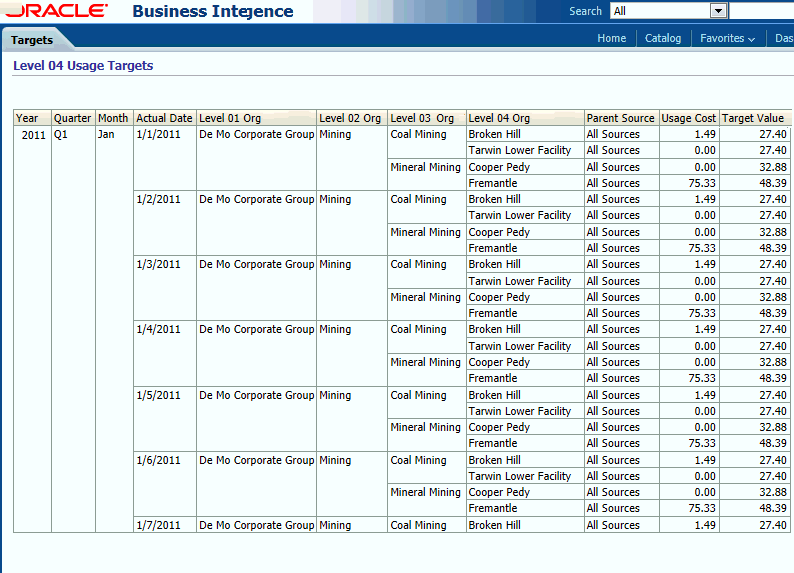
The following Usage Target graphs display energy usage by parent source, year, and organization level in GJ:
-
Targets by Level 01 Organization
-
Targets by Level 02 Organization
-
Targets by Level 03 Organization
-
Targets by Level 04 Organization
-
-
For each graph, select one or more organizations to display. Click Apply.
Select Search to use search criteria to narrow the list of organizations available for selection.
-
Click on the data label for a graph to display the graph details in a table format.
To view the Usage Costs by Target page
-
Navigate to OBIEE Dashboards. Click Targets. Click the Costs tab. The Usage Costs by Target page appears.
-
In the Year field, select one or more years to display. Click Apply.
-
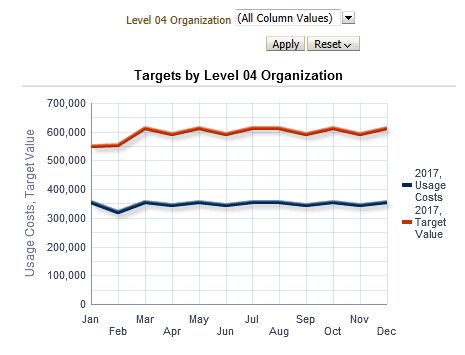
The following Usage Costs by Target graphs display:
-
Targets by Level 01 Organization
-
Targets by Level 02 Organization
-
Targets by Level 03 Organization
-
Targets by Level 04 Organization
-
-
For each graph, select one or more organizations to display. Click Apply.
Select Search to use search criteria to narrow the list of organizations available for selection.
-
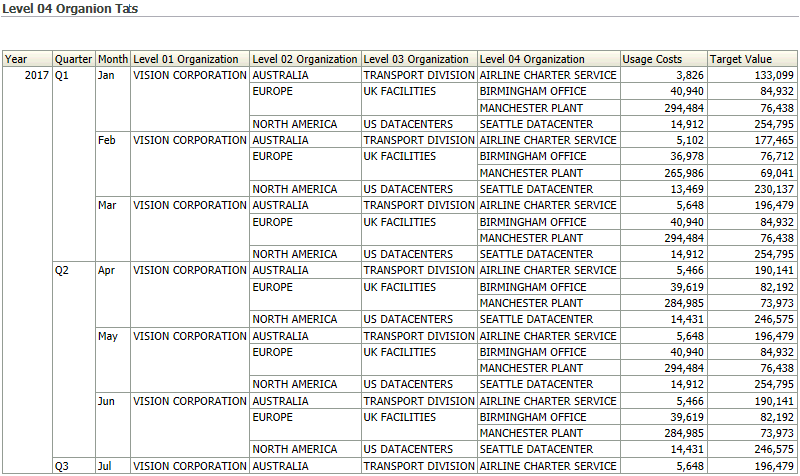
Click on the data label for a graph to display the graph details in a table format.
To view the KPI Values by Target (Actuals) page
-
Navigate to OBIEE Dashboards. Click Targets. Click the KPI-Actuals tab. The KPI Values by Target (Actuals) page appears.
-
In the Year field, select one or more years to display. Click Apply.
-
In the Target Type field, select either the Cost, Energy, or Emissions target type to display. Click Apply.
-
In the KPI field, select one KPI value to display.
-
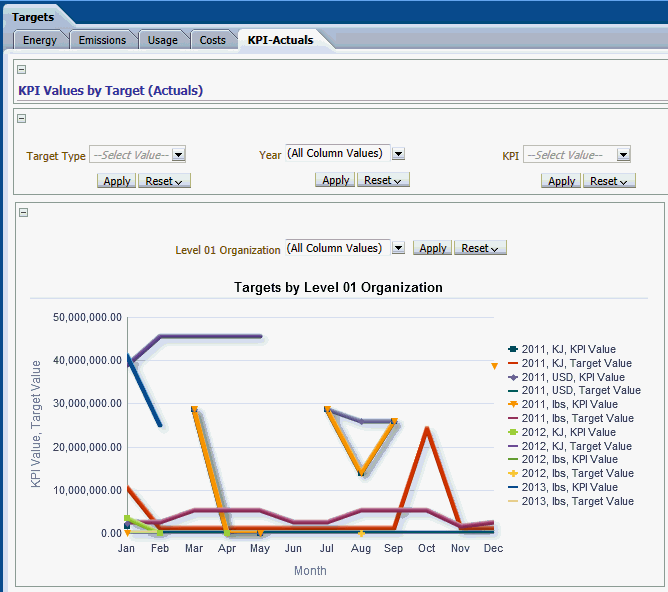
The following KPI graphs display the KPI cost, energy used, or emissions, depending on the Target Type selected:
-
Targets by Level 01 Organization
-
Targets by Level 02 Organization
-
Targets by Level 03 Organization
-
Targets by Level 04 Organization
-
-
For each graph, select one or more organizations to display. Click Apply.
Select Search to use search criteria to narrow the list of organizations available for selection.
-
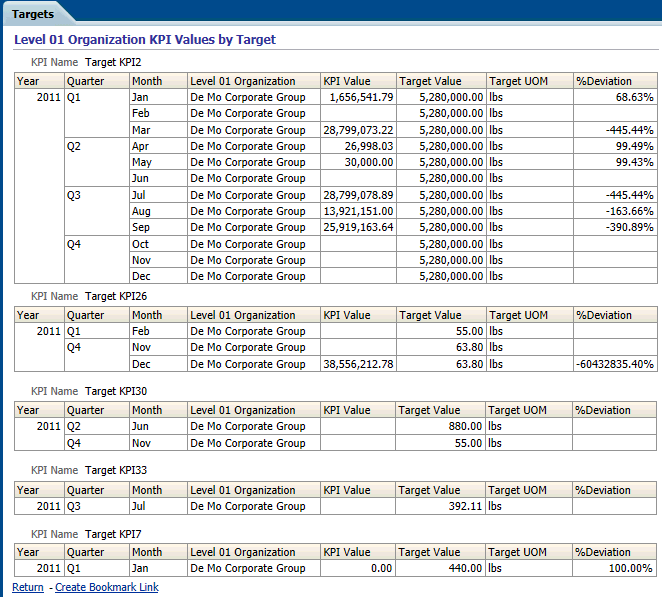
Click on the data label for a graph to display the graph details in a table format.
Understanding the Test Dashboard
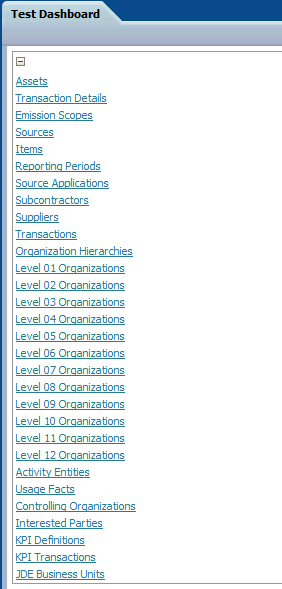
System Administrators use the Test dashboard to review the data collected from source systems and stored in the data warehouse. The Test dashboard provides reports for the following entities:
-
Assets
-
Transaction Details
-
Emission Scopes
-
Sources
-
Items
-
Reporting Periods
-
Source Applications
-
Subcontractors
-
Suppliers
-
Transactions
-
Organization Hierarchies
-
Level 01 Organizations
-
Level 02 Organizations
-
Level 03 Organizations
-
Level 04 Organizations
-
Level 05 Organizations
-
Level 06 Organizations
-
Level 07 Organizations
-
Level 08 Organizations
-
Level 09 Organizations
-
Level 10 Organizations
-
Level 11 Organizations
-
Level 12 Organizations
-
Activity Entities
-
Usage Facts
-
Controlling Organizations
-
Interested Parties
-
KPI Definitions
-
KPI Transactions
-
JDE Business Units
Clicking on the link for a data entity provided on the dashboard, such as Emission Scopes, displays the report for the data element in a new page. If the source for the data warehouse is Oracle E-Business Suite (EBS), then the following links on the Test dashboard, which are irrelevant for Oracle EBS, do not show results:
-
Source Application
-
Subcontractor
-
JDE Business Units
System Administrators can use the Test dashboard to verify the accuracy of the data, for debugging, and for troubleshooting.
To view the Test Dashboard page
-
Navigate to OBIEE Dashboards. Click Test Dashboard.
The Test Dashboard page appears.
-
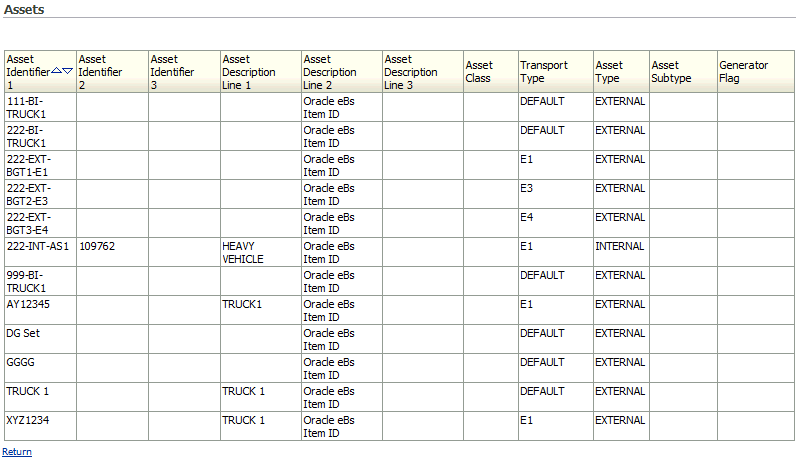
Select one of the report links (Assets, Transaction Details, and so on).
The report displays the data for the entity selected in a new page.
Understanding the Transactions Dashboard
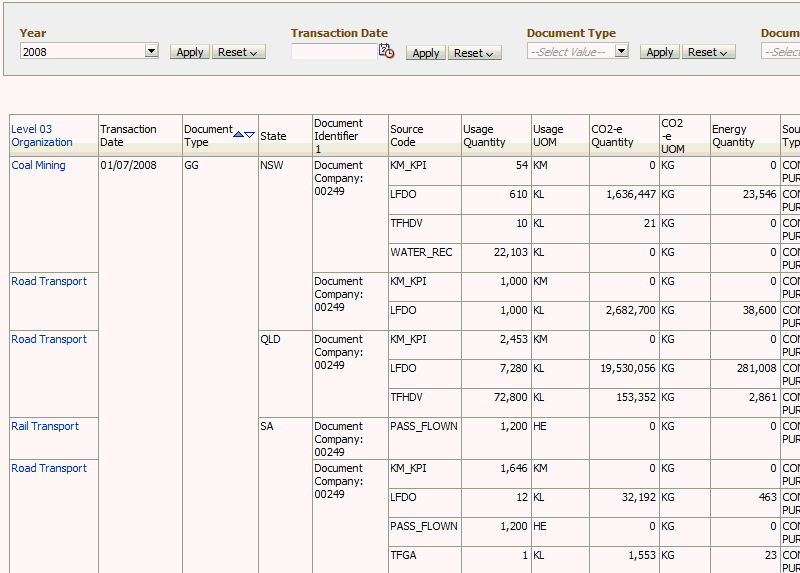
The Transactions dashboard lists the organization's transactions by day and by organization. This dashboard also displays the usage and emissions data for each transaction.
To view the Transactions dashboard
-
Navigate to the OBIEE Dashboards. Click Transactions. The Transactions page appears.
-
Select any of the following search criteria to narrow your results:
-
Year to display transactions in a specific year.
-
Transaction Date to display transactions on a specific date.
-
Document Type is the type of transaction document.
-
Document Identifier is the code for the transaction document.
-
State to display transactions in a specific state.
-
-
Click Go. The following fields appear:
-
Level 03 Organization is the name of the organization at the level 3 of the organization hierarchy.
-
Transaction Date is the date of the transaction.
-
Document Type.
-
State is the state in which the Level 03 Organization is located.
-
Document Identifier is a unique code assigned to a document.
-
Source code is the code for the emissions source.
-
Usage Quantity is the quantity of the source used in the transaction.
-
Usage UM is the unit of measure in which the usage quantity is measured.
-
CO2-e Quantity is the quantity of carbon equivalent emissions due to the transaction.
-
CO2-e UM is the unit of measure in which the CO2-e quantity is measured.
-
Energy Quantity is the amount of energy consumed in the transaction.
-
Source Type is type of source used in the transaction.
-
Energy UM is the unit of measure in which the energy quantity is measured.
-
Understanding the Usage Dashboard
The Usage dashboard displays the source usages for a facility by year and by source.
To view the Usage dashboard
-
Navigate to the OBIEE Dashboards. Click Usage. The Usage page appears.
-
Select any of the following search criteria to narrow your results:
-
Year to display source usages for a facility in a specific year.
-
Level 04 Organization to display source usage for a specific facility.
-
Source Description to display usage for a specific source.
-
-
Click Go. The following fields display:
-
Year Number.
-
Level 04 Organization is the name of the facility.
-
Emission Scope.
-
Source Description is a brief description of the source.
-
Usage Quantity is the quantity of the source used by the facility.
-
Usage UM is the unit of measure in which the usage quantity is measured

-
Understanding the Water and Waste Dashboard
The Water and Waste Dashboard has two tabs:
-
Water – contains reports for the following seeded emissions sources:
-
WATER_CON (Water Consumed)
-
WATER_REC (Water Recycled)
-
-
Waste – contains reports for the following seeded emissions sources:
-
WASTE_LANDFILL (Solid Waste Sent to Landfill)
-
WASTE_REC (Solid Waste Recycled)
-
To view the Water and Waste dashboard
-
Navigate to the OBIEE Dashboards. Click Water and Waste. The Water page appears by default.
-
Select one or more years to narrow your results. Alternatively, select All Column Values to select all years.
-
Click Apply.
-
The following reports appear:
-
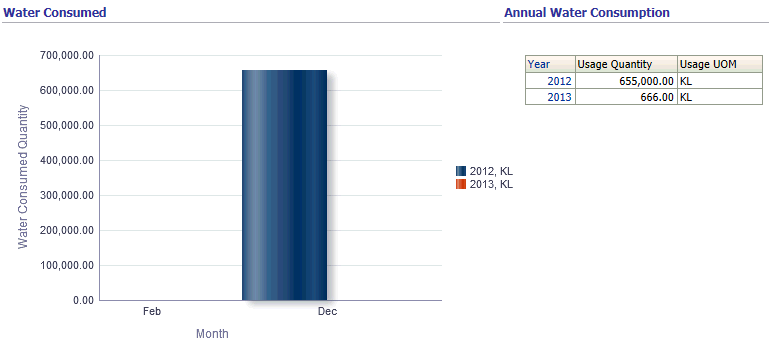
Water Consumed – A graph displays the quantity of water consumed in each month of the year. Each year is represented by a different colored bar within a particular month.
-
Annual Water Consumption – A table lists the quantity of water consumed each year.
-
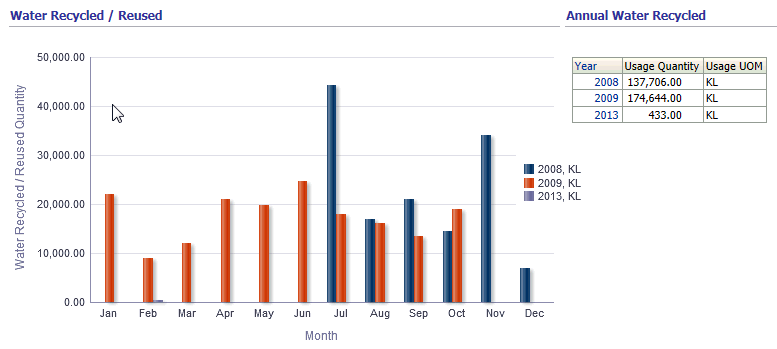
Water Recycled/Reused – A graph displays the quantity of water recycled or reused in each month of the year. Each year is represented by a different colored bar within a particular month.
-
Annual Water Recycled - A table lists the quantity of water recycled each year.
-
-
In the Water Consumed graph, click on one of the bars displaying the quantity of water consumed in a particular month.
A Water Consumed table appears, displaying the following columns for the selected month:
-
Level 01 Organization
-
Level 02 Organization
-
Level 03 Organization
-
Level 04 Organization
-
Water Consumed Quantity
-
Water UOM
-
-
In the Water Recycled/Reused graph, click on one of the bars displaying the quantity of water recycled in a particular month.
A Water Recycled/Reused table appears, displaying the following columns for the selected month:
-
Level 01 Organization
-
Level 02 Organization
-
Level 03 Organization
-
Level 04 Organization
-
Water Recycled/Reused Quantity
-
Water UOM
-
To view the Waste page
-
Click the Waste tab.
-
Select one or more years to narrow your results. Alternatively, select All Column Values to select all years.
-
Click Apply.
-
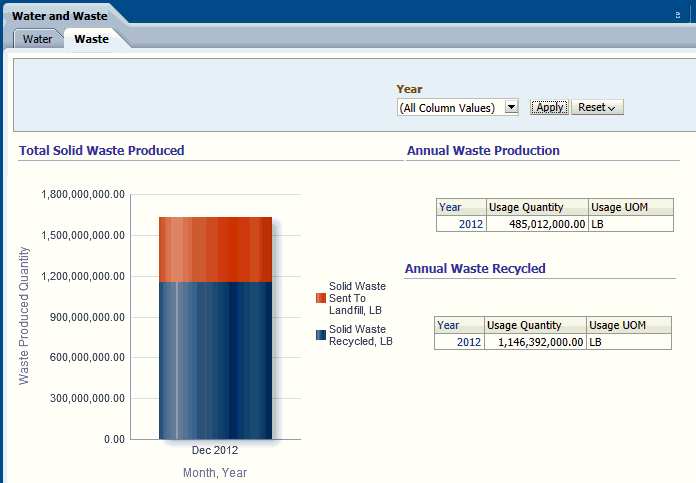
The Total Solid Waste Produced report appears.
This report displays the total quantity of waste produced for each month and year, split into the quantity of waste recycled and the quantity of waste sent to a landfill.
-
In the Total Solid Waste Produced graph, click on the part of the bar displaying either the quantity of waste recycled or sent to a landfill in a particular month.
A Total Solid Waste Produced table appears, displaying the following columns for the selected month:
-
Level 01 Organization
-
Level 02 Organization
-
Level 03 Organization
-
Level 04 Organization
-
Waste Produced Quantity
-
Waste UOM
-