8 Monitoring the Database
As an administrator, you can monitor the activities of the database and its users. You can use this information for tuning, troubleshooting, and more.
This section contains the following topics:
Monitoring Sessions
You can use SQL Developer to monitor the current database sessions. This enables you to determine the users who are currently logged in to the database and what applications they are running.
You can also kill a session—to cause it to be disconnected and its resources to be relinquished.
This section contains the following topics:
Viewing Sessions
To view sessions:
-
In SQL Developer, click Tools, then Monitor Sessions.
-
In the Select Connection dialog box, select a connection to
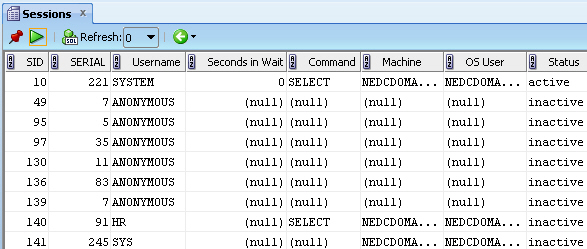
SYSTEM(or another account with full DBA privileges)A Sessions tab is displayed. Figure 8-1 shows part of the display.
See the chapter about monitoring database operations in Oracle Database Administrator's Guide for more information.
-
(Optional) Right-click in any row in the display, and explore the options available as shown in the context menu commands, which include Trace Session, Kill Session, and Find/Highlight (to search for rows in the grid that contain a specified text string).
Killing (Terminating) a Session
You can use SQL Developer to kill (terminate) a database session. This logs off and disconnects the user running the session. If the user is processing a transaction when you kill the session, the transaction is rolled back.
Reasons to kill a session include the following:
-
The session is not responding.
-
You want to perform an administrative function that requires all users to log off first, but the user is not available to end his or her session.
To kill a session:
-
In SQL Developer, click Tools, then Monitor Sessions.
-
In the Select Connection dialog box, select a connection to
SYSTEM(or another account with full DBA privileges) -
Right-click in the row for the session to be terminated, and select Kill Session.
Monitoring the Top SQL Statements
The "top" SQL statements represent the SQL statements that are executed most often, that use more system resources than other SQL statements, or that use system resources more frequently than other SQL statements. Viewing the top SQL statements reports that are available in SQL Developer enables you to focus your SQL tuning efforts on the statements that can have the most impact on database performance.
See Oracle Database Performance Tuning Guide for a discussion of tuning SQL statements.
Note:
Some of the statements that appear in the top SQL statements report may be from Oracle Database XE internal operations, including automatically scheduled internal database jobs (such as statistics gathering jobs).To monitor the top SQL statements:
-
In SQL Developer, click the Reports navigator tab, and expand the hierarchy as follows: All Reports, then Data Dictionary Reports, then Database Administration, then Top SQL.
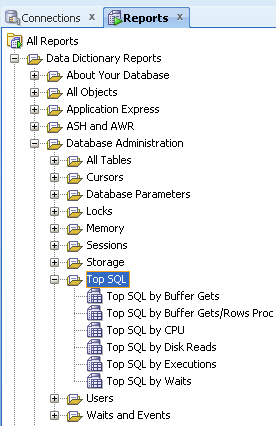
Description of the illustration top_sql_reports.jpg
-
Under Top SQL, select any of the listed "Top SQL by" reports: Buffer Gets, Buffer Gets/Rows Proc, CPU, Disk Reads, Executions, or Waits.
If you are asked to select a connection, select one for
SYSTEMforSYS AS SYSDBAEach available report lists the top SQL statements in that category, with the following information for each statement: SQL (the SQL statement), CPU_Seconds, Disk_Reads, Executions, Buffer_gets/rows_proc, Buffer_gets/executions, Elapsed_Seconds, Module.
Monitoring Long Operations
The Active Sessions report in SQL Developer lists active sessions and include the current "up time" for each, which you can check to see if any are running much longer than you would expect.
To monitor long operations:
-
In SQL Developer, click the Reports navigator tab, and expand the hierarchy as follows: All Reports, then Data Dictionary Reports, then Database Administration, then Sessions.
-
Under Sessions, select Active Sessions.
If you are asked to select a connection, select one for
SYS AS SYSDBA. -
Check the UP_TIME value for each listed session, and note any that you consider to be longer than desired or expected.