20 Monitoring Human Workflow Service Components and Engines
This chapter describes how to monitor human task service components and the human workflow service engine.
This chapter includes the following topics:
-
Section 20.1, "Monitoring Human Task Service Component Instances and Faults"
-
Section 20.3, "Monitoring Human Task Service Component Instances"
-
Section 20.4, "Monitoring Human Workflow Service Engine Instances and Faults"
-
Section 20.5, "Monitoring Human Workflow Service Engine Active Requests and Operation Statistics"
-
Section 20.6, "Monitoring Human Workflow Service Engine Instances"
-
Section 20.7, "Monitoring Deployed Human Workflows in the Service Engine"
For more information, see the following sections:
20.1 Monitoring Human Task Service Component Instances and Faults
You can monitor recent instances and faults for human task service components. Each service component in a SOA composite application has its own instance ID. These IDs are different from the overall instance ID of the SOA composite application of which each service component is a part.
To monitor human task service component instances and faults:
-
Access this page through one of the following options:
From the SOA Infrastructure Menu... From the SOA Folder in the Navigator... - Select Home.
-
Select the Deployed Composites tab.
-
In the Composite section, select a specific SOA composite application.
- Under soa-infra, select a specific SOA composite application.
-
Select the human task service component in the Component Metrics table.
The upper part of the Dashboard page displays the following details:
-
Recent instances of the human task service component, including the instance ID of the service component, the state of the instance (for example, completed or running), the instance start time, the last modification time, and links to log files describing the instances.
-
Recent faults in the human task service component, including the error message, whether the fault is recoverable, the time at which the fault occurred, the instance ID of the human task service component, and links to log files describing the faults.
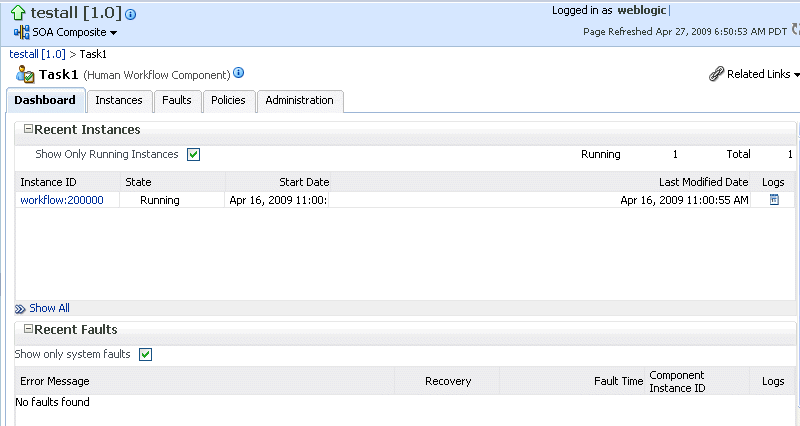
Description of the illustration hwf_comp_dash_upper.gif
-
-
In the Recent Instances section, perform the following tasks:
-
In the Instance ID column, click an instance ID for a service component to monitor the current status of a task on which approval actions are being taken.
-
In the Logs column, click a specific log to access the Log Messages page with filtered messages specific to that instance.
-
Click Show All below the section to access the Instances page of the service component.
-
-
In the Recent Faults section, perform the following tasks:
-
In the Error Message column, click an error message to display complete information about the fault. If the fault is identified as recoverable, click the Recover Now link to perform fault recovery.
-
In the Recovery column, click a fault identified as Recoverable to perform fault recovery at the component instance level.
-
In the Logs column, click a specific log to access the Log Messages page with filtered messages specific to that instance.
-
Click Show All below the section to access the Faults page of the service component.
The lower part of the Dashboard page displays the following details:
-
A graphical representation of business outcomes.
-
Assignees that take the longest time to respond to and act upon tasks.
-
The number of successful, faulted, and instantiated instances processed per minute. Click Table View to display throughput details for the last five minutes, including the throughput for successful instances, the total faults throughput, and the instance throughput.
-
The notification channels used for task approval in the human task service component.
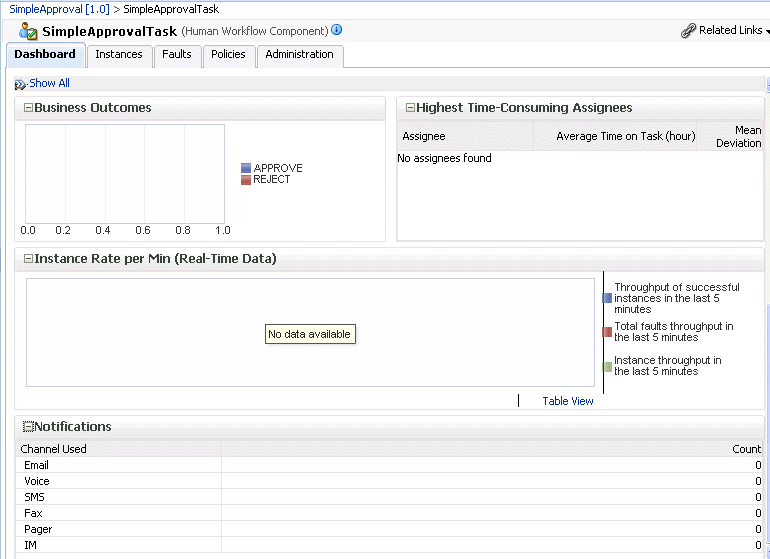
Description of the illustration hwf_comp_dash_lower.gif
-
For more information, see Section 1.2.3, "Introduction to SOA Composite Application Instances" and Oracle Fusion Middleware Administrator's Guide for details about viewing and searching log files.
20.2 Viewing the Status of Human Workflow Tasks
You can monitor the current status of human workflow tasks being acted upon by participants.
To view the status of human workflow tasks:
-
Access this page through one of the following options:
From the SOA Infrastructure Menu... From the SOA Folder in the Navigator... - Select Home.
-
Select the Deployed Composites tab.
-
In the Composite section, select a specific SOA composite application.
- Under soa-infra, select a specific SOA composite application.
-
Select the human task service component in the Component Metrics table.
The Dashboard page appears.

Description of the illustration hwf_comp_dash_upper.gif
-
In the Instance ID column, click an instance ID of a service component to monitor the current status of a task on which approval actions are being taken.
The Task Details page displays the following details:
-
Task details about the selected service component instance ID (task number), including the current state (for example, assigned), task outcome (if completed), task priority, creation date, updated date, expiration date, and task assignee.
-
A flow of the current status of a task (for example, assigned or approved).

Description of the illustration hwf_mon_taskdetails.gif
As the task is acted upon by participants, the flow is updated.
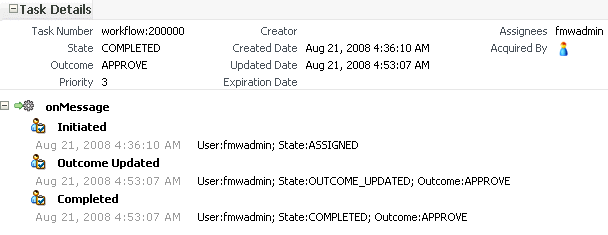
Description of the illustration hwf_mon_taskdetails2.gif
-
-
In the upper right-hand corner of the page, click Worklist Application to access the login page for Oracle BPM Worklist.
For more information, see Section 1.2.3, "Introduction to SOA Composite Application Instances."
20.3 Monitoring Human Task Service Component Instances
You can monitor human task service component instances. Each service component has its own unique instance ID. This ID is in addition to the instance ID of the overall SOA composite application of which this service component is a part.
Note:
Human workflow invocations from the BPEL service engine use different transactions than BPEL processes. Therefore, if a BPEL transaction is rolled back for any reason, the workflow task instances are still created.To monitor human task service component instances:
-
Access this page through one of the following options:
From the SOA Infrastructure Menu... From the SOA Folder in the Navigator... - Select Home.
-
Select the Deployed Composites tab.
-
In the Composite section, select a specific SOA composite application.
- Under soa-infra, select a specific SOA composite application.
-
Select the human task service component in the Component Metrics table.
-
Click Instances.
The Instances page displays the following details:
-
A utility for searching for a specific human task service component instance by specifying criteria and clicking Search.
-
Instances, including the instance ID of the service component, the state of the instance (for example, completed successfully or faulted), the instance start time, the last modification time, and links to log files describing the instance.
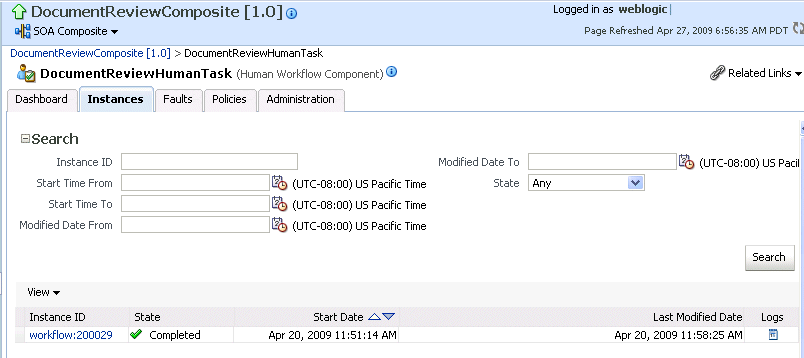
Description of the illustration hwf_comp_instances.gif
-
-
In the Instance ID column, click a specific ID for a service component to monitor the current status of a task on which approval actions are being taken.
-
In the Logs column, click a specific log to access the Log Messages page with filtered messages specific to that instance.
For more information, see Section 1.2.3, "Introduction to SOA Composite Application Instances" and Oracle Fusion Middleware Administrator's Guide for details about viewing and searching log files.
20.4 Monitoring Human Workflow Service Engine Instances and Faults
You can monitor instances and faults of all human task service component instances running in the human workflow service engine. These human task service components can be part of separate SOA composite applications.
To monitor human workflow service engine instances and faults:
-
Access this page through one of the following options:
From the SOA Infrastructure Menu... From the SOA Folder in the Navigator... - Select Service Engines > Human Workflow.
- Right-click soa-infra.
-
Select Service Engines > Human Workflow.
-
Click Dashboard.
The upper part of the Dashboard page displays the following details:
-
Recent instances of all human task service components running in the human workflow service engine, including the instance ID of the service component, the service component, the SOA composite application of which the service component is a part, the state of the instance (for example, completed, running, or faulted), the instance start time, and the last modification time.
-
Service components, including the service component name, SOA composite application, state of the service component, and total, running, and faulted instances.
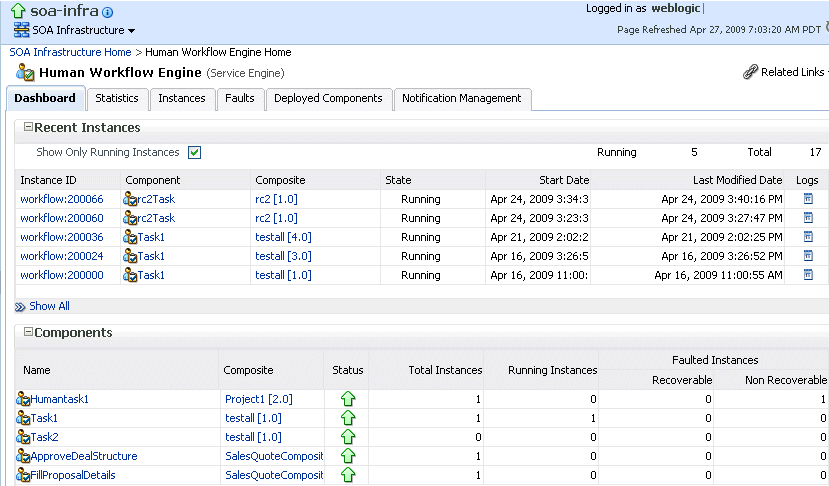
Description of the illustration hwf_se_dash_upper.gif
-
-
In the Recent Instances section, perform the following tasks:
-
In the Instance ID column, click an instance ID for a service component to monitor the current status of a task on which approval actions are being taken.
-
In the Component column, click a specific service component to access its home page.
-
In the Composite column, click a specific SOA composite application to access its home page.
-
In the Logs column, click a specific log to access the Log Messages page with filtered messages specific to that instance.
-
Click Show All below the section to access the Instances page of the service engine.
-
-
In the Components section, perform the following tasks:
-
In the Name column, click a specific service component to access its home page.
-
In the Composite columns, click a specific SOA composite application to access its home page.
-
Click Show All below the section to access the Deployed Components page of the service engine.
The lower part of the Dashboard page displays the following details:
-
Recent faults, including the error message, the time at which the fault occurred, the SOA composite application, the service component, and the service component instance ID.
-
Task assignees who take the longest time to act upon a task and who have the highest backlog of pending tasks to which to respond.
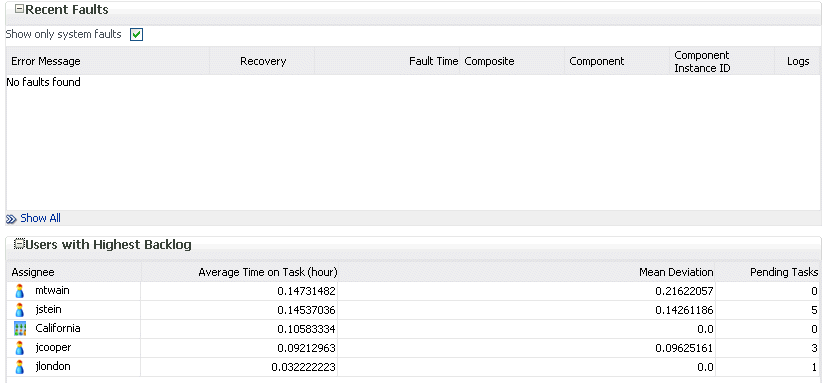
Description of the illustration hwf_se_dash_lower.gif
-
-
In the Recent Faults section, perform the following additional tasks:
-
In the Error Message column, click an error message to display complete information about the fault. If the fault is identified as recoverable, click the Recover Now link to perform fault recovery. Clicking this link invokes the human workflow audit trail page for the instance. The audit trail page has a link to Oracle BPM Worklist called Go to Worklist Application, where you can go to recover from the fault. This link does not take you directly to the fault; you must manually locate the fault.
-
In the Recovery column, click a fault identified as Recoverable to perform fault recovery at the component instance level.
-
In the Logs column, click a specific log to access the Log Messages page with filtered messages specific to that instance.
-
Click Show All below the section to access the Faults page of the service engine.
-
20.5 Monitoring Human Workflow Service Engine Active Requests and Operation Statistics
You can view details about active requests in the human workflow service engine and operational statistics. such as service used, operations performed, and active and completed requests.
To monitor human workflow service engine active requests and operation statistics:
-
Access this page through one of the following options:
From the SOA Infrastructure Menu... From the SOA Folder in the Navigator... - Select Service Engines > Human Workflow.
- Right-click soa-infra.
-
Select Service Engines > Human Workflow.
-
Click Statistics.
The Statistics page displays the following details:
-
Active requests in the service engine. Use this graph to get an idea of the current service engine load. Only under extreme load conditions is there data shown in the graph. This is because most requests are processed instantaneously by the service engine. The data is collected by a Dynamic Monitoring Service (DMS) state sensor. Once the requests are processed by the service engine, the count goes to zero. This action enables you to know the current load on the service engine (for example, if it is too high).
-
Average request message processing time in the service engine since the last startup of the SOA Infrastructure. Use this graph to check service engine performance. Note that while the processing time is calculated based on the last startup of the SOA Infrastructure, the data that is displayed in the graph is gathered only from the time at which you first accessed this page. The graph does not continue calculating and displaying data if you have not accessed this page. The DMS phase event sensor calculates the average request processing time and provides the processing time data.
-
Operation statistics about human workflow services used in the service engine, including the human workflow service used, the operation performed by the service, the number of active and completed requests, the count, and the average processing time.
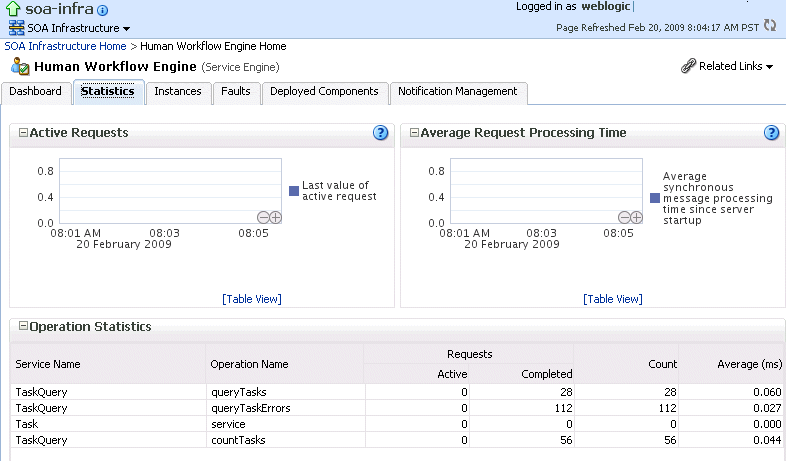
Description of the illustration hwf_se_stats.gif
For more information, see the following documentation:
-
Section 1.2.4, "Introduction to Service Components and Service Component Instances"
-
Oracle Fusion Middleware Developer's Guide for Oracle SOA Suite for details about human workflow services and operations
-
20.6 Monitoring Human Workflow Service Engine Instances
You can monitor all human task service component instances running in the service engine. These human task service components can be part of separate SOA composite applications.
To monitor human workflow service engine instances:
-
Access this page through one of the following options:
From the SOA Infrastructure Menu... From the SOA Folder in the Navigator... - Select Service Engines > Human Workflow.
- Right-click soa-infra.
-
Select Service Engines > Human Workflow.
-
Click Instances.
The Instances page displays the following details:
-
A utility for searching for a specific instance by specifying criteria and clicking Search.
-
Instances, including the instance ID of the service component, the service component, the SOA composite application of which the service component is a part, the state of the instance (for example, completed, running, or faulted), the instance start time, the last modification time, and links to log files that describe the instance.
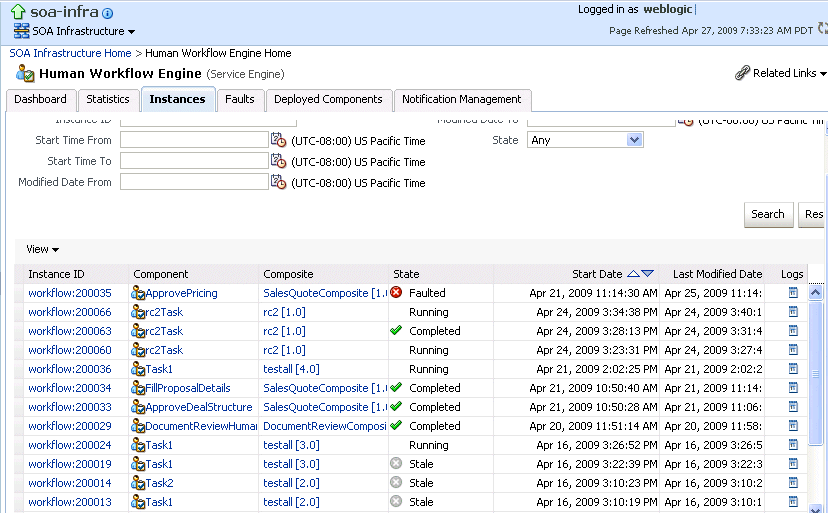
Description of the illustration hwf_se_instances.gif
-
-
In the Instances section, perform the following additional tasks:
-
In the Instance ID column, click an instance ID for a service component to monitor the current status of a task on which approval actions are being taken.
-
In the Component column, click a specific service component to access its home page.
-
In the Composite column, click a specific SOA composite application to access its home page.
-
In the Logs column, click a specific log to access the Log Messages page with filtered messages specific to that instance.
-
For more information, see Section 1.2.3, "Introduction to SOA Composite Application Instances" and Oracle Fusion Middleware Administrator's Guide for details about viewing and searching log files.
20.7 Monitoring Deployed Human Workflows in the Service Engine
You can monitor all deployed SOA composite applications with human task service components running in the service engine.
To monitor deployed human workflows in service engines:
-
Access this page through one of the following options:
From the SOA Infrastructure Menu... From the SOA Folder in the Navigator... - Select Service Engines > Human Workflow.
- Right-click soa-infra.
-
Select Service Engines > Human Workflow.
-
Click Deployed Components.
The Deployed Components page displays the following details:
-
A utility for searching for a specific deployed SOA composite application by specifying the full name and clicking Search.
-
Details about deployed human task service components running in this service engine, including the service component name, the SOA composite application, the current status, and the number of total, faulted, and running instances.
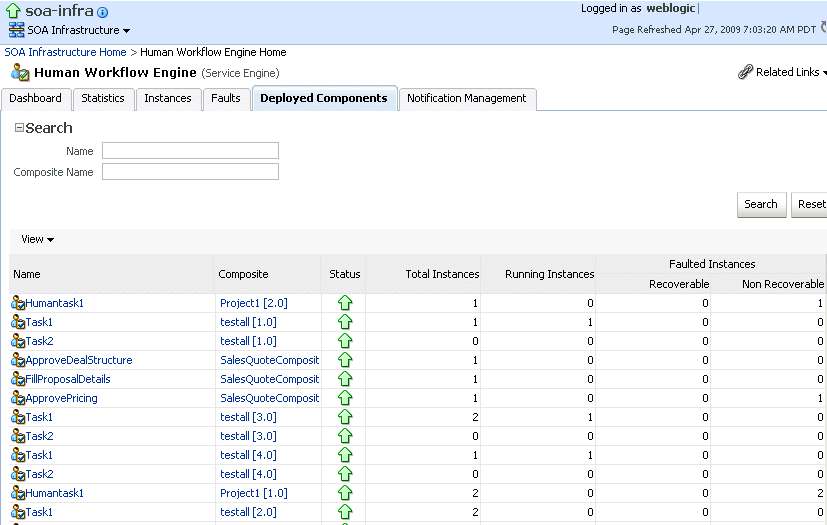
Description of the illustration hwf_se_deployedcomps1.gif
-
-
In the Name column, click a specific service component to access its home page.
-
In the Composite column, click a specific SOA composite application to access its home page.