2 Understanding JMX
Java Management Extensions (JMX) is a specification for monitoring and managing Java applications. It enables a generic management system to monitor your application; raise notifications when the application needs attention; and change the state of your application to remedy problems. Like SNMP and other management standards, JMX is a public specification and many vendors of commonly used monitoring products support it.
WebLogic Server uses the Java Management Extensions (JMX) 1.2 implementation that is included in JDK 6. The following sections describe how Java applications can use JMX to expose runtime metrics and control points to management systems:
For information about other APIs and utilities that you can use to manage Java EE applications on WebLogic Server, refer to "Overview of WebLogic Server System Administration" in Introduction to Oracle WebLogic Server.
What Management Services Can You Develop with JMX?
When used to monitor and manage applications, JMX typically provides management applications access to properties in your Java classes that collect management data (see Figure 2-1). Often, these class properties are simple counters that keep track of the resources your application is consuming. JMX can also provide access to methods in your Java classes that start or stop processes in the application or reset the value of the class properties. Any class that exposes management data through JMX is called a managed bean (MBean). Class properties that are exposed through MBeans are called attributes and methods that are exposed through MBeans are called operations.
Figure 2-1 JMX Provides Access to Management Properties

Description of "Figure 2-1 JMX Provides Access to Management Properties"
Once you provide this type of access to JMX-enabled management utilities, system administrators or the operations staff can integrate the data into their overall view of the system. They can use a JMX management utility to view the current value of an MBean attribute, or they can set up JMX monitors to periodically poll the value of your MBean attributes and emit notifications to the management utility only when the values exceed specific thresholds.
Creating Management-Aware Applications
Instead of placing all management responsibility on system administrators or the operations staff, you can create management-aware applications that monitor MBeans and then perform some automated task. For example:
-
An application that monitors connection pools and grows or shrinks the pools to meet demand.
-
A portal application that monitors the set of deployed applications. If a new application is deployed, the portal application automatically displays it as a new portlet.
-
An application that listens for deployments of connector modules and then configures itself to use newly deployed modules.
When Is It Appropriate to Use JMX?
Any critical Java EE application that is a heavy consumer of resources, such as database or JMS connections or caches, should provide some facility for monitoring the application's resource consumption. For these kinds of applications, which might be writing or reading from a database many times each minute, it is not feasible to use logging facilities to output messages with each write and read operation. Using JMX for this type of monitoring enables you to write management (instrumentation) code that is easy to maintain and that optimizes your use of network resources.
If you want to monitor basic runtime metrics for your application, WebLogic Server already provides a significant number of its own MBeans that you can use (see "Best Practices: Listening for WebLogic Server Events" in Developing Custom Management Utilities With JMX for Oracle WebLogic Server). For example, you can use existing WebLogic Server MBeans to track the hit rate on your application's servlets and the amount of time it takes to process servlet requests.
Although WebLogic Server MBeans can indicate to an operations center the general state of resources, it cannot provide detailed information about how a specific application is using the resources. For example, WebLogic Server MBeans can indicate how many connections are being used in a connection pool, but they do not indicate which applications are using the connection pools. If your domain contains several active applications and you notice that some connections are always in use, consider creating MBeans that monitor when each application session gets and releases a connection. You could also include a management operation that ends sessions that appear to be stuck.
In addition, if your application creates and maintains its own cache or writes to a data repository that is outside the control of the application container, consider creating MBeans to monitor the size of the cache or the amount of data written to the repository.
JMX Layers
Like most of Java EE, JMX is a component-based technology in which different types of software vendors provide different types of components. This division of labor enables each type of vendor to focus on providing only the software that falls within its area of expertise. JMX organizes its components into the following layers:
-
Instrumentation
Consists of applications that you write, resources, and other manageable objects. In this layer, application developers create managed beans (MBeans), which contain the properties (attributes) and methods (operations) that they want to expose to external management systems.
-
Agent
Consists of the JVM and application servers such as WebLogic Server. This layer includes a registry of MBeans and standard interfaces for creating, destroying, and accessing MBeans.
The agent layer also provides services for remote clients as well as a monitoring and a timer service. See Chapter 5, "Using the WebLogic Server JMX Timer Service," and "Using Notifications and Monitor MBeans" in Developing Custom Management Utilities With JMX for Oracle WebLogic Server.
-
Distributed Services
Consists of Management consoles or other Java EE applications. A management application sends or receives requests from the agent layer. Often this layer is available as a plug-in or as an adapter that enables a management console to support a variety of management protocols, such as JMX and SNMP.
Indirection and Introspection
Two key concepts for understanding JMX are indirection and introspection, which enable a JMX application to manage proprietary resources without requiring access to proprietary class definitions.
The general model for JMX is that applications in the distributed services layer never interact directly with classes in the instrumentation layer. Instead, under this model of indirection, the JMX agent layer provides standard interfaces, such as javax.management.MBeanServerConnection, that:
-
Expose a class management interface to management clients in the distributed services layer
-
Receive requests from management clients, such as a request to get the value of a property that a class is exposing through JMX
-
Interact with the class to carry out the request and return the result to the management client
Each class describes to the MBean server the set of properties and methods that it wants to expose through JMX. A property that a class exposes through JMX is called an MBean attribute, and a method that it exposes is called an operation. JMX specifies multiple techniques (design patterns) that a class can use to describe its attributes and operations, and these design patterns are formalized as the following MBean types: standard, dynamic, model, and open.
A class that implements the standard MBean type describes its management interface in way that is most like Java programming: a developer creates a JMX interface file that contains getter and setter methods for each class property that is to be exposed through JMX. The interface file also contains a wrapper method for each class method that is to be exposed. Then the class declares the name of its JMX interface. When you register a standard MBean with the MBean server, the MBean server introspects the class and its JMX interface to determine which attributes and operations it will expose to the distributed services layer. The MBean server also creates an object, MBeanInfo, that describes the interface. Management clients inspect this MBeanInfo object to learn about a class's management interface.
A class that implements the model MBean type describes its management interface by constructing its own MBeanInfo object, which is a collection of metadata objects that describe the properties and methods to expose through JMX. When you register a model MBean with the MBean server, the MBean server uses the existing MBeanInfo object instead of introspecting the class.
Notifications and Monitor MBeans
JMX provides two ways to monitor changes in MBeans: MBeans can emit notifications when specific events occur (such as a change in an attribute value), or monitor MBeans can poll an MBean periodically to retrieve the value of an attribute.
The following sections describe JMX notifications and monitor MBeans:
How JMX Notifications Are Broadcast and Received
As part of MBean creation, you can implement the javax.management.NotificationEmitter interface, which enables the MBean to emit notifications when different types of events occur. For example, you create an MBean that manages your application's use of a connection pool. You can configure the MBean to emit a notification when the application creates a connection and another notification when the application drops a connection.
To listen for notifications, you create a listener class that implements the javax.management.NotificationListener.handleNotification() method. Your implementation of this method includes the logic that causes the listener to carry out an action when it receives a notification. After you create the listener class, you create another class that registers the listener with an MBean.
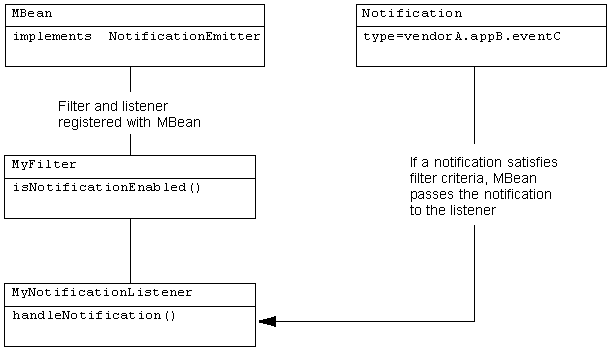
By default, an MBean broadcasts all its notifications to all its registered listeners. However, you can create and register a filter for a listener. A filter is a class that implements the javax.management.NotificationFilter.isNotificationEnabled() method. The implementation of this method specifies one or more notification types. (In this case, type refers to a unique string within a notification object that identifies an event, such as vendorA.appB.eventC.) When an event causes an MBean to generate a notification, the MBean invokes a filter's isNotificationEnabled() method before it sends the notification to the listener. If the notification type matches one of the types specified in isNotificationEnabled(), then the filter returns true and the MBean broadcasts the message to the associated listener.
For information on creating and registering listeners and filters, see "Listening for Notifications from WebLogic Server MBeans: Main Steps" in Developing Custom Management Utilities With JMX for Oracle WebLogic Server. For a complete description of JMX notifications, refer to the JMX 1.2 specification. See Related Documentation.
Figure 2-2 shows a basic system in which a notification listener receives only a subset of the notifications that an MBean broadcasts.
Figure 2-2 Receiving Notifications from an MBean

Description of "Figure 2-2 Receiving Notifications from an MBean"
Active Polling with Monitor MBeans
JMX includes specifications for a type of MBeans called monitor MBeans, which can be instantiated and configured to periodically observe other MBeans. Monitor MBeans emit JMX notifications only if a specific MBean attribute has changed beyond a specific threshold. A monitor MBean can observe the exact value of an attribute in an MBean, or optionally, the difference between two consecutive values of a numeric attribute. The value that a monitor MBean observes is called the derived gauge.
When the value of the derived gauge satisfies a set of conditions, the monitor MBean emits a specific notification type. Monitors can also send notifications when certain error cases are encountered while monitoring an attribute value.
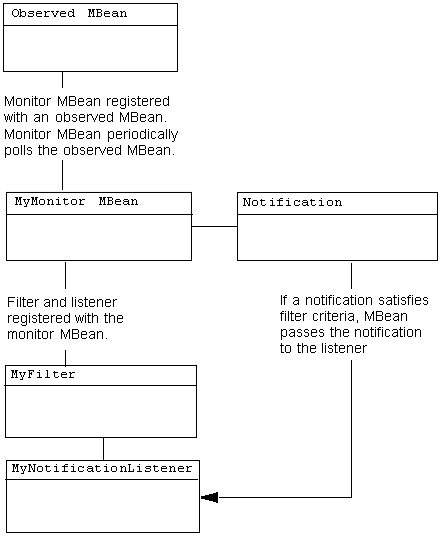
To use monitor MBeans, you configure a monitor MBean and register it with the MBean you want to observe. Then you create a listener class and register the class with the monitor MBean. Because monitor MBeans emit only very specific types of notification, you usually do not use filters when listening for notifications from monitor MBeans.
Figure 2-3 shows a basic system in which a monitor MBean is registered with an MBean. A NotificationListener is registered with the monitor MBean, and it receives notifications when the conditions within the monitor MBean are satisfied.
