To analyze queries, select Queries from the navigation bar. The Query Analyzer is displayed. The following figure shows an example of the table on that page:
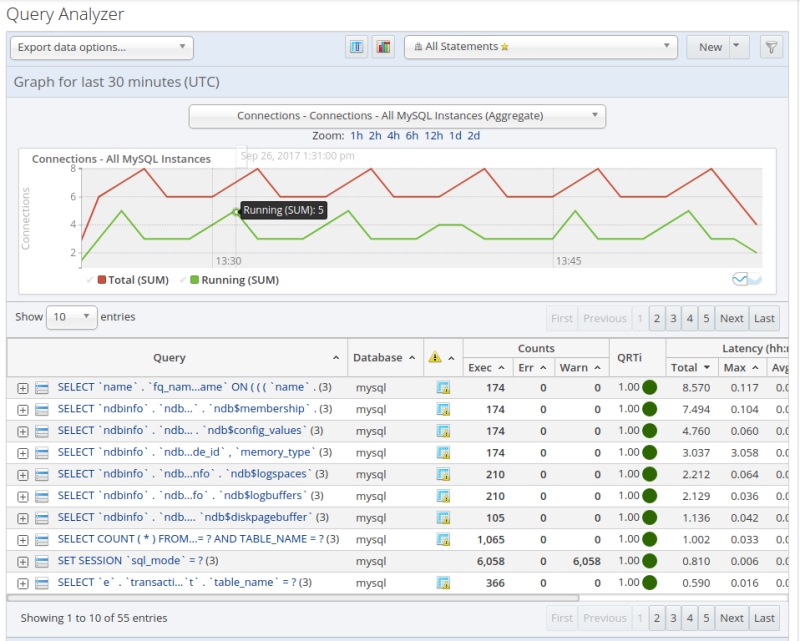
The main Query Analyzer table provides the summary information for
all of the queries executed. The table tracks all the queries
submitted to the server. The table shows a maximum of 100 rows, and
you can page through the list of queries by using the page numbers,
or the next, previous,
first, and last buttons.
To filter the list of queries that are displayed, or to change the
number of queries, see
Section 30.3.3, “Filtering Query Analyzer Data”. To export the query
information as a .csv file, see
Section 30.3.5, “Exporting Query Information”.
The Query Analyzer displays the data for the context selected in the target selection menus.
Each row within the table provides the statistical information for one normalized query statement. If you have configured multiple agent/proxies to accept and forward queries to different servers, then you can expand the server view. The summary information displayed is different depending on whether you have selected a server group or an individual server.
If you have selected a server group, then the information displayed is aggregated from across the entire group. The same query executed on multiple servers shows average, total and minimum/maximum information for that query across all the servers. If you select an individual server, then only queries executed on that server are included within the table.
For each row, the following columns are populated according to the selected filtering options. For example, if the filter is configured to show queries within the last 30 minutes (Interval), then only queries executed during that time are displayed, and the corresponding statistics, such as execution times, rows returned and bytes returned, reflect that 30 minute timespan.
Query: The normalized version of the query. Normalization removes the query-specific data so that different queries with different data parameters are identified as the same basic query.
The information is shown as one query per row. Each query row is expandable, and can be expanded to show the execution times for individual servers for that query.
NoteIf the selected context is a cluster, the queries for the cluster's SQL nodes are displayed either for the specific node or for the cluster as an aggregate. If other node types are selected, the aggregate is displayed.
Database: The default database in use at the time of the query. The database name might be blank, or might not match the database used within the query, if you used a qualified table name (for example,
select ... from
        db_name.table_name
) or if you issued aUSEstatement to switch databases after connecting.Execution notices: Highlights any specific issues experienced when running queries, including excessive table scans and bad index usage. These provide an immediate indication of a problem with a query that might require additional examination.
Counts: The number of times that the query has been executed. The column is sub-divided into three further columns, showing the number of executions of the query (Exec), the number of times an error has been reported for the query (Err), and the number of times a warning has been produced (Warn).
QRTi: Lists the Query Response Time index of the query. For more information, see Section 30.2, “Query Response Time index (QRTi)”.
Latency (hh:mm:ss.ms): The execution time for all the matching queries. This is the time, for every invocation of the corresponding query, as calculated by comparing the time when the query was submitted and when the results were returned by the server. Times are expressed in HH:MM:SS.MS (hours, minutes, seconds, and milliseconds).
The Exec Time column is further subdivided into the following columns:
Total: The cumulative execution time for all the executions of this query.
Max: The maximum execution time for an execution of this query.
Avg: The average execution time for the execution of this query.
Locks: the time spent waiting for table locks caused by the query.
Average History graph (Avg History): graphs the average execution time.
When looking at the information provided in this query, compare the average and maximum execution times to see if there was a problem on a specific server or during a specific time period when the query took place, as this could indicate an issue that needs to be investigated.
Rows: The rows returned by the query. The column is sub-divided into the following columns:
Total: The sum total number of rows returned by all executions of the query.
Max: The maximum number of rows returned by a single execution of the query.
Avg: The average number of rows returned by all executions of the query.
Bytes: The number of bytes returned by each query. The column is sub-divided into the following columns:
Total: The sum total bytes returned by all executions of the query.
Max: The maximum number of bytes returned by a single execution of the query.
Avg: The average number of bytes returned by all executions of the query.
First Seen: The date and time the normalized version of this query was first seen, which might be earlier than the period specified by the filter.
You can sort the list of queries by clicking the column name. The direction of the sort (highest to lowest, or lowest to highest) is indicated by a triangle next to the currently selected column. The default is to sort the list of queries by the Latency:Total time.
To help you and locate queries you can filter the list of queries using a variety of criteria. For more information on the filtering methods available, see Section 30.3.3, “Filtering Query Analyzer Data”.