Click on an individual query to see more detailed information about the individual query in the Details view.
For more information on Normalization and Statement Digests, see Performance Schema Statement Digests and Sampling.
If you change the context, by selecting another MySQL instance from the All Targets menu, and the selected instance does not contain the statement digest of the originally selected query, an error is displayed.
The details page contains the following elements:
Statement Digest field: lists the truncated identifier of the statement. To see the full version, click Show. To copy the statement digest to the clipboard, click Copy.
Date and time range: displays the statement's time range, as selected on the Query Analyzer page.
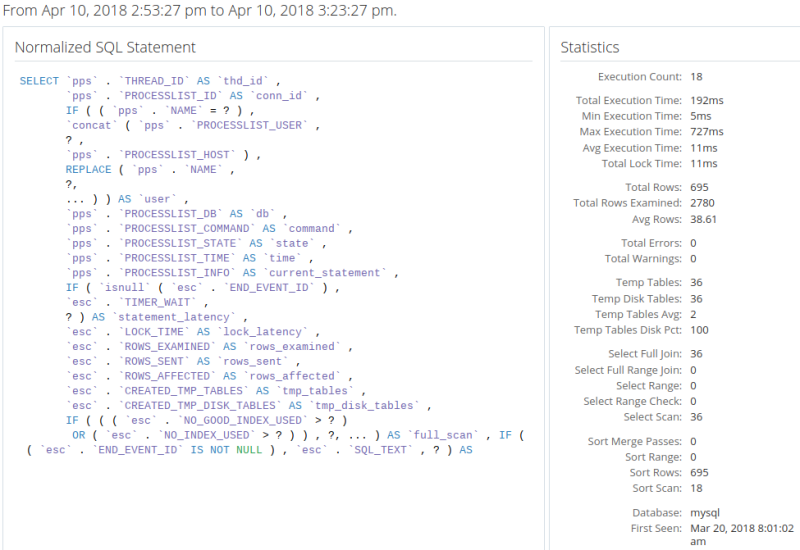
Normalized SQL Statement: displays the selected, normalized SQL statement.
Statistics: displays the relevant statistics for the SQL statement. Number of executions, Total Execution time, and so on.
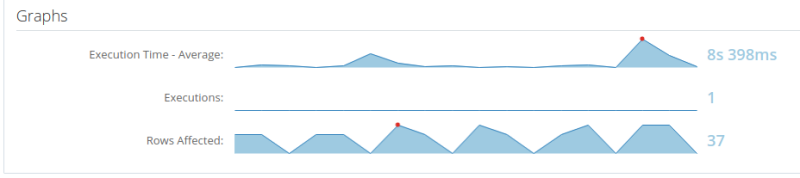
Graphs: displays the average execution time, number of executions, and number of rows affected by the statement within the selected time range.
Example Statements: (Displayed only if Example Query is enabled) distribution chart of the statement by Execution Time, in milliseconds, and time and date, within the selected time range.
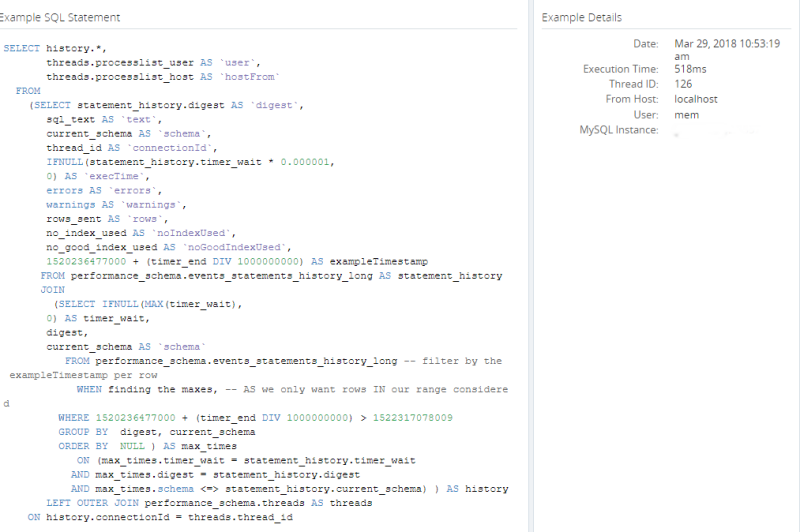
Example SQL Statements: (Displayed only if Example Query is enabled)
The Normalized SQL Statement displays the normalized version of the SQL statement, while the Statistics displays useful information on the execution of that statement.
The statement graph displays the average execution time, number of executions, and the number of rows affected.
The Example Statements distribution chart graphically represents the statement by execution time and time and date. Each point on the chart represents a specific example statement execution time.
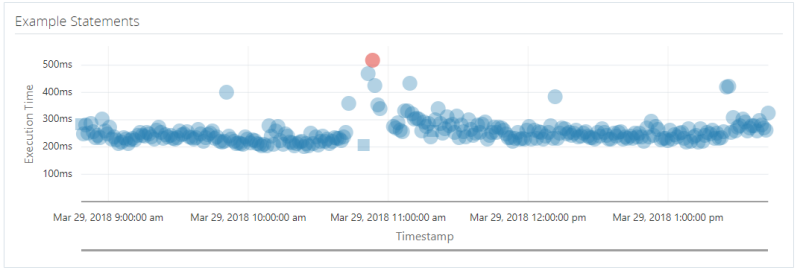
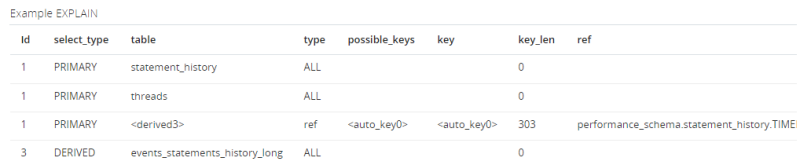
Statements with an associated EXPLAIN plan are represented by a circle in the Distribution Chart. Squares have no EXPLAIN plan. The red circle or square is the SQL statement with the longest execution time for the specified period. Clicking on a circle or square displays its query text in the original form, execution details, and its EXPLAIN plan, if EXPLAIN is enabled. Selecting one of the points loads the data for that point in the Example details frames: