Performance schema based reports provide insight into the MySQL server operations through helpful high-level reports. MySQL Workbench uses the SYS views on the Performance Schema to generate over 20 reports to help analyze the performance of your MySQL databases. Reports help analyze IO hotspots, discover high cost SQL statements, and review wait statistics and InnoDB engine metrics. For additional information about the SYS schema, see MySQL sys Schema.
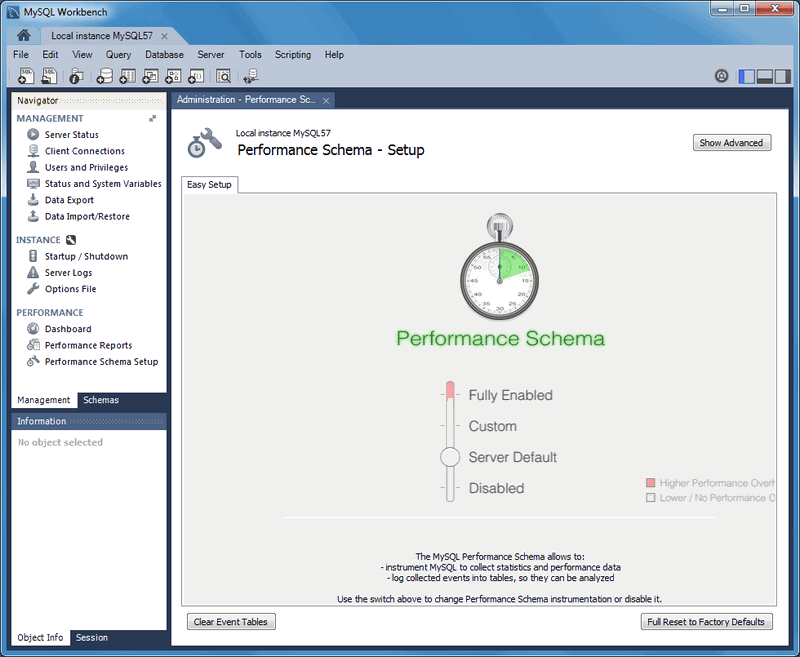
A GUI for configuring and fine tuning the Performance Schema instrumentation (see the figure that follows). Initially, this loads an Easy Setup tab that is enough for most users. To enable all available Performance Schema instruments, pause your pointer device over Fully Enabled and click the circle on the slide bar.
The SYS schema is bundled with MySQL Server 5.7 and above, and MySQL Workbench uses that version. However, for MySQL Server 5.6, Workbench installs its own bundled version of the SYS schema.
The size of the saved digested query is determined by the MySQL server.
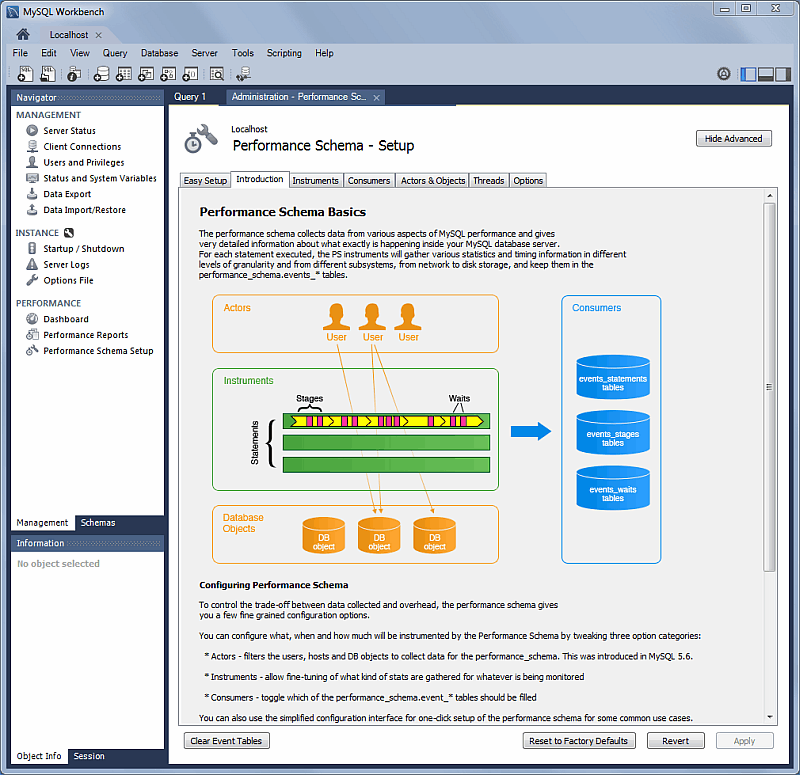
Clicking provides methods to fine tune the Performance Schema instrumentation. The next figure shows the tabs related to advanced instrumentation and the Introduction tab selected.
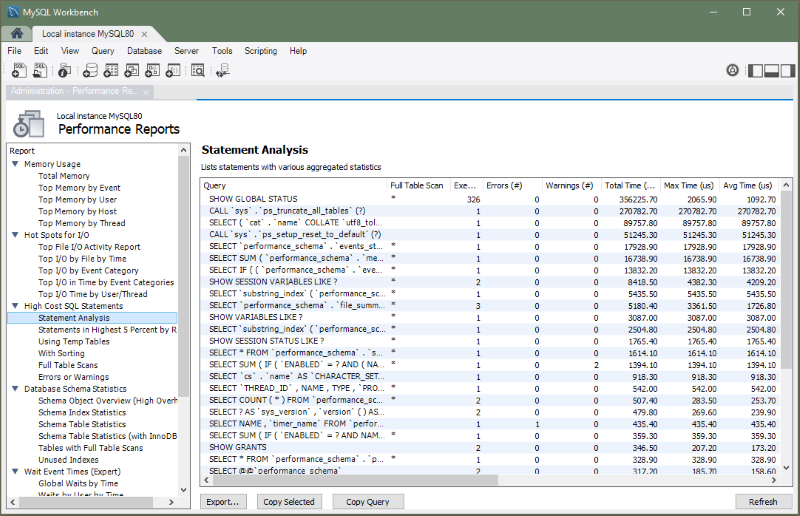
Performance report data can be viewed and exported using the following controls (see the figure that follows):
: Export all entries and associated data (and column headings) from the current performance report, which includes all queries and values. Opens a file dialog for export.
: Copies a single entry and associated data (and column headings) from the current performance report. Saves to the system's clipboard. An example:
: Copies the SQL query that generated the performance report. Saves to the system clipboard.
: Refreshes (reloads) the performance report.
Individual reports are shown in the following groups:
Memory Usage
Total Memory– Shows total memory allocated.Top Memory by Event– Shows events consuming the most memory.Top Memory by User– Shows users consuming the most memory.Top Memory by Host– Shows hosts consuming the most memory.Top Memory by Thread– Shows threads consuming the most memory.
Hot Spots for
        I/O
Top File I/O Activity Report– Shows the files with the most I/O usage in bytes.Top I/O by File by Time– Shows the highest I/O usage by file and latency.Top I/O by Event Category– Shows the highest I/O data usage by event categories.Top I/O in Time by Event Categories– Shows the highest I/O time consumers by event categories.Top I/O by User/Thread– Shows the top I/O time consumers by user and thread.
High Cost SQL
        Statements
Statement Analysis– Lists statements with various aggregated statistics.Statements in Highest 5 percent by Runtime– Lists all statements in which the average runtime (in microseconds) is in the highest five percent.Using Temp Tables– Lists all statements that use temporary tables (access the highest percentage of disk temporary tables, then memory temporary tables).With Sorting– Lists all normalized statements that have done sorts (access in the following priority order:sort_merge_passes,sort_scans, andsort_rows).Full Table Scans– Lists statements that have performed a full table scan. Access query performance and theWHEREclause (or clauses). If no index is used, consider adding indexes for large tables.Errors or Warnings– Lists statements that have raised errors or warnings.
Database Schema
        Statistics
Schema Object Overview (High Overhead)– Shows the count by object for each schema. Note that for instances with a large number of objects, this report may require extended time to execute.Schema Index Statistics– Shows the general statistics related to indexes.Schema Table Statistics– Shows the general statistics related to tables.Schema Table Statistics (with InnoDB buffer)– Shows schema tables with InnoDB buffer statistics.Tables with Full Table Scans– Finds tables that are being accessed by full table scans, ordering by the number of rows scanned (descending).Unused Indexes– Shows the list of indexes that were never used since the server started or since P_S data collection started.
Wait Event Times
        (Expert)
Global Waits by Time– Lists the top global wait events by their total time, ignoring idle (this may not be very large).Waits by User by Time– Lists the top wait events by user and by their total time, ignoring idle (this may not be very large).Wait Classes by Time– Lists the top wait classes by total time, ignoring idle (this may not be very large).Waits Classes by Average Time– Lists the top wait classes by average time, ignoring idle (this may not be very large).
InnoDB
        Statistics
InnoDB Buffer Stats by Schema– Summarizes the output of theINFORMATION_SCHEMA.INNODB_BUFFER_PAGEtable, aggregating by schema.InnoDB Buffer Stats by Table– Summarizes the output of theINFORMATION_SCHEMA.INNODB_BUFFER_PAGEtable, aggregating by schema and table name.
User Resource
        Use
Overview– Shows the resource use summary for each user.I/O Statistics– Shows the I/O use for each user.Statement Statistics– Shows the statement execution statistics for each user.