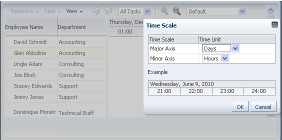
A Gantt chart is a type of horizontal bar graph that you use to plan and track projects. It shows resources or tasks in a time frame with a distinct beginning and end. A Gantt chart component is composed of two regions, one displaying the Gantt chart data in a table, and the other displaying the Gantt chart data graphically with a resizable splitter between the two regions. The table and chart regions share the same data and selection model, supporting and synchronizing scrolling, and expanding and collapsing of rows between the two regions.
At runtime, Gantt charts provide interaction capabilities in the table region to the user such as entering data, expanding and collapsing rows, showing and hiding columns, navigating to a row, and sorting and totaling columns. In the chart region, users can drag a task to a new date, select multiple tasks to create dependencies, and extend the task date. A Gantt chart toolbar is available to support user operations such as changing or filtering the view of the data, and creating, deleting, cutting, copying, and pasting tasks.
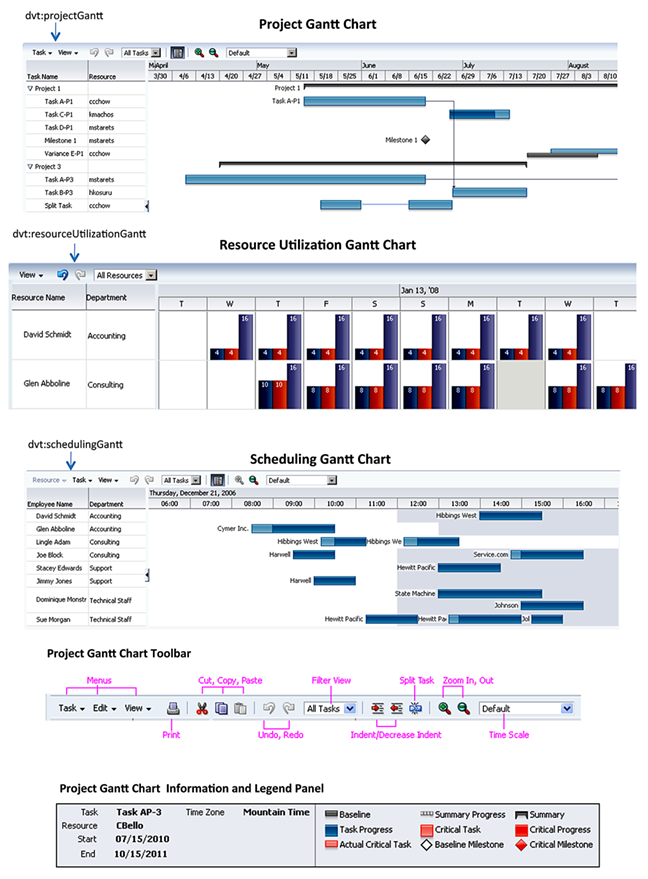
There are three types of Gantt chart components:
- The project Gantt chart (dvt:projectGantt) is used for project management. The chart lists tasks vertically and shows the duration of each task as a bar on a horizontal time line. Each task is graphed on a separate line.
- The resource utilization Gantt chart (dvt:resourceUtilizationGantt) graphically shows the metrics for a resource, for example, whether resources are over or under allocated. It shows resources vertically while showing their metrics, such as allocation and capacity on the horizontal time axis.
- The scheduling Gantt chart (dvt:schedulingGantt) is used for resource scheduling. The chart is based on manual scheduling boards and shows resources vertically, with corresponding activities on the horizontal time axis. Examples of resources include people, machines, or rooms. The scheduling Gantt chart uses a single line to graph all the tasks that are assigned to a resource.
Documentation
Web User Interface Developer's Guide for Oracle ADF: Using Gantt Chart Components
Fusion Developers Guide for Oracle ADF: Creating Databound Data Visualization Components
Demos and code examples:
You can download the ADF Faces Rich Client component demo, where you can explore data visualization components at runtime and view sample code.