| Skip Navigation Links | |
| Exit Print View | |

|
Oracle Solaris Studio 12.2: Debugging a Program With dbx |
4. Viewing and Navigating To Code
5. Controlling Program Execution
6. Setting Breakpoints and Traces
8. Evaluating and Displaying Data
11. Debugging Multithreaded Applications
Changing the Default Signal Lists
Trapping the FPE Signal (Solaris Platforms Only)
Determining Where the Exception Occurred
Determining the Cause of the Exception
Automatically Handling Signals
16. Debugging Fortran Using dbx
17. Debugging a Java Application With dbx
18. Debugging at the Machine-Instruction Level
19. Using dbx With the Korn Shell
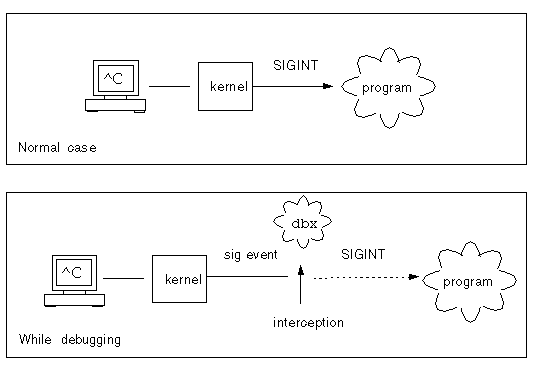
When a signal is to be delivered to a process that is being debugged, the signal is redirected to dbx by the kernel. When this happens, you usually receive a prompt. You then have two choices:
“Cancel” the signal when the program is resumed (the default behavior of the cont command) facilitating easy interruption and resumption with SIGINT (Control-C) as shown in Figure 14-1.
“Forward” the signal to the process using:
cont -sig signal
signal can be either a signal name or a signal number.
Figure 14-1 Intercepting and Cancelling the SIGINT Signal

In addition, if a certain signal is received frequently, you can arrange for dbx to forward the signal automatically because you do not want it displayed:
ignore signal # “ignore”
However, the signal is still forwarded to the process. A default set of signals is automatically forwarded in this manner (see ignore Command).