Using Content Panes
This chapter covers the following topics:
- Overview of Content Panes
- Types of Content Panes
- Displaying a Content Pane
- Refreshing a Content Pane
- Opening the Associated Worksheet
- Viewing the Definition of a Content Pane
Overview of Content Panes
In addition to core items (My Tasks, My Worksheets, and Who's Online), you usually display some content panes (or content) within Collaborator Workbench.
A content pane displays a graphical view of data associated with a worksheet, to provide you with current, at-a-glance information that meets your needs. You can display content in formats such as the following:
-
Members Browser, which is a collapsible tree hierarchy of data levels
-
Tabular format
-
Chart formats including line, bar, and pie charts
-
Calendar format
You use content panes to view simultaneously many presentations of demand chain information. Each content pane can be filtered to suit your needs. And you can make content panes made available to other users so that you can share your work with your enterprise partners.
Refresh and Update Dates
The bottom of each content pane shows two dates:
-
Last Refresh is the last date and time when data was reloaded into this pane. Unlike the core panes (My Worksheets, My Tasks, and Who's Online), a content pane is updated only when you refresh the pane. See Refreshing a Content Pane.
-
Last Update is the last date and time when this content pane was redefined.

Worksheets and Content Panes
Worksheets and content panes are related to each other. All content panes are available as worksheets, but not all worksheets are available as content panes. Part of the definition of a worksheet includes a check box that enables the worksheet to be displayed as a content pane; if this check box is enabled, it is possible to specify what the content pane looks like.
See also Creating and Redefining Content Panes.
For information on the worksheets to which you have access, see My Worksheets.
Editing Data in Content Panes
The data in the panes is read-only (except for in a Members Browser). In order to edit the data, you must open the worksheet associated with it.
See also:
-
Displaying a Content Pane
-
Configuring Your Default Layout
-
Opening the Associated Worksheet
Types of Content Panes
This section provides an overview of the types of content panes and allowed variations. Any content pane can include filtering and exceptions.
Members Browser Content Pane
A Members Browser is a collapsible tree hierarchy of data levels, like the following example:
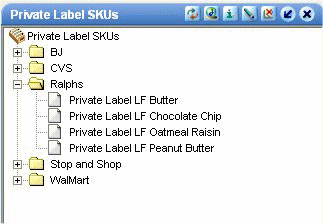
You use this content pane for the following general purposes:
-
To launch worksheets
-
To view the attributes of a member.
-
To create, edit, and delete members.
-
To perform additional operations on members, as defined within your implementation.
See Using a members Browser Content Pane .
Note: This is the only type of content pane where you can make changes. The other content panes are purely informational.
Table Content Pane
A content pane can display data in a tabular format, like the following example:
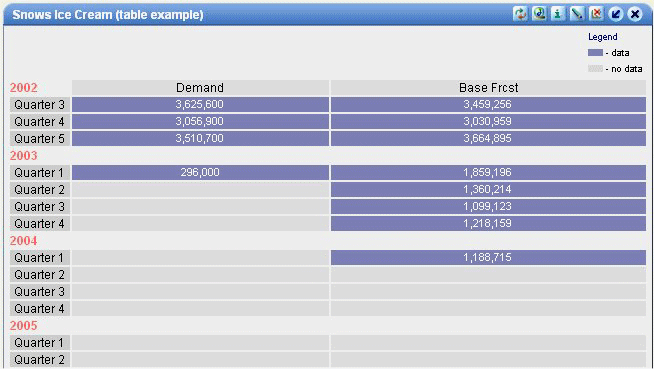
Here the data is filtered to show a single brand (Snows Ice Cream) and is aggregated across that brand and all locations. In a case like this, it is helpful to use the title of the content pane to indicate how the data is filtered.
A table-style content pane cannot display data in crosstab format; that is, it cannot list SKUs or stores across the x- or y-axis. In contrast, a table in a worksheet can display data in that format.
Line Chart Content Pane
A content pane can display data in a line chart. A couple of variations are possible. You can display multiple series for a single member or a single combination, as follows:
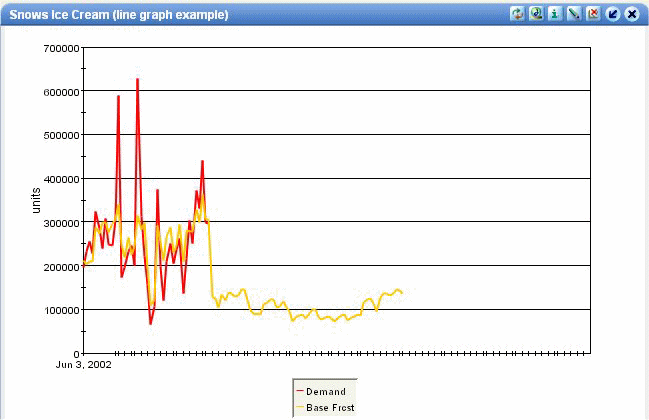
Here each line represents a series. The data is filtered to show a single brand (Snows Ice Cream) and is aggregated across that brand and all locations. In a case like this, it is helpful to use the title of the content pane to indicate how the data is filtered.
Alternatively, you can display a single series for multiple members or combinations, as follows:
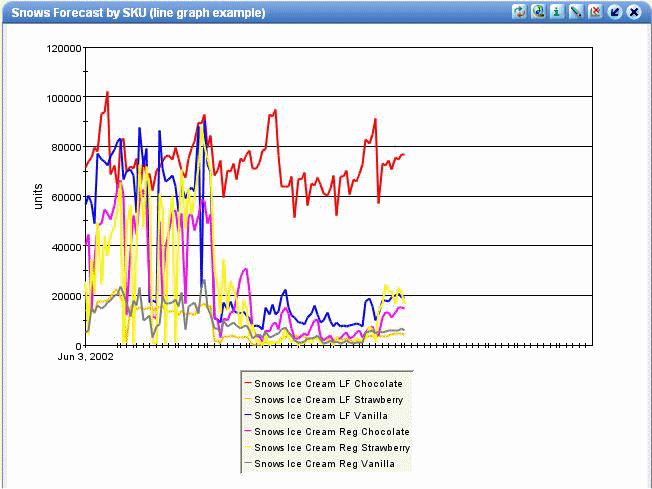
Here each line represents the forecast for a single SKU, aggregated across all locations where that SKU is sold. Alternatively, the chart could show a single line for each SKU at each store; other variations are possible. To show data separately for multiple items or multiple locations, you can include only one series.
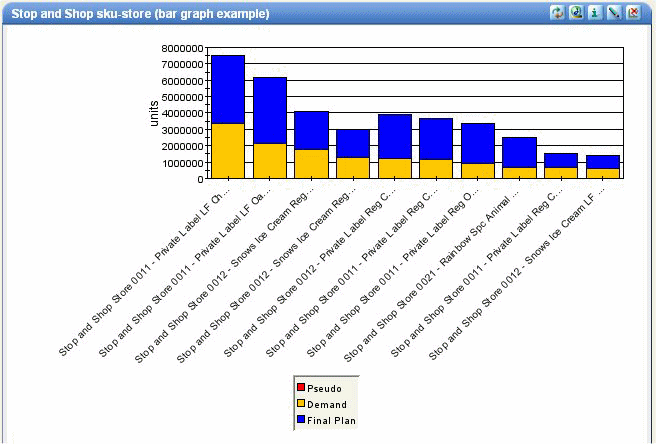
Stacked Bar Chart Content Pane
A content pane can display data in a stacked bar chart, as in the following example:
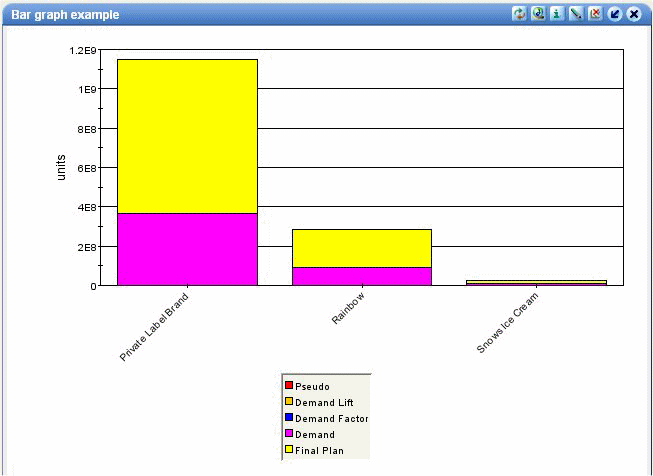
In a content pane of this type, each series is shown in a separate color, chosen by the system. Each member or each combination is shown as a separate bar. In the preceding example, data is shown for three brands, and the chart has three bars. In contrast, in the next example, data is shown for ten SKU-store combinations.
Filtering of Stacked Bar Charts
Because of the limitations of screen space, Oracle Demantra automatically applies a filter to any stacked bar chart. By default, it displays the top ten members (or combinations) that have the highest demand. You can configure this filter to choose, for example, the five stores with the lowest return rates, if your system contains such data.
Time Aggregation
If you select the Content Definition, the time aggregation on the worksheet changes to N/A. Content definition using a stacked bar chart restricts the use of time aggretgation.
This type of content requires a top filter definition. When defining it, there are top filter fields to the right of Display Type. These fields:
-
Have default values
-
Define how many combinations to filter--top or bottom--and what series to take as a filter criteria when comparing values.
Such a definition:
-
Retrieves the regular query for the worksheet
-
Searches all combinations retrieved for the worksheet
-
Finds the top n combinations according to the top filter criteria
-
Displays their aggregated value
For every combination seen in the worksheet, only the aggregated value in time is displayed. Only the summary of all values for all dates retrieved for the specific combination and series are displayed. Since this is a two dimensional view where time is not a dimension, the time caption has no meaning.
Pie Chart Content Pane
A content pane can display data in a pie chart, as in the following example:
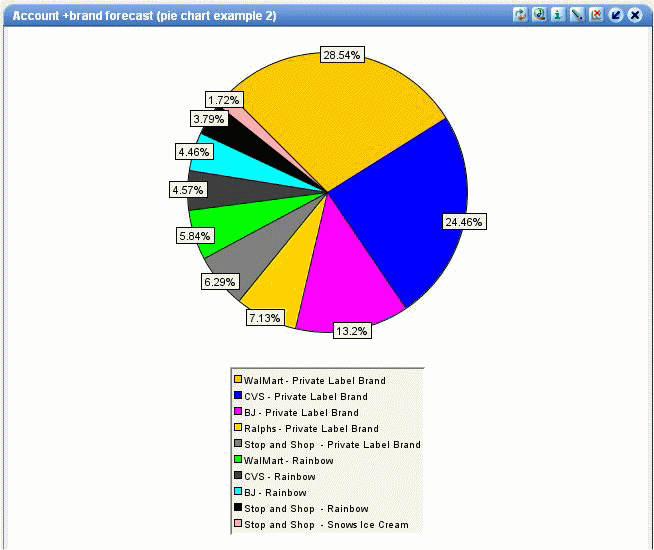
Within a content pane, a pie chart works as follows:
-
Only one series may be displayed (it is helpful to include the series name in the title of the content pane).
-
You can include any number of aggregation levels. The pie chart displays one wedge for each resulting combination. Colors are chosen by the system.
Within worksheets, pie charts are more somewhat flexible, because more screen space is available.
Calendar Content Pane
A content pane can display a calendar that shows the values of one series, as in the following example:
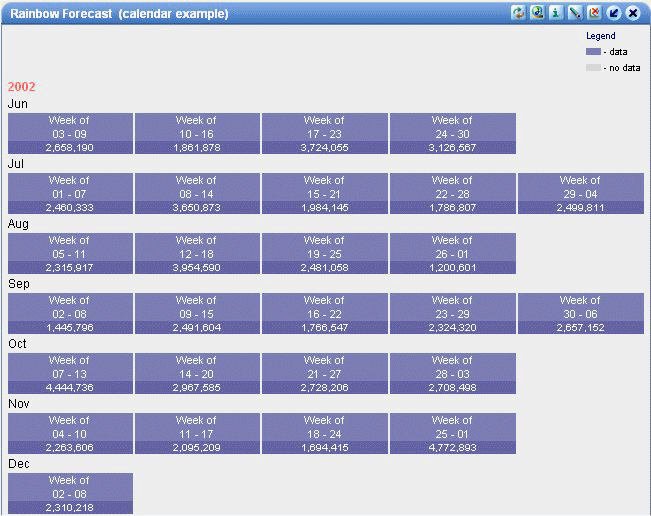
For this type of content pane, you include a single series, whose values are shown for each time bucket in the calendar. Depending on your implementation, you can choose the size of time bucket to use: week, month, quarter, and so on. It is helpful to use the title of the content pane to indicate which series is displayed and how that is filtered.
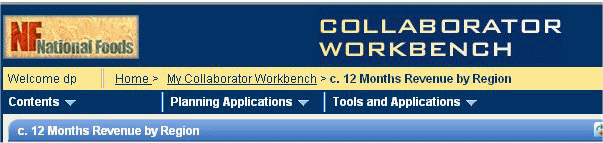
Displaying a Content Pane
You can display a content pane in either of two ways:
-
By temporarily displaying the pane without affecting your default layout.
-
By changing your default layout to include the content pane.
To temporarily display a content pane
You can temporarily display a content pane without changing your default layout.
-
Click the Contents menu and then click the name of the worksheet, from the list of available content panes.
-
Collaborator Workbench displays the selected content in the wide area (the left side), in place of any other panes in that area.
Note the change in the title bar. Also note that the narrow area is left as is.
-
To restore your default layout, click the My Collaborator Workbench link in the title bar.
To change your default layout to display a content pane
-
Click the Personalize link.
The Personalize - Modules page appears. This page contains two lists: one for items that can be displayed in the wide pane and one for items that can be displayed in the narrow pane.

-
Select the check box next to the content pane you want to display.
The Personalize - Order page appears. Like the previous page, this page has one list for the wide pane and one for the narrow pane.
-
Select a module and then click the up or down buttons to change its position in the list.
The order here is the order in which these modules are shown in Collaborator Workbench.
-
Click Next.
The next page summarizes your choices. You can return to the previous pages to make further alterations.
-
Click Finish to save your changes. Or click Back to go back to the previous pages.
See also:
-
Overview of Content Panes
-
Creating and Redefining Content Panes
-
Opening the Associated Worksheet
Refreshing a Content Pane
When you first display a content pane, it contains the most recent data. However, after that, the data is static and does not refresh automatically. Also note that the content panes are not refreshed when you use the browser's refresh function.
To refresh a content pane
Click the Refresh button at the top of the content pane.
The content pane reloads with the most recent data, and Oracle Demantra changes the Last Refresh date.
![]()
Opening the Associated Worksheet
Each content pane is associated with a corresponding worksheet. If you need to edit the data, you must open the worksheet to do so, because the content pane is read-only.
To open a worksheet associated with a content pane
Click the open button in the upper right of the pane.
See also Introduction to Oracle Demantra.
Viewing the Definition of a Content Pane
The Info page displays information about the worksheet whose results are currently being displayed in a content pane.
To view content information
Click the information button in the upper right of the content pane.
The Info page appears.
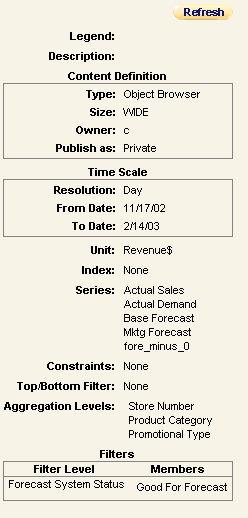
Constraints displays the first exception, even if you have defined more than one.