Creating and Redefining Content Panes
This chapter covers the following topics:
- Creating or Editing Content Panes
- Introduction to the Content Pane Editor
- Configuring the Basics
- Selecting Series on a Content Pane
- Specifying the Time Resolution and Time Span
- Specifying Aggregation Levels
- Using the Advanced Selection Options
- Changing the Overall Scale or Unit of Measure
- Filtering the Content
- Applying Exception Filters
- Sharing Content Panes
- Deleting Content Panes
Creating or Editing Content Panes
Click Contents > New...
To edit an existing content pane
-
Display the content pane in Collaborator Workbench; see Displaying a Content Pane.
-
At the top of the pane, click the Edit button.
-
Make changes in the content pane editor; see Introduction to the Content Pane Editor.
-
Click Save.
When you change the definition of a content pane, Oracle Demantra changes the Last Update date for that content pane.

Introduction to the Content Pane Editor
The content pane editor is the same tool that you use to create worksheets (in Oracle Demantra Demand Management, for example), and some of the options apply only to worksheets, as noted in this documentation.
The content pane editor has a set of buttons on the left, which you click to open different pages with different purposes:
| Button | Purpose | For details, see... |
|---|---|---|
| Display | Specify basic information about the content pane. | “Configuring the Basics” |
| Series | Select series to include. | “Selecting Series on a Content Pane” |
| Time | Specify time resolution of content pane and span of time to consider. | “Specifying the Time Resolution and Time Span” |
| Aggregation Levels | Optionally specify aggregation levels to include, which controls which members and combinations are displayed. | “Specifying Aggregation Levels” |
| Filters | Optionally filter the data in the content pane. | “Filtering the Content” |
| Exceptions | Optionally apply exception filters to further filter the worksheet. | “Applying Exception Filters” |
| Layout Designer | Does not affect the content pane (affects only worksheets). | n/a |
Here you have the following options:
-
To move to another page, either click a button on the left side of the page or click Previous or Next.
-
To exit the editor and keep your changes, click OK.
-
To exit the editor and discard all changes, click Cancel.
Rules of Types of Content Panes
Depending on the format of the content pane, you may or may not be able to select multiple series and levels. The following table summarizes the applicable rules for each type of content pane.
Also:
-
For all types of content panes, there are no restrictions on the options on the Time, Filters, or Exceptions screens.
-
The Layout screen has no effect on any content pane.
-
For content panes that permit multiple levels, the Aggregation screen controls the order in which the levels are used. (For worksheets, the order of the levels here is ignored, because the Layout screen is used.)
Working with Lists
As you create or edit content panes, you will often use pages that present two lists of elements, where you specify your selections. To do so, you move elements from the left list to the right list. The left list always presents the available elements (such as the available series) and the right list always shows your selections.
You can move elements from one list to the other in many equivalent ways, summarized here:
-
To move all elements from one list to the other, click one of the double arrow buttons, as appropriate.
-
To move a single element from one list to the other, click the element and then click one of the single arrow buttons, as appropriate. Or double-click the element.
-
To move several adjacent elements, click the first element, press Shift and click the last element. Then click one of the single arrow buttons, as appropriate.
-
To move several elements that are not adjacent, press Ctrl and click each element you want. Then click one of the single arrow buttons, as appropriate.
Configuring the Basics
To configure basic information for a content pane
-
Start the content pane editor; see “Creating or Editing Content Panes”.
The first screen lets you specify the following basic information:
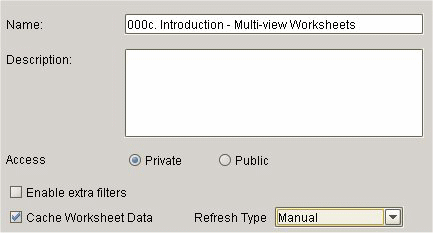
Name The title to use for this content pane. See Tips for titles of content panes. Description Applies only to worksheets. Access Select Private or Public. Private is for your use only. Public content panes are available to all users in the group. Enable Extra Filters Applies only to worksheets. Cache Worksheet Data Applies only to worksheets. -
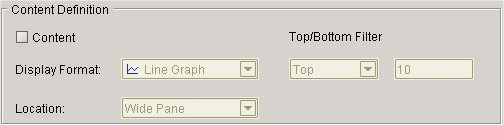
Check Content and then complete the following fields:
Tips for titles of content panes
To save space, the content panes do not include as many labels as you see in worksheets. The following table summarizes what is shown in each kind of content pane and provides suggestions for titles that provide the missing information; your actual needs may vary.
Type Labels displayed in the pane Suggestions for pane title Members Browser Names of the level members. For example, if you display SKUs and stores, the SKU and store names are shown. Table Name of each series. A useful title would indicate how these series are aggregated and filtered. Line chart with multiple series Name of each series. A useful title would indicate how these series are aggregated and filtered. Line chart with a single series Name of each member or combination, as appropriate. A useful title would indicate the name of the series. Bar chart Name of each series.
Name of each member or combination, as appropriate.Pie chart Name of each member or combination, as appropriate. A useful title would indicate the name of the series. Calendar Name of each time bucket. A useful title would indicate the name of the series.
Selecting Series on a Content Pane
For technical reasons, every content pane must include at least one series. Depending on the format of the content pane, you may or may not be able to select multiple series. The following table summarizes the applicable rules
| Type | Series |
|---|---|
| Members Browser | Select one series (it is ignored). |
| Table | Select any number of series. |
| Line chart | If you plan to select any levels, select only one series. Otherwise, select any number of series. |
| Bar chart | Select any number of series. |
| Pie chart | Select one series. |
| Calender | Select one series. |
To specify the series on a content pane
-
Start the content pane editor; see “Creating or Editing Content Panes”.
-
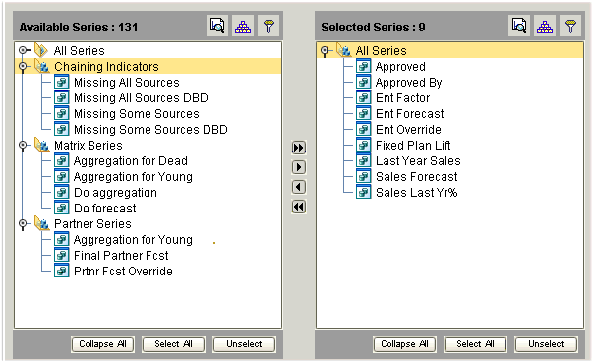
Click Series.
The system displays the Available Series and Selected Series lists. Each list is a collapsible list of series groups and the series in them.
-
Move all series that you want into the Selected Series list. To do so, either double-click each series or drag and drop it. You can also move an entire series group from one list to the other in the same way.
-
Remove any series from the Selected Series list that you do not want to include on the worksheet.
Note: You cannot remove a series from a worksheet if that worksheet uses it as the Criteria Series for bar chart content. See Step 2.
Note: Currently, Collaborator Workbench chooses the color to use for each series in the graphs.
Managing the Series Lists
You may have a very large number of series, and it can be useful to sort and filter these lists so that you can readily find what you need. The system also provides a search mechanism.
Note: This section applies only to the series page of the content pane editor.
To sort a list of series
-
Click the Sort button.
The Sort dialog box is displayed.
-
Drag the list name from the Available Columns to the Sort Columns. Or double-click the list name in the Available Columns list.
-
Click OK.
To filter a list of series
-
Click the Filter button.
-
The Filter page appears.
-
-
Click Add.
-
Click the arrow to the right of the operator box and select an operator from the dropdown list.
-
In the number box, enter the value by which to filter the list.
-
(Optional) You may filter further by using the AND relationship.
-
Click OK.
To find a series
-
Click the Find button.
The Find dialog box appears.
-
In the Find where box, select the name of the list to search.
-
In the Find what box, type name of the series.
-
Select Up, Down or All to determine the direction of the search.
-
(Optional) Select one or more of the check boxes:
-
Whole Word: Search for the exact match of a word.
-
Match Case: Search for the exact match of a word (case sensitive).
-
-
Click Find Next to begin (or continue) searching.
Specifying the Time Resolution and Time Span
You use the Time dialog box to specify the time resolution of the content pane and to decide the span of time to which the content pane applies.
To specify time criteria
-
Start the content pane editor; see “Creating or Editing Content Panes”.
-
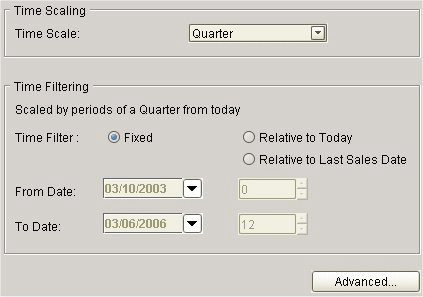
Click Time.
-
In the Time Scale box, specify the time resolution of the content pane. The data in the content pane is aggregated to this time resolution. That is, this option specifies the period of time that each data point in the content pane represents.
-
In the Time Filter box, specify the time period to which the content pane applies:
-
Fixed if you always want the content pane to show a specific time range, regardless of the current date.
-
Relative to Today if you always want the content pane to show a time range relative to today.
-
Relative to Last Sales Date if you always want the content pane to show a time range relative to the last sales date in the loaded data.
-
-
In the From Date and To Date boxes, enter values depending on the time filter you have chosen, as follows:
Time Filter Box Action Relative From Date/ To Date Specify periods in both From and To with the current (computer) date as the reference point.
For example: If the Time Scale is Month, and you want to see results starting from six months before today, enter -6 in From Date.Fixed From Date Enter a specific date as a starting point. To enter a date, click the calendar button and select a date. To Date Specify the number of periods you want to include, starting from the From date. -
To control how dates are displayed in the content pane, click the Advanced button, which brings up the following dialog box:
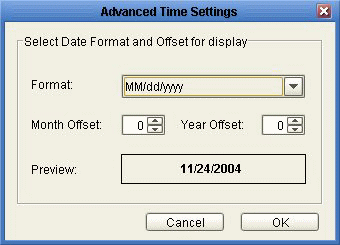
-
In the Format dropdown list, select a display format.
-
To offset the displayed dates, optionally specify values for Month Offset or Year Offset.
For example, to add one month to each displayed date, specify 1 for Month Offset.
The Preview field shows what the first time bucket in the worksheet would look like with this format and offset.
-
Click OK.
Note:
If you change the time scale, the content pane might not show exactly the same aggregate numbers, because the cutoff points for the content pane would not necessarily be the same. For example, suppose your content pane is weekly and displays 48 weeks of data. Then supposed you change it to display quarterly data. A quarter is 13 weeks, and the original span (48 weeks) is not an integer multiple of 13. So the content pane selects a different amount of data and shows different overall results.
-
Specifying Aggregation Levels
Depending on the format of the content pane, you may or may not be able to select levels; this in turn controls which members and combinations are displayed in the pane. The following table summarizes the applicable rules.
| Type | Aggregation levels |
|---|---|
| Members Browser | Select any number of levels. |
| Table | Do not select any levels. |
| Line chart | If you plan to select more than one series, do not select any levels. If you plan to select only on series, select any number of levels. |
| Bar chart | Select any number of levels. |
| Pie chart | Select any number of levels. |
| Calender | Do not select any levels. |
If you do not specify any aggregation levels in a worksheet, the data is completely aggregated across all items and locations (but of course, it may be filtered; you can filter any kind of content pane).
To specify the aggregation levels in a content pane
-
Start the content pane editor; see “Creating or Editing Content Panes”.
-
Click Aggregation.
The system displays the Available Levels and Selected Levels lists.
-
Move all aggregation levels that you want into the Selected Levels list, using any of the techniques in “Working with Lists”.
Note: For content panes that permit multiple levels, this screen controls the order in which the levels are used. (For worksheets, the order of the levels here is ignored, because the Layout screen is used.)
-
Remove any unwanted levels from the Selected Levels list.
See also:
-
Using the Advanced Selection Options
-
Changing the Overall Scale or Unit of Measure
-
Using the Advanced Selection Options
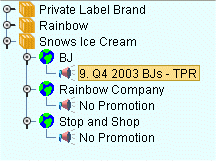
By default, if a content pane includes a promotion level, the pane selects all the following combinations:
-
Combinations that have both sales data and promotions
-
Combinations that have sales data, but no promotions
-
Combinations that have promotions, but no sales data
The content pane displays placeholders for combinations that do not have promotions. For example:
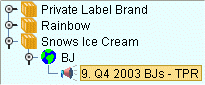
You can exclude some of these combinations. For example, you might want the pane to include only the combinations that have both sales and promotions, as follows:
To exclude combinations that are normally included
-
Start the content pane editor; see “Creating or Editing Content Panes”
-
Click Aggregation.
-
Make sure that the worksheet includes at least two levels, one of which should be a promotional level. When you do so, the screen displays an Advanced button in the lower right.
-
Click Advanced. Oracle displays a dialog box with additional options.
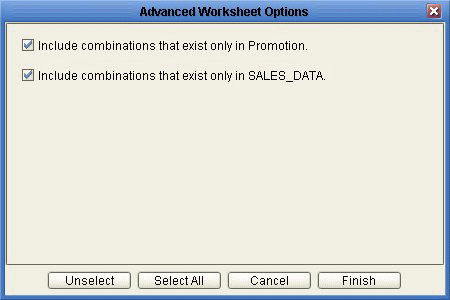
Include combinations that exist only in Promotion This option selects combinations that have associated promotions, even if they do not have sales data. Include combinations that exist only in SALES_DATA This option selects combinations that have sales data, even if they do not have any associated promotions. -
To exclude the combinations you do not want to see, select the checkboxes as needed.
See also Specifying Aggregation Levels.
Changing the Overall Scale or Unit of Measure
Any given content pane uses a single overall scaling factor and a single unit of measure. You can change either or both of these. When you make this change, the displayed values for most or all of the series are changed.
Note: This change affects only the series that are scaled. Not all series are scaled. For example, a series defined as a percentage is probably not scaled.
To change the overall scaling factor
-
Start the content pane editor; see “Creating or Editing Content Panes”.
-
Click Aggregation.
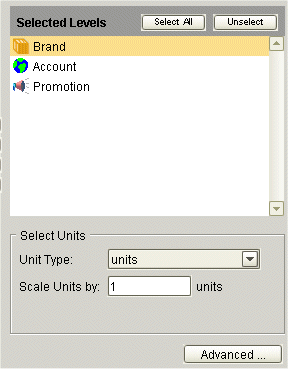
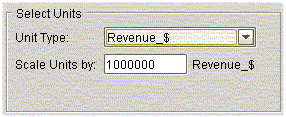
The Levels page includes a section where you specify the overall scale of the content pane, as well as its units of measure.
-
In the Scale Units by box, specify the factor by which all numbers in the content pane are to be divided (for display purposes).
For example, if you specify a factor of 1000, the displayed data will divided by 1000. So the number 96,000 will be displayed as 96. The vertical axis of the graph is updated to show the factor in parentheses.
To change the unit of measure
-
Start the content pane editor; see “Creating or Editing Content Panes”.
-
Click Aggregation.
-
In the Unit Type box, select the unit of measure to display in the worksheet results.
For example, our items are bottles, and suppose that a case that contains six bottles. If you display the content pane with cases instead, the system will display the number of bottles divided by six.
-
If the Index box is displayed, choose an index from the dropdown list.
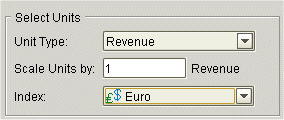
The Index menu lists all the time-dependent indexes and exchange rates that are associated with this unit. Each index or exchange rate is a time-varying factor that the content pane can use. When you select an index, the content pane will automatically multiply all monetary series by the factor for each date. For example, if you choose Consumer Price Index (CPI) as the index, the system will calculate all monetary quantities with relation to the CPI.
Note: These indexes and exchange rates are generally imported from other systems. The set available to you depends upon your implementation.
See also Specifying Aggregation Levels.
Filtering the Content
You can filter any kind of content pane. You specify the scope of the content pane by filtering the data that it displays, so that it displays only selected members of specific aggregation levels. These aggregation levels do not have to be the same as the aggregation levels you display in the worksheet.
This filter is applied in addition to any filters associated with your user access.
In contrast to an exception filter (see Applying Exception Filters), this type of filter is static and behaves the same no matter how the data changes.
To filter data
-
Start the content pane editor; see Creating or Editing Content Panes.
-
Click Filters.
The system displays the Available Filter Levels and Selected Filter Levels lists.
-
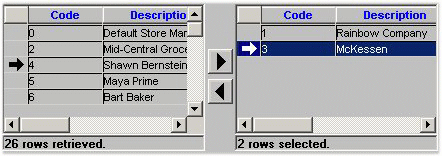
Find the aggregation level at which you want to filter data and move it from the Available Filter Levels list into the Selected Filter Levels list, using any of the techniques in Working with Lists.
-
In the Available Members list, find a member that you want to include in the content pane and move it into the Selected Members list, using any of the techniques in Working with Lists.
At this stage, the content pane includes only data for this member. (Before you applied a filter at this level, the content pane could theoretically include any member of this level.)
-
Continue to move members from the Available Members list into the Selected Members list, until the latter list includes all the members you want.
To filter data further
Once you have applied a filter, the content pane contains only those members that meet the filter criteria that you specified. To avoid performance issues and database errors, there are system limits on the number of members that the each filter can select and that it can display in the Available Filter Level List. Therefore, the visible list may not include all the members that meet the filter criteria that you specified.
You can further filter the data by using either of these techniques:
-
Filter member search: You search for a specific member in the visible list and the specific member is highlighted.
-
Filter member filter: You apply another filter to the visible list to reduce it further.
When you apply a filter member filter to the results of the first filter, it behaves differently depending on whether the visible list is complete or incomplete.
If the visible list from the first filter is complete, it shows all the members that meet the filter criteria that you specified in the initial filter. The second filter member filter searches on the members in the visible list. For example:
-
There is a system limit of 1000 members to display in the visible list
-
You have a worksheet with 10,000 members.
-
You apply a filter at the SKU level and 1000 of the members meet the filter criteria. The visible list displays the 1000 members; the visible list is complete.
-
You apply a filter member filter for which there are 200 matches in the worksheet using both filters.
-
This second filter searches the complete visible list that you retrieved with the first filter and displays the 200 matching members.
If the visible list from the first filter is incomplete, it does not show all the members that meet the filter criteria that you specified in the initial filter. It was subject to system limits. When you apply a further filter to the visible list, the list may not include all the data that you want to filter to. Therefore, this second filter searches on all the members in the full worksheet. For example:
-
There is a system limit of 1000 members to display in the visible list
-
You have a worksheet with 10,000 members.
-
You apply a filter at the SKU level and 2000 of the members meet the filter criteria. The visible list displays 1000 of the 2000 members because of the system limit; the visible list is incomplete.
-
You apply a filter member filter for which there are 200 matches in the worksheet using both filters. However the incomplete variable list only contains 37 members that would match in the worksheet using both filters.
-
If this second filter searched on the visible list, it would only display 37 matching members. Instead, it applies both filters to all the members in the full worksheet and displays the 200 matching members.
See also Applying Exception Filters.
Managing the List of Members
Depending on how your system has been configured, it might contain a very large number of members. If so, you might want to sort or filter the list or search it. For information, see “Managing the Series Lists”.
Applying Exception Filters
You can apply an exception filter to any kind of content pane. If you do so, Oracle Demantra checks the values of the data and displays only the combinations that meet the exception criteria. In contrast to an explicit filter (“Filtering the Content”), this type of filter is dynamic and can behave differently as the data changes.
Specifically, you define an exception condition that consists of a series, a comparison operator, and a value, for example:
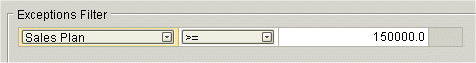
When you open the content pane, Oracle Demantra checks each combination in the content pane. For each combination, if the condition is met for any time in the worksheet date range, Oracle Demantra displays that combination. For example, the content pane shows combinations that have Sales Plan values greater than or equal to 150000, within the time range included in the worksheet.
If the condition is not met at any time for any of the worksheet combinations, Oracle Demantra shows the worksheet as empty. That is, if all values in the Sales series are less than 150000 for all combinations, the worksheet comes up empty.
Note: If the worksheet includes a promotion level or a promotion series, the behavior is slightly different. In this case, the Members Browser or dropdown list does initially show all combinations. When you click display a combination to display it, the worksheet then checks for exceptions.
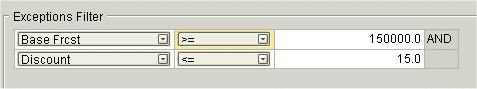
You can apply multiple exceptions. When you do so, you can relate them to each other through logical AND or logical OR relationships. For example:
To apply an exception filter
-
Start the content pane editor; see Creating or Editing Content Panes.
-
Click Exceptions.
The Exceptions Filter page appears.
-
Click Add.
-
In the first box in the new row, select a series from the dropdown list.
Note: Typically only some series are available for exceptions. If you do not see a series you need, contact your Oracle Demantra administrator or your implementors.
-
In the second box, select an operator from the dropdown list.
-
In the third box, type or choose a value.

-
For a numeric series, type a number.
-
For a dropdown series, choose one of the allowed values of this series.
-
For a string-type series, type any string. You can use the percent character (%) as a wildcard.
-
For a date-type series, type a date or use the calendar control to choose a date.
-
-
(Optional) You can apply additional exceptions. Click the AND or the OR radio button to specify that the relationship between the exceptions.

To delete an exception filer
Click the exception and then click Delete.
See also Filtering the Content.
Sharing Content Panes
In general, any content pane is one of the following:
-
Private—available only to you
-
Public—available to other users as well.
In either case, the original creator of a pane owns it and only that person can change it.
When you do share content panes, however, you should consider data security. Oracle Demantra automatically prevents any user from seeing data for which he or she does not have permissions. If you build a content pane with data that other users do not have permissions to view, then those users will see an empty content pane. Similarly, if a user has partial permissions for the data, then the content pane will open with only those results that are permitted.
See also Configuring the Basics.
Deleting Content Panes
You can delete a content pane if you are its owner.
To delete a content pane
-
Display the content pane in Collaborator Workbench.
-
Click the Delete button.
Oracle Demantra prompts you to confirm the deletion.
-
Click Yes or No.