Using the Engine Administrator and Running the Engine
Before you run the Analytical Engine for the first time, it is useful to ensure that you have configured it correctly. This chapter describes how to administer the analytical engine.
This chapter covers the following topics:
- Before Running the Analytical Engine
- General Notes about Running the Analytical Engine
- Registering the Analytical Engine
- Starting the Engine Administrator
- Configuring Engine Settings
- Running the Engine from the Engine Administrator
- Running the Engine from the Start Menu
- Running the Engine from the Command Line
- Troubleshooting
- Viewing the Engine Log
- Examining Engine Results
- Running the Engine in Recovery Mode
- Stopping the Engine
Before Running the Analytical Engine
Before you run the Analytical Engine for the first time, it is useful to ensure that you have configured it correctly.
-
Make sure that you have installed the correct version of the Analytical Engine and that you have set the RUNMODE parameter correctly; see "Configuring the Engine Mode".
-
Make sure the engine is registered on all the machines where you want to use it. See "Registering the Analytical Engine."
-
Make sure that you have enough (and not too many) observations for every node in your forecast tree, as needed by the engine models you plan to use.
If a node is left with no suitable model, the Analytical Engine will not forecast on that node. Instead it will forecast at a higher level, if possible.
-
Various configurable fields contain parts of SQL queries used by the engine during run and may fail the engine if configured incorrectly. Common reasons for failures are misspellings, references to non existent columns, or using functions or syntax not compatible with the database server.
To check all your engine-related SQL, check the following tables:
-
In the Init_Params_* tables, check the parameters quantity_form and UpTime.
The default expression for quantity_form transforms negative values to zero. This is considered best practice, and should be modified only if there is a direct need for the analytical engine to see negative demand and for negative proportions to be calculated. Care must be taken when enabling negative proportions, as allocation using negative proportions may result in violation of business rules
-
In the causal_factors table, the Local_Funct column uses SQL.
-
(For PE mode) In the m3_causal_factors table, many settings here use SQL.
-
-
Make sure that the database is configured correctly, specifically the table extents. Also, if you have loaded the Demantra schema from a dump file, make sure that the current database contains table spaces with the same names as in the original database.
-
Determine the best number of branches for the Analytical Engine to use for the current forecast tree. See "Viewing Branch Information".
General Notes about Running the Analytical Engine
-
The first engine run takes longer than later runs. This is because the Analytical Engine must set up internal tables on its initial run. You can reduce the length of time of the first engine run; see "Reconfiguring the sales_data_engine Table".
-
You cannot run the Analytical Engine in batch mode unless the Business Logic Engine is closed and no simulation is running.
-
On older Windows NT versions, you may get errors on running the Analytical Engine (2K DLL missing). To solve this, run the file mdac_typ.exe before running the Analytical Engine. (This executable is located in the bin directory under the Analytical Engine directory)
Also see
"Introduction to the Analytical Engine"
Registering the Analytical Engine
The installer registers the Analytical Engine for you, but in case of problems, you can register the engine manually. To do so, run the batch file Demantra_root/Demand Planner/Analytical Engines/bin\RegEngine.bat.
If your system includes the Distributed Engine, you can run the engine on multiple machines. You do not need to install it on every machine; you need only to register it on them. These machines must also be running the appropriate database client software, so that they can communicate with the Demantra database.
For information on choosing the machines to run the engine, see "Choosing Machines to Run the Engine".
Starting the Engine Administrator
The Engine Administrator is a desktop-based user interface that lets you perform the following general tasks:
-
Specify settings for the Analytical Engine. You save the settings in an XML file for convenience. You can open and use settings files that you have previously saved.
-
Run the Analytical Engine itself.
-
View the engine log.
To start the Engine Administrator
-
On the Start menu, click Programs.
-
Click Demantra > Demantra Spectrum release > Engine Administrator.
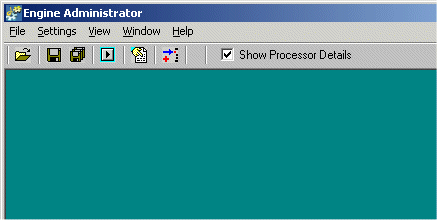
The Engine Administrator screen appears.
-
Here you can do the following:
-
Specify settings for the Analytical Engine. You save the settings in an XML file for convenience.
-
Run the Analytical Engine itself.
-
View the engine log.
-
Configuring Engine Settings
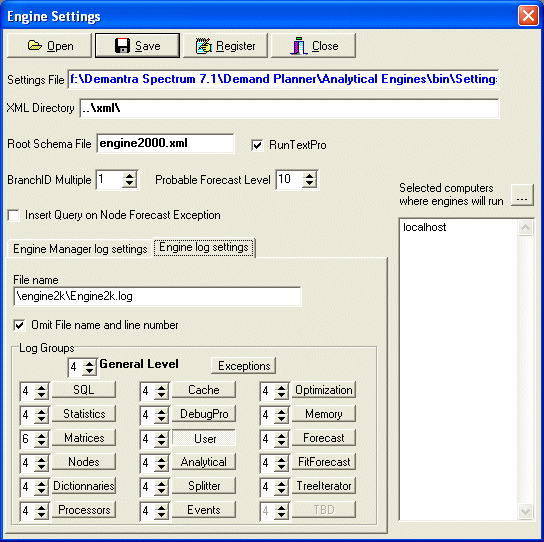
Engine configuration settings are edited in the Engine Settings window and saved in the file named settings.xml. When the engine starts, it reads the settings from this file.
To open the Engine Settings window
-
Click Settings > Configure Engine Settings. Or click the Configure Engine Settings button.
The Engine Settings window appears.
To load settings
-
Click Open.
-
Select settings.xml from the bin directory of the Analytical Engine.
The Settings File field displays the location of settings.xml.
-
Complete the fields as needed; see "Engine Settings".
-
Optionally choose different machine(s) to run the engine; see "Choosing Machines to Run the Engine".
-
To save your settings, click Save.
-
To register your settings, click Register.
Engine Settings
You can configure the following settings.
Choosing Machines to Run the Engine
If your system includes the Distributed Engine, you can run the engine on multiple machines; see "Registering the Analytical Engine". Otherwise, Oracle Demantra runs the Analytical Engine on only one machine.
To choose the machines to run the engine
-
Click the button next to the Selected computers field, shown here.

The Engine Administrator displays the following screen:
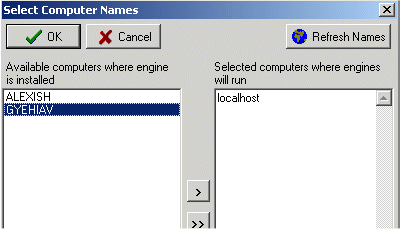
The left list shows the machines on which the Analytical Engine has been installed. The right list shows the machines where the Analytical Engine will run.
-
Click the arrow buttons to move machine names to and from the right list.
-
Click OK.
Viewing Branch Information
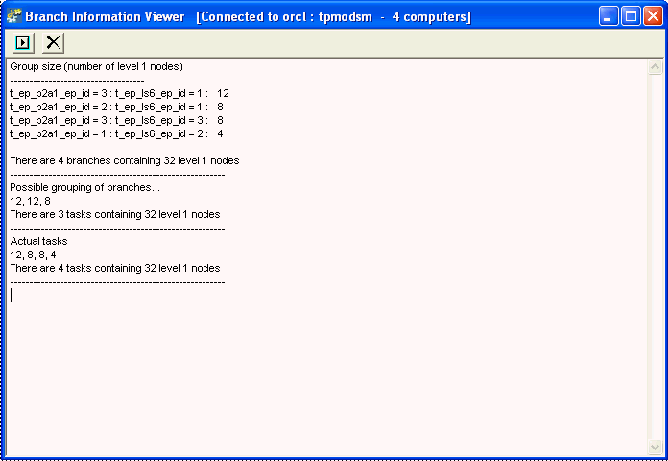
Internally, the Analytical Engine divides up each forecast tree into multiple branches and sends each branch to a different engine server. On one hand, it is useful to declare many branches, so that each engine will have less work. On the other hand, it is useless to declare more tasks than the forecast tree can possible include. Therefore it is useful to understand what the branches of a given forecast tree would be like.
To view branch information for a given forecast tree
-
Click View > Branch Information.
The Branch Information Viewer window appears.
Running the Engine from the Engine Administrator
Before running the Analytical Engine, make sure that there are no old engine processes running in the chosen host machines.
To run the engine
-
Start the Engine Administrator.
-
Click File > Run Engine. Or click the Run Engine button.
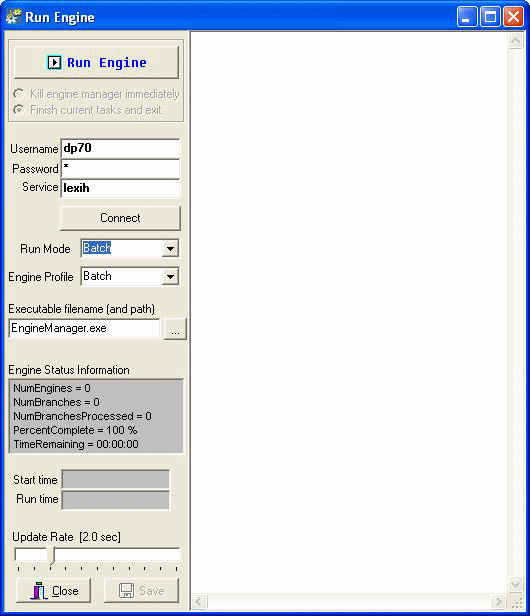
The Run Engine window appears.
-
Complete the fields Username, Password, and Service.
-
Click Connect.
-
For Engine Profile, choose an engine profile, which specifies the parameter settings to use during this engine run.
-
Enter EngineManager.exe in the Executable Filename (and path) field. This executable resides within the bin directory of the Analytical Engine.
-
Click Run Engine.
The Engine Status Information area displays the following:
-
Number of engines running
-
Number of branches (you use multiple branches when you have a large database)
-
Number of branches processed
-
Percent complete
-
Start time of the engine run, time remaining (if any), and end time (if finished)
The white text area in the right side of the Run Engine window displays the log.
-
-
To adjust the rate at which the log area is filled with data, drag the Update Rate slide to the left (slower) or to the right (faster).
-
The log shown in the text area can be saved to a file by clicking Save to file.
-
Under Terminate Engine Manager, select one of the following:
-
Finish current tasks and exit. This clears the queue of branch IDs (the messages sent by the Engine Manager to the engine servers). This allows the engine servers to complete their current processes. When they do not receive any further branch IDs, they shut down in an organized fashion. This is the recommended shutdown method in most circumstances. It is possible to continue processing at a later time.
-
Kill Engine Manager Immediately. This stops the Engine Manager immediately. The engine servers will continue for a while but when they notice that the Engine Manager has stopped, they will cease operation. Use this method when a quick shutdown is required, such as during debugging.
Note: Do not restart the Engine Manager if one or more engine servers are still running. Wait until they stop or close them using Windows Task Manager.
-
-
Click Stop.
See also
"Running the Engine from the Start Menu"
"Running the Engine from the Command Line"
Running the Engine from the Start Menu
To run the Analytical Engine from the Start menu
-
To run the engine in batch mode: on the Start menu, click Programs. Then click Demantra > Demantra Spectrum release > Analytical Engine.
-
To run the engine in simulation mode: on the Start menu, click Programs. Then click Demantra > Demantra Spectrum release > Simulation Engine.
See also
"Running the Engine from the Command Line"
"Running the Engine from the Engine Administrator"
Running the Engine from the Command Line
To run Analytical Engine from the DOS window
It is useful to be able to run the Analytical Engine from the command line, which you may want to do from within a workflow, for example.
-
In a DOS window, change to the following directory: Demantra_root/Demand Planner/Analytical Engines/bin
-
In this directory, enter one of the following commands:
-
To run the Analytical Engine with a specific engine profile: EngineManager.exe mode profile
-
To run the Analytical Engine on Oracle with a different database: EngineManager.exe TnsName UserID password mode profile
-
-
Notice that the parameters are order-dependent; this means that you must use one of the syntax variants given here, with all the parameters as shown for that variant. These parameters have the following meanings:
TnsName The server TnsName User ID The DB identifier. Password The DB password Mode Integer that indicates the engine profile to run: -
1=Batch mode
-
2=Single Node
-
3=Full Divider
-
99=Simulation
Profile ID Engine Profile ID to use (from the ENGINE_PROFILES table) Tip: You can create a Collaborator Workbench menu item that runs these commands; see "Configuring Links in Collaborator Workbench".
See also
"Running the Engine from the Start Menu"
"Running the Engine from the Engine Administrator"
-
Troubleshooting
This section contains tips that address specific error conditions that you could encounter:
-
If the Analytical Engine fails to run, see the list in "Before Running the Analytical Engine".
-
If the engine failed while running an SQL statement, check the following logs:
-
manager.log
-
engine2k.log
Find the offending SQL and try running it within a third-party database tool to identify the problem.
If the engine iterator failed, resulting in the error "node not found in map," that indicates a problem in the mdp_matrix table. Usually, this means that you need to set the align_sales_data_levels_in_loading parameter to true and then run the MDP_ADD procedure. (For information on this parameter, see "Non-Engine Parameters".)
-
-
If the Analytical Engine run does not finish and gives a message saying that it is stacked at some node or that it "does not have a usable number of observations," this means that the mdp_matrix table is not in a good state. To correct the problem, run the MDP_ADD procedure.
-
If the Engine Administrator displays the message "Can not initialize caches," that may mean that your database is too large for the given number of branches. Reconfigure the engine to run on more branches and try running it again. See "Running the Engine from the Engine Administrator".
-
If the Analytical Engine fails or generates errors when processing large amounts of data, use the MaxEngMemory parameter. As each engine task is completed, the Engine Manager evaluates the amount of memory currently used by all analytical engine processes on the machine. If this amount (expressed in megabytes) exceeds the value of MaxEngMemory, the engine instance is stopped and a new instance is initiated. For example, if this parameter is set to 250, a new engine instance is initiated at the end of each task that consumes more than 250 MB of memory.
-
PE only: If you receive a message like "ERROR Node not found in map", that means that something is wrong with synchronization between sales_data and mdp_matrix. To correct the problem, truncate mdp_matrix and run the MDP_ADD procedure.
-
Oracle only: If the Analytical Engine takes an unreasonably long amount of time to create the sales_data_engine or the promotion_data table, make sure that you have done an analyze table on these tables.
-
Oracle only: If you receive a message such as "Description: ORA-00959: tablespace 'TS_SALES_DATA' does not exist," that typically means the dump file you installed refers to different table spaces than you have in the current database. Reassign the Demantra table spaces by changing the parameters that control them:
-
indexspace
-
sales_data_engine_index_space
-
sales_data_engine_space
-
simulationindexspace
-
simulationspace
-
tablespace
-
For information on these parameters, see "Non-Engine Parameters".
Validating Input Parameters
Validating engine and model input parameters is used to identify the source of errors caused by configuration issues and errors. This streamlines and shortens the troubleshooting process and reduces the need for support.
-
Parameters:
-
The Analytical Engine loads the 'Parameters' data from the PARAMETERS table.
-
The engine then loads the 'Parameters' data from 'Parameters Daily.xml', 'Parameters Monthly.xml', or 'Parameters Weekly.xml' depending on 'timeunit'.
-
-
InitParams:
-
The Analytical Engine loads the 'InitParams' data from INIT_PARAM_0 table.
-
Then the engine loads the 'InitParameters' data from 'Init Params 0 Daily.xml', 'Init Params 0 Monthly.xml', or 'Init Params 0 Weekly.xml' values.
-
The Analytical Engine loops through parameters from xml, validates them against the database parameters, fixes the collected parameters, or adds the missing parameters in the database.
The validation rules are configurable. If they belong to the current run, you can specify the parameter group, and the restrictions by which the parameters are compared.
If any of the input parameters fails the validation, the system replaces the erroneous parameters with the default value if the restriction does not contain '?'. Otherwise, the system simply generates a warning message to inform the user of the erroneous input parameter.
Note: Demantra supports only the following type "double" validations for parameters:
-
1 - All the groups - always validate
-
2 - DP batch
-
3 - PE batch
-
4 - DP simulation
-
5 - PE simulation
Example 1
<Entry>
                <Key argument="AllowNegative"/>
                <Value type="double" argument="0"/>
                <Validate group="1" restrict="=1,=0"/>
</Entry>
The above-mentioned validation means "Allow Negative" parameter of type "double" with default value "0". The validation belongs to group "1" thereby run during all engine runs and its value can either be "1" or "0"
Example 2
<Entry>
<Key argument="lead"/>
<Value type="double" argument="52"/>
<Validate group="3,4" restrict=">0,?<=100"/>
</Entry>
The above-mentioned validation means "lead" parameter of type "double" with default value "52" belongs to group 3 and 4, for which the value must be greater than "0" and less or equal to "100". The "?" means that it is not mandatory to fix the parameter if it is greater than "100". If under 0 the parameter would warn the user and replace the value with 52 while if greater than 100 a warning will be generated but not override would occur.
Example 3
<Entry>
                <Key argument="PROMO_AGGR_LEVEL"/>
                <Value type="double"/>
                <Validate group="3,5" restrict=""/>
</Entry>
The above-mentioned validation means "PROMO_AGGR_LEVEL" parameter of type double with no default parameter belongs to group 3 and 4, and the validation is done through custom function. The engine will quit running if the validation fails
To add the custom function to the process, you should add your function to ..\Common\Util\Validation Functions.cpp.
Then add the name and address of this function to the array of function pointers, so that the application can execute this function dynamically:
m_mPoint2Function["PROMO_AGGR_LEVEL"]= PromoAggrLevel;m_mPoint2Function["PROMO_AGGR_LEVEL"]= PromoAggrLevel;
Viewing the Engine Log
The log viewer helps you debug the engine run. The log for the Analytical Engine appears in a text file in the directory Demantra_root/Demand Planner/Analytical Engines/bin.
To open the log file viewer
-
Start the Engine Administrator.
-
Click the View log file button.
To view a log file as it is
-
Click the Open with Tree View button.
-
When the Processors check box is chosen in Log Groups, you can view the log file with processors tree assistance. If you click on a processor in the right side of the Log File window, you are brought to the corresponding line in the log file.
Examining Engine Results
This section contains assorted tips on viewing and understanding the engine results from a more technical point of view.
Seeing What Level the Forecasting Was Done
When forecasting, the Analytical Engine writes information to the mdp_matrix table to indicate where it performs the forecast. For each combination, it writes this information to the following columns:
-
level_id is the strategy in the forecast tree where the forecast for this combination was generated. Strategy includes data aggregation level referred to as detail node and possible pooling of detail nodes into longer time series referred to as range.
Seeing if Any Nodes Were Not Forecasted
To see if any nodes failed to receive a forecast, run the following SQL:
SELECT level_id, COUNT(*) FROM MDP_MATRIX WHERE prediction_status=1 GROUP BY level_id
Explanation: At the start of the run, the engine iterates through all forecastable nodes and sets their level_id to the fictive level. As it forecasts the nodes, it resets the level_id back to normal. At the end of the run, if you have nodes with a level_id = fictive level, those nodes did not get a forecast.
Possible reasons:
-
The forecast tree might not be well formed.
-
There might not be any models that can work on at the Top Forecast Level.
-
There might be nodes that do not have the correct number of observations for the models.
-
Naive forecasting might be off; see "Forecast Failure".
Writing Intermediate Results
In a batch run, the Analytical Engine can write intermediate results to the database, to help you determine the source of a problem. To enable this, set the WriteIntermediateResults parameter to yes (1) and then run the engine. When this flag is enabled, the Analytical Engine writes intermediate results to the INTERM_RESULTS table.
Warning: Use this feature only with help of Oracle consulting. This feature may greatly inflate the engine run time.
You can also configure the engine to write forecast data for each node, before splitting to lower levels. This data is written to the NODE_FORECAST table, which includes information on how each model was used for that node. To enable this, set the node_forecast_details parameter to forecast is written with model details (1) before running the engine.
To edit these parameters, use the Business Modeler.
Running the Engine in Recovery Mode
Internally, the Analytical Engine records information to indicate its current processing stage. As a result, if the previous engine run did not complete, you can run recovery, and the Analytical Engine will continue from where it was interrupted.
To run the engine in recovery mode
-
In the Business Modeler, set the start_new_run parameter to either No or Prompt.
-
Start the Analytical Engine as described in "Running the Engine from the Engine Administrator" or "Running the Engine from the Start Menu".
Stopping the Engine
Normally the Analytical Engine stops on its own when it has completed processing.
If you are automating processes, you may want to make sure that the Analytical Engine is not running, before starting it again.
In the directory Demantra_root/Demand Planner/Analytical Engines/bin, there is a batch file that you can use to kill the engine manager (and therefore the engine as well). This is called KillEngine.bat.
Tip: After killing the Analytical Engine, it is advisable to wait about 10 seconds before starting a new one.